| Previous Month | Next Month |
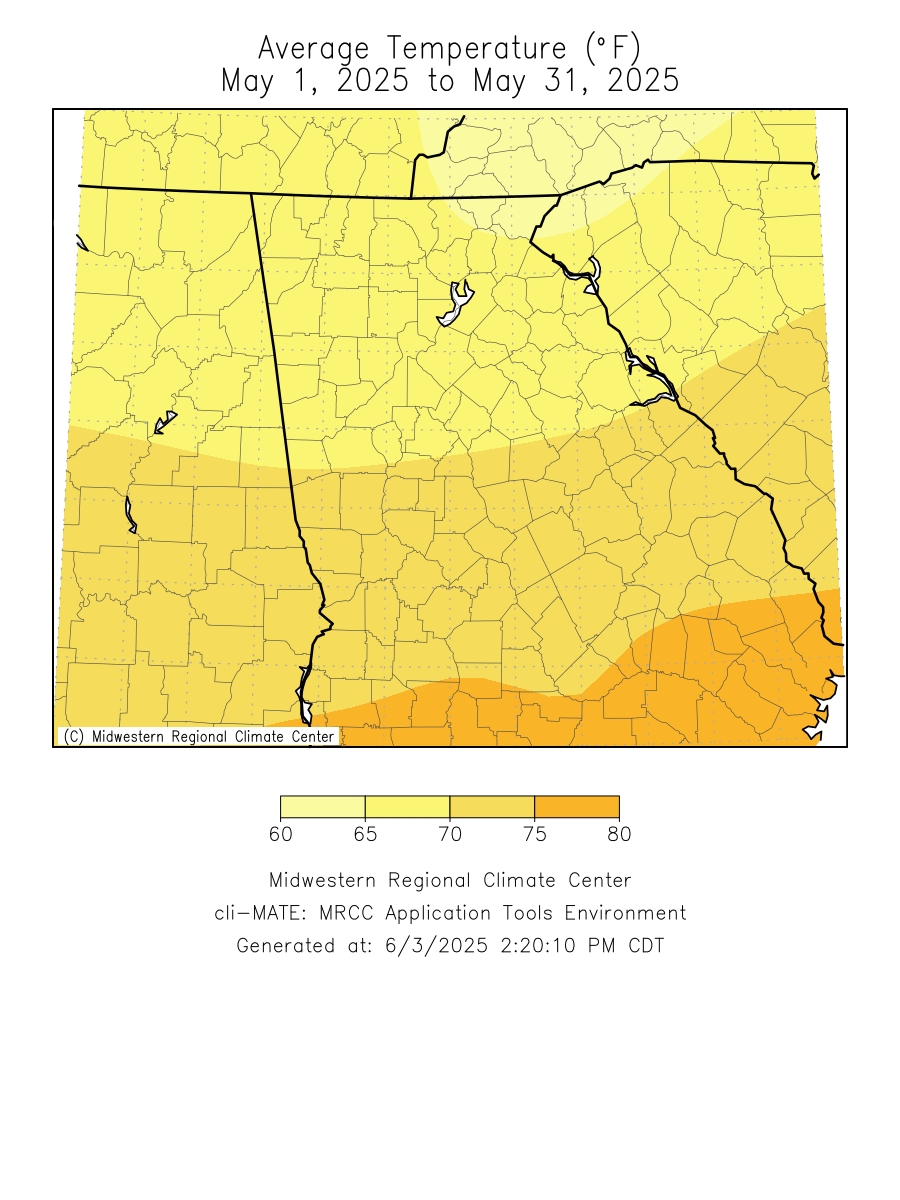
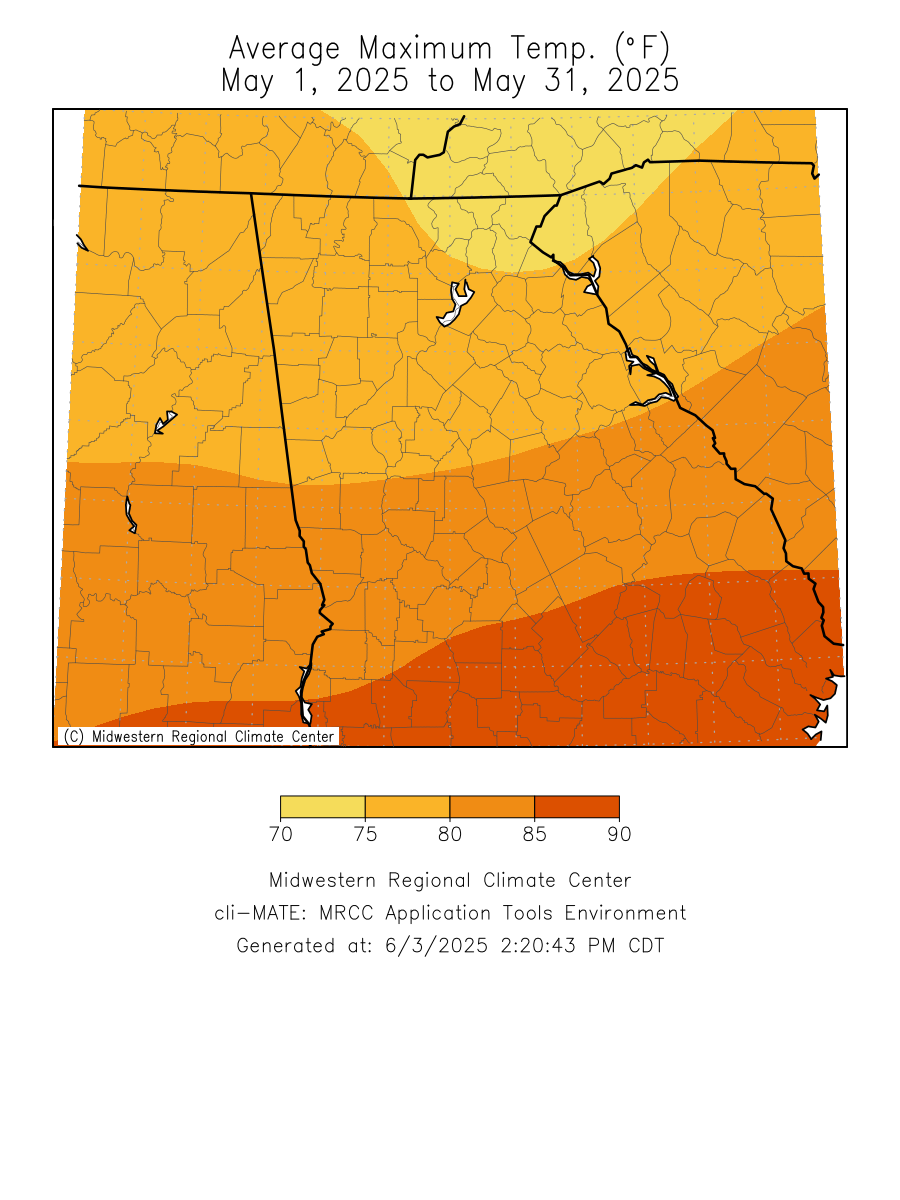
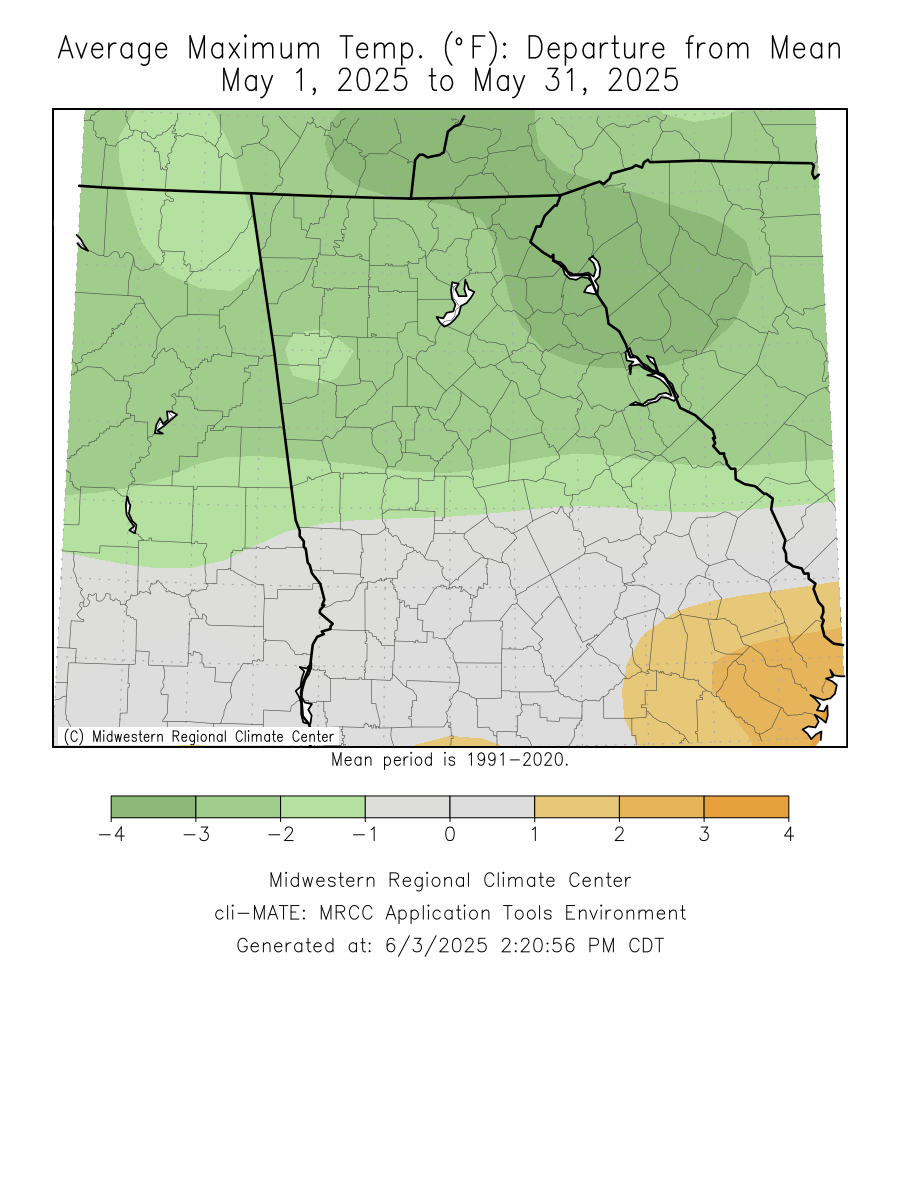
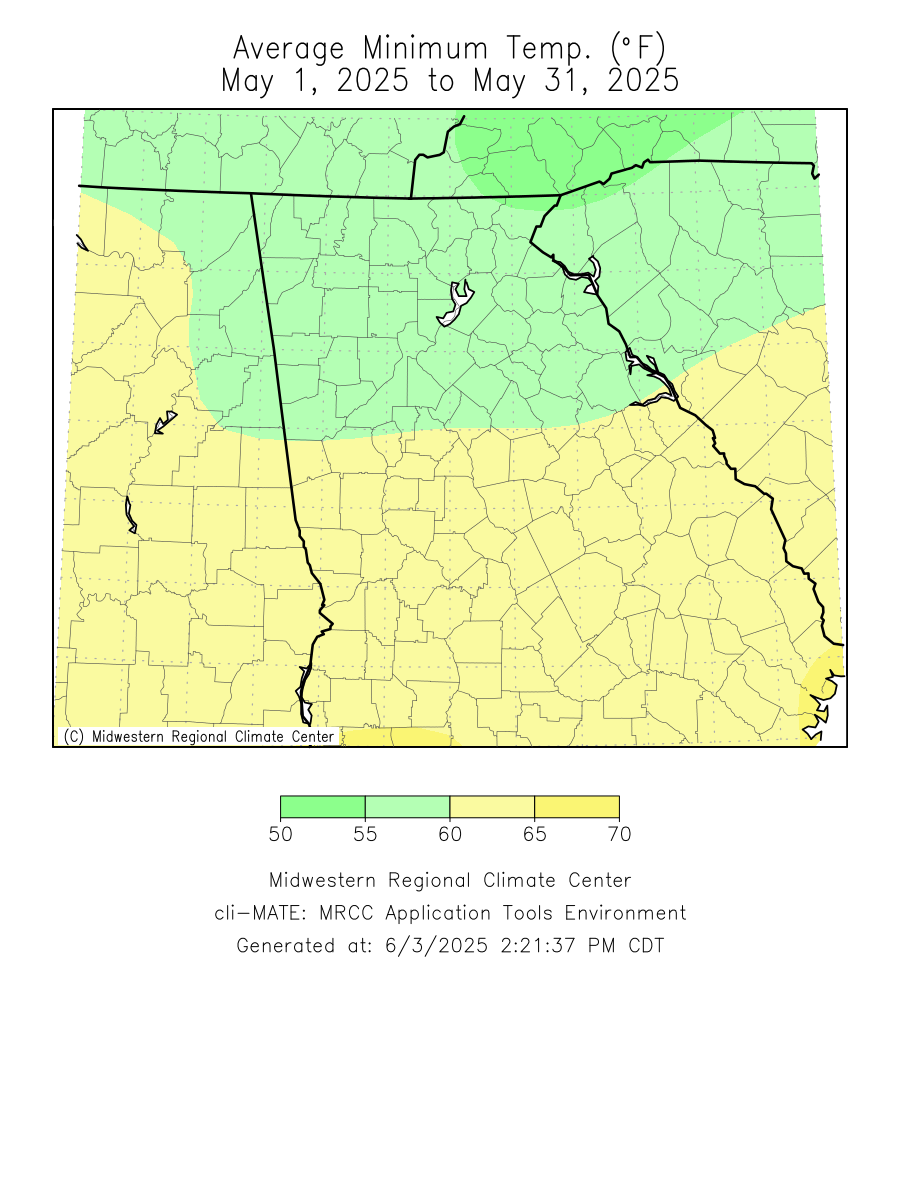
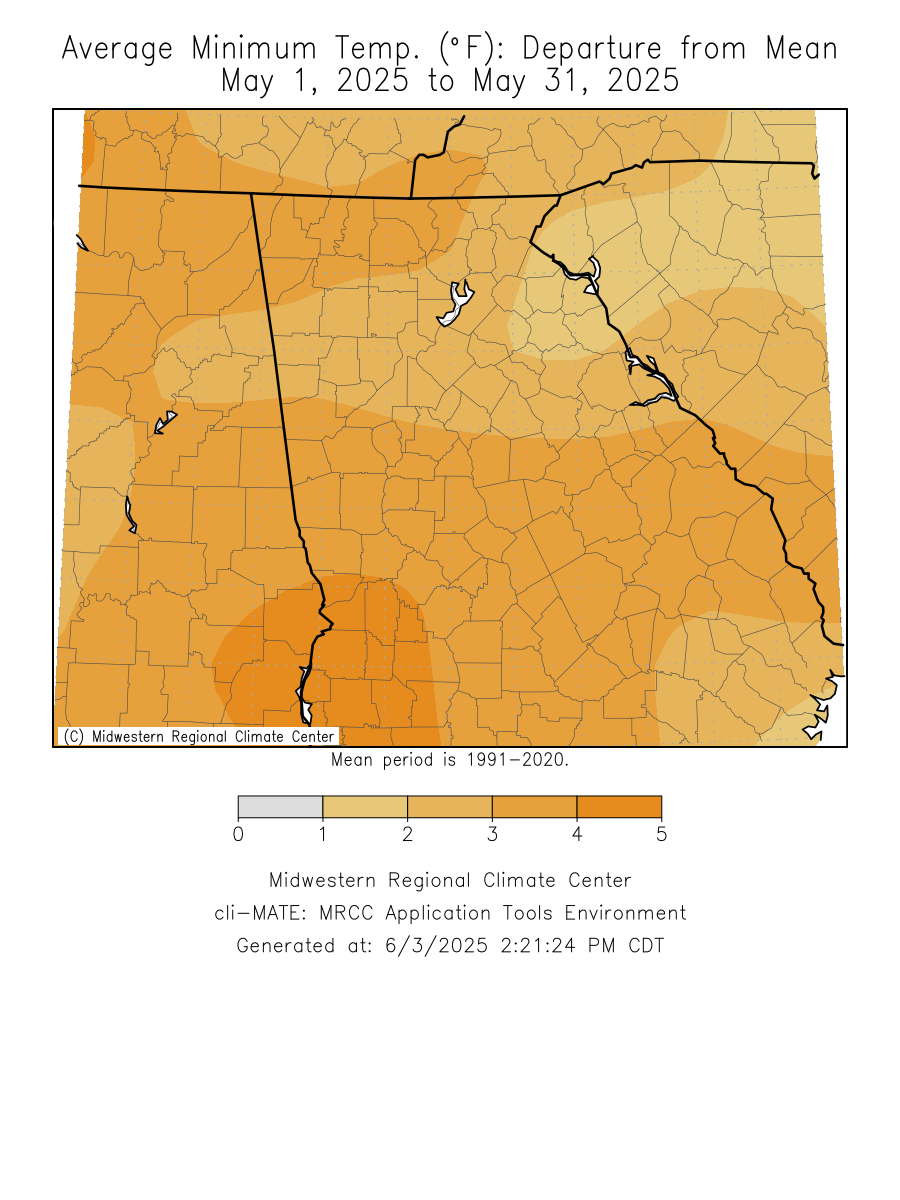
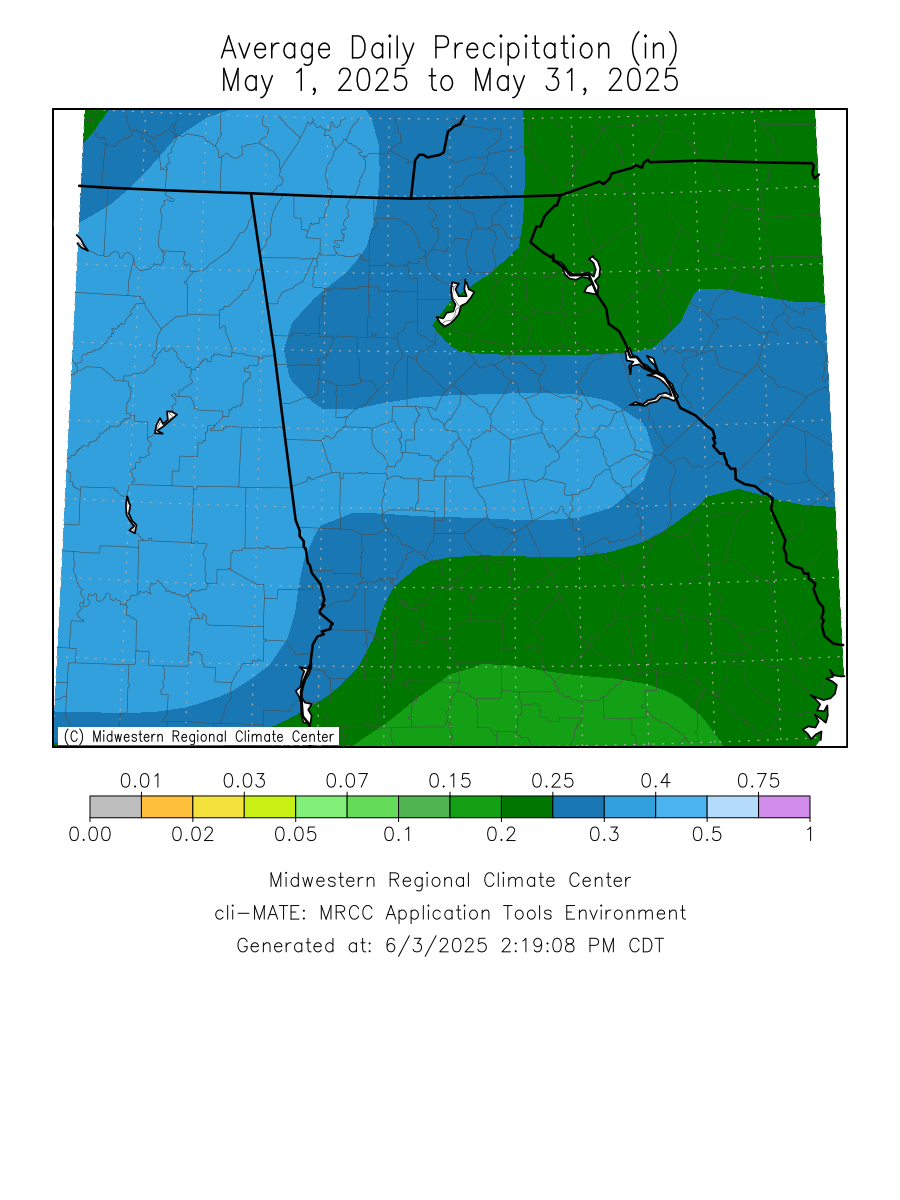
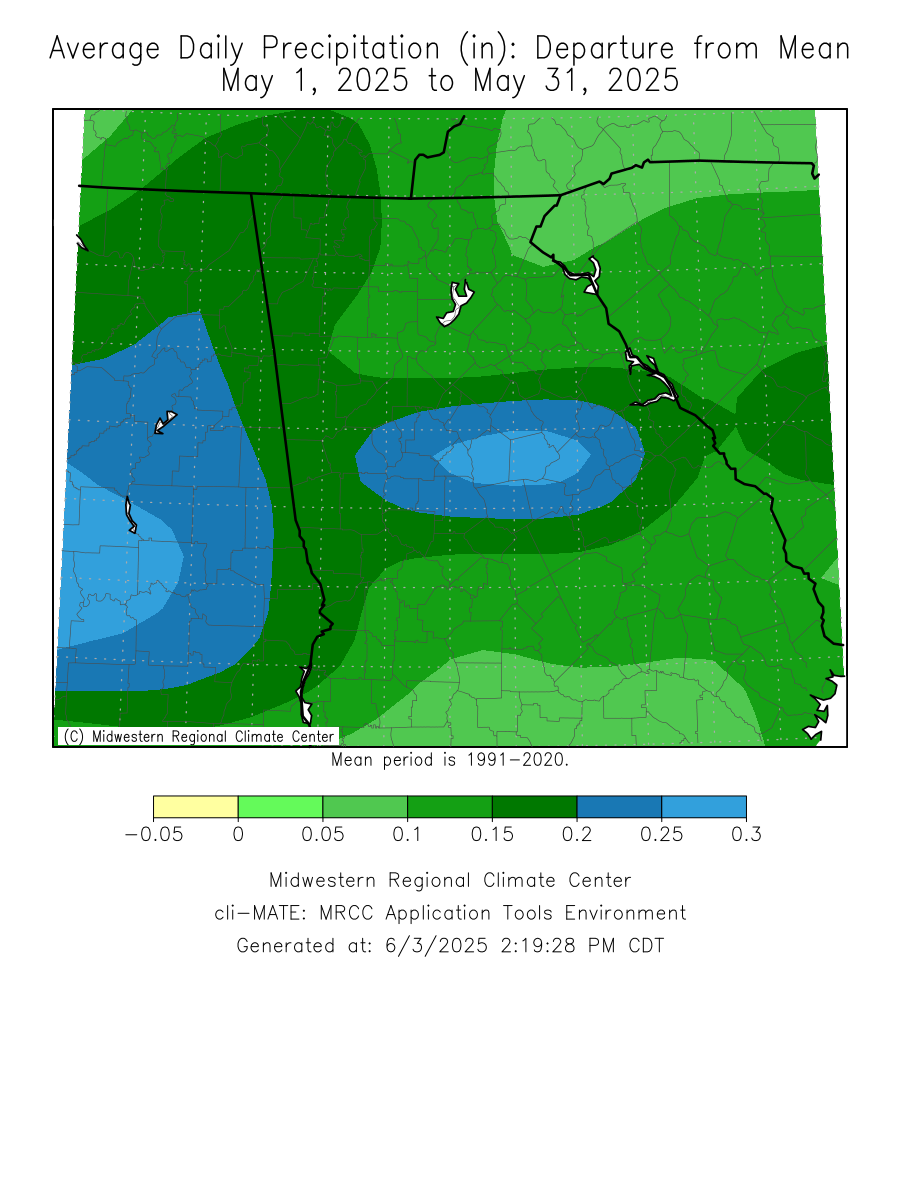
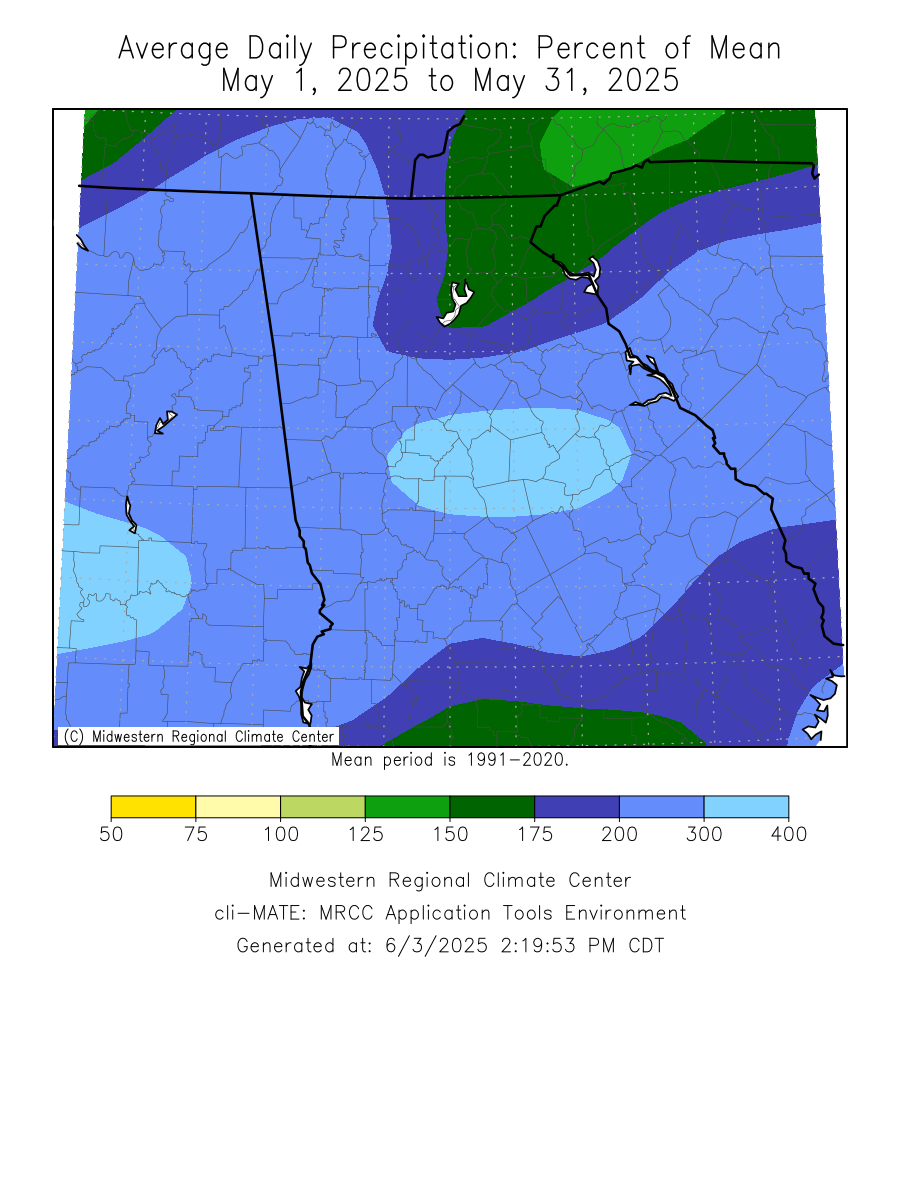
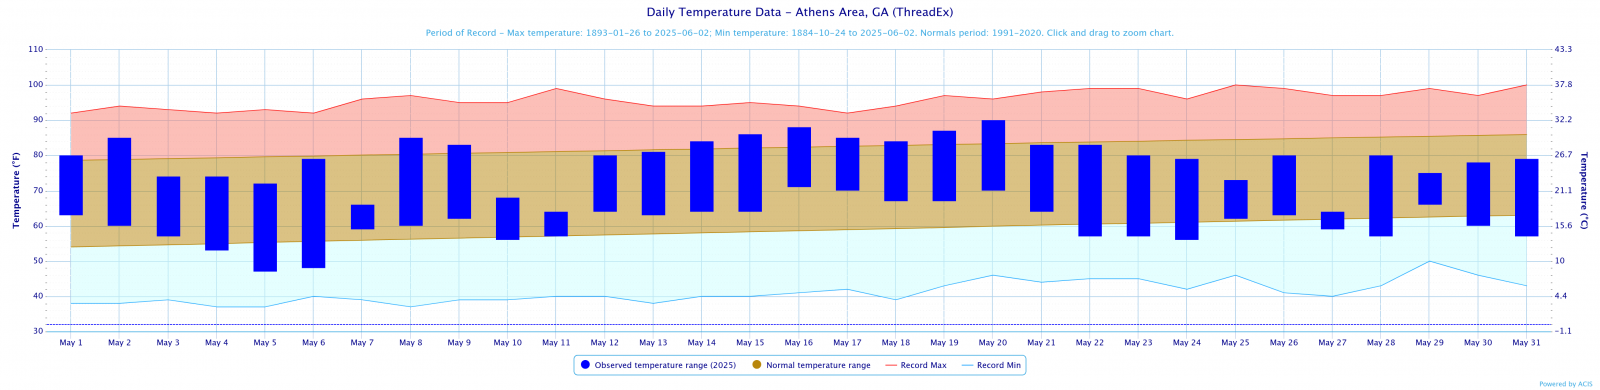
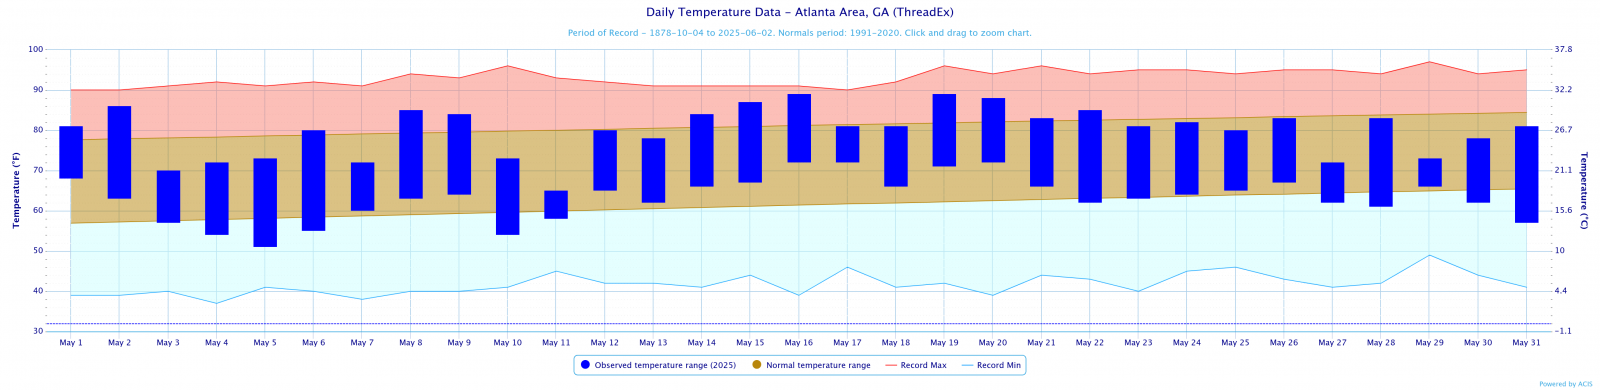
Temperatures through the month of May were around normal. Precipitation totals through the month of May were around 4 inches above normal.
Climate Site Maximum Temperature Max T Date *Indicates a daily record was set Climate Site Total Precipitation DFN (Departure Climate Site Maximum Daily Precip (in inches) Max P Date *Indicates a daily record was set Data prepared by NWS Peachtree City/Atlanta May Tornadoes Over the course of May, there were 15 tornadoes that occurred across north and central Georgia. Many of these tornadoes were rated EF0 and EF1 but there was one EF2 in Henry County. Throughout May there were multiple MCS (Mesoscale Convective System) lines that pushed through north and central Georgia that spawned most of these tornadoes. The EF2 tornado did result in 2 injuries unfortunately. For more information check out these links below. May 2nd, 2025 Map of the 15 Tornadoes for May Based on the Climate Prediction Center's outlook for June, North and central Georgia have 33-40% chance of above normal temperatures. North and central Georgia have an 40-50% chance of above normal precipitation. Data prepared by NWS Peachtree City/Atlanta.
Overview
Climate Graphs
Records
Events
June Outlook
Below are the overview stats for May 2025 for our 9 climate sites.
May 2025 Climate Averages
Climate Site
Month Temp (°F)
Average Temp
Departure from normal
Athens
69.9
70.3
-0.4
Atlanta
71.6
71.1
0.5
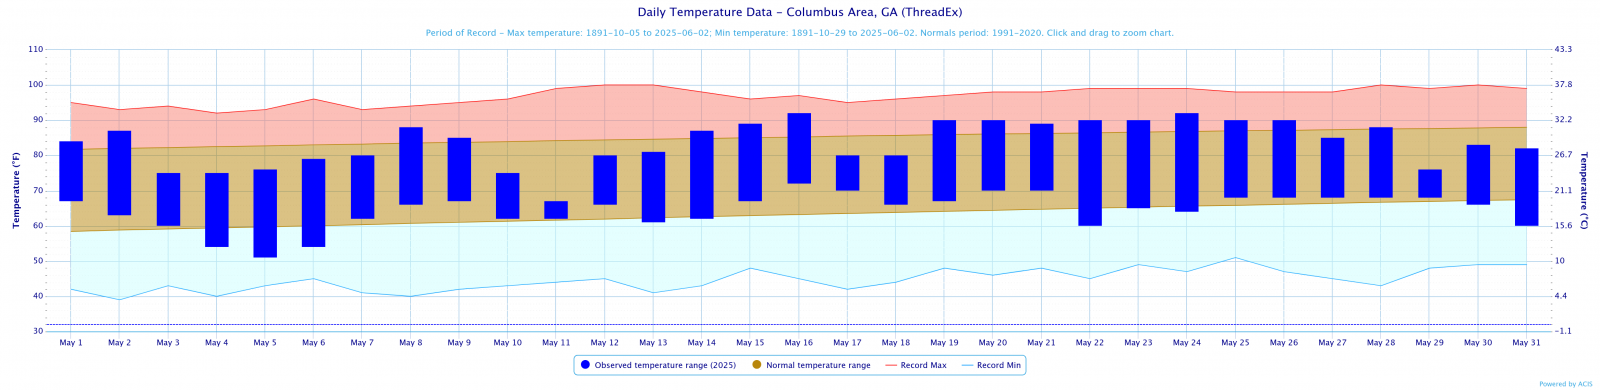
Columbus
74.1
74.0
0.1
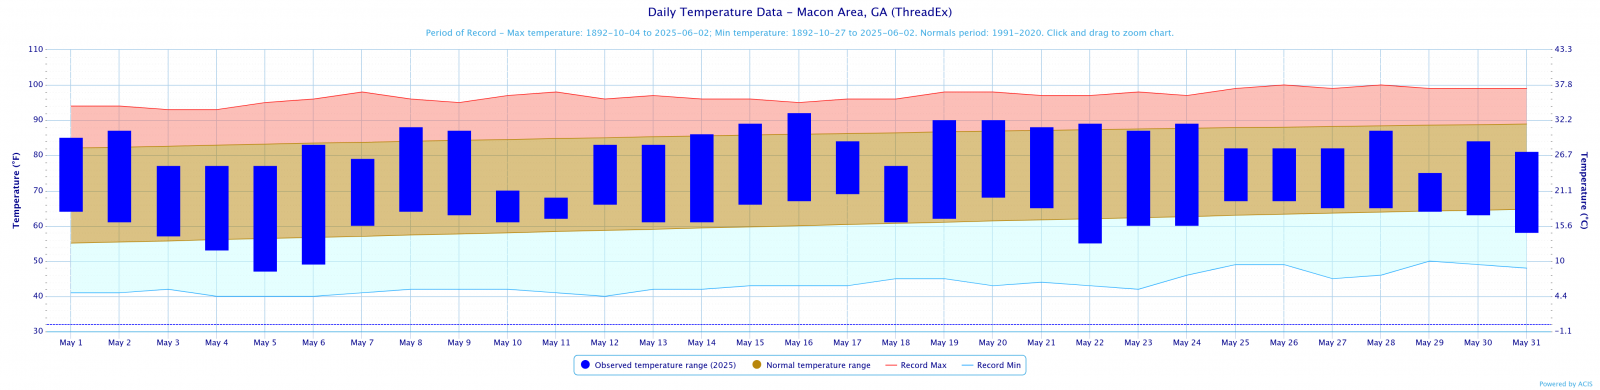
Macon
72.5
72.8
-0.3
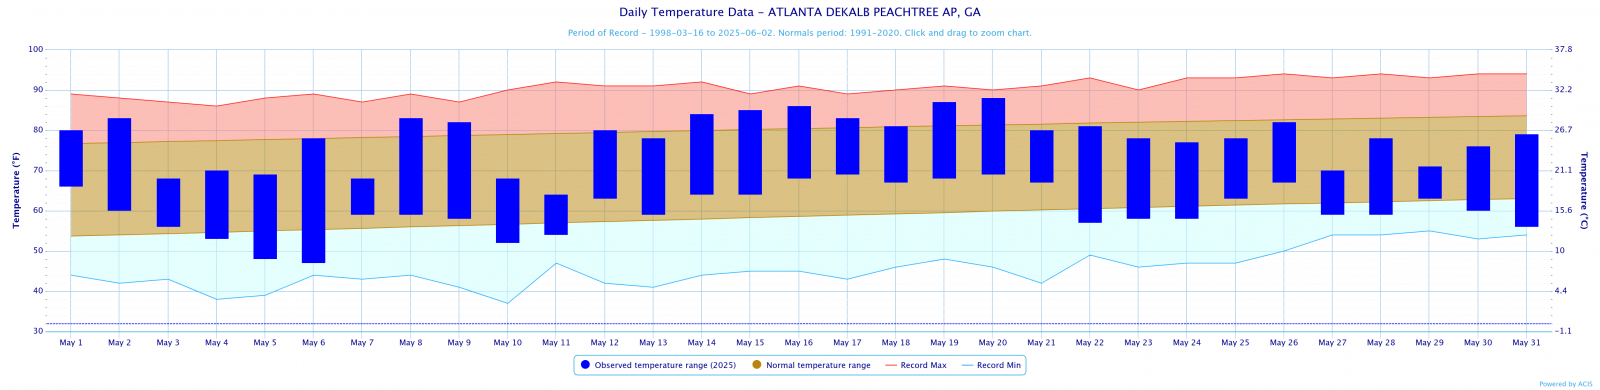
Dekalb Peachtree Arpt
69.2
69.4
-0.2
Fulton Co Arpt
69.5
69.7
-0.2
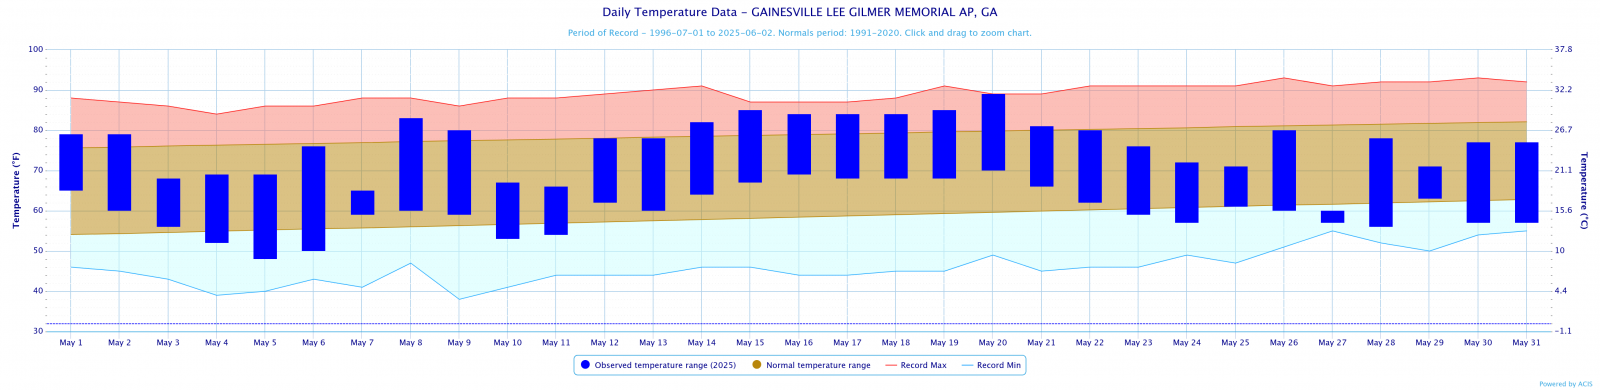
Gainesville
68.4
68.5
-0.1
Peachtree City
69.5
70.2
-0.7
Rome
69.4
69.4
0.0
May 2025 Temperature Climate Statistics
Minimum Temperature
Min T Date
Athens
90
5/20
47
5/5
Atlanta
89
5/19
51
5/5
Columbus
92
5/16,24
51
5/5
Macon
92
5/16
47
5/5
Dekalb Peachtree Arpt
88
5/20
47
5/6
Fulton Co Arpt
88
5/20
47
5/5,6
Gainesville
89
5/20
48
5/5
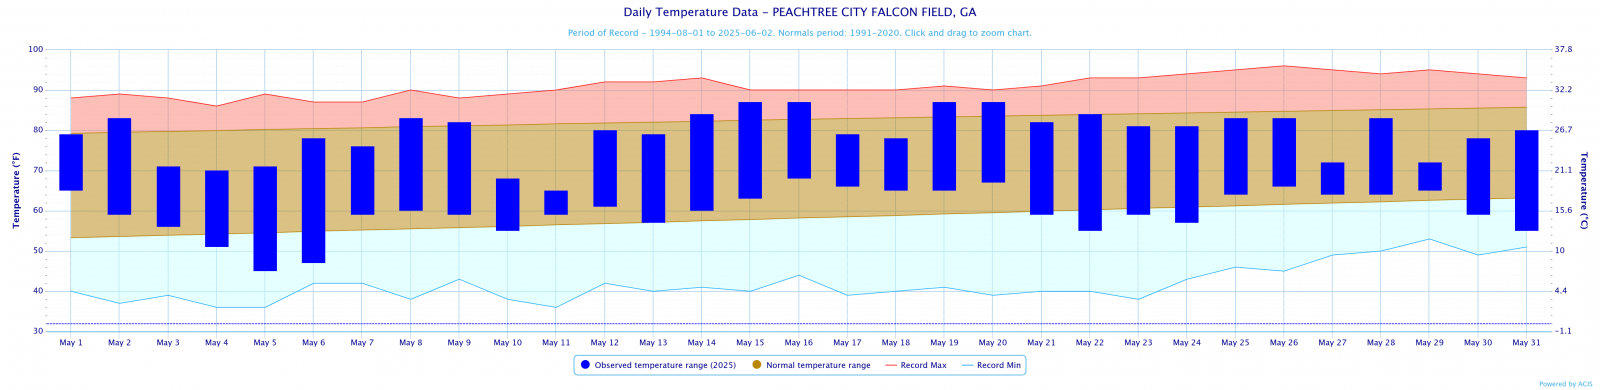
Peachtree City
87
5/19,20
45
5/5
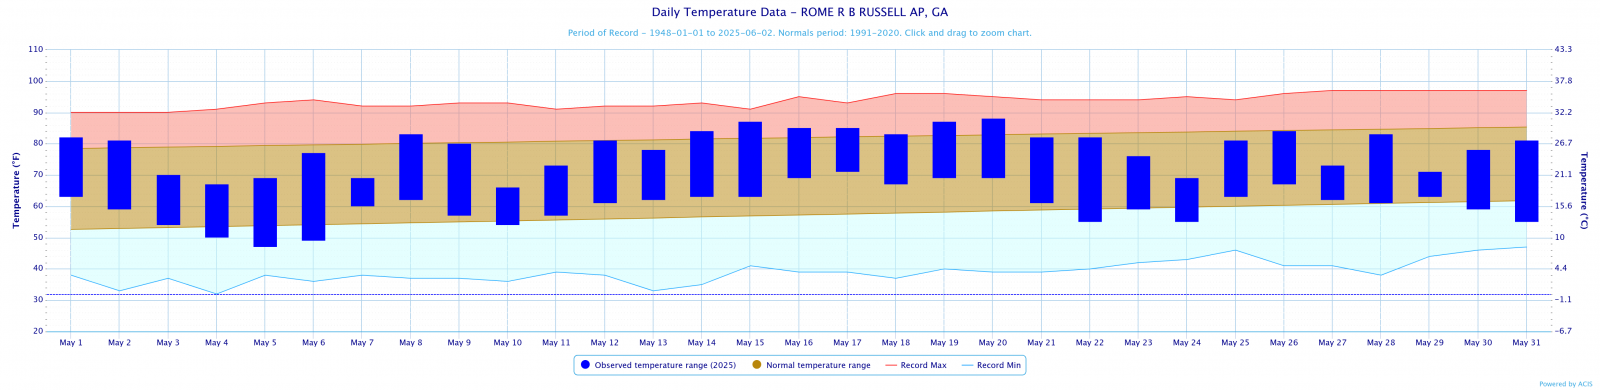
Rome
88
5/20
47
5/5
May 2025 Precipitation Climate Statistics
Average Precipitation
From Normal)
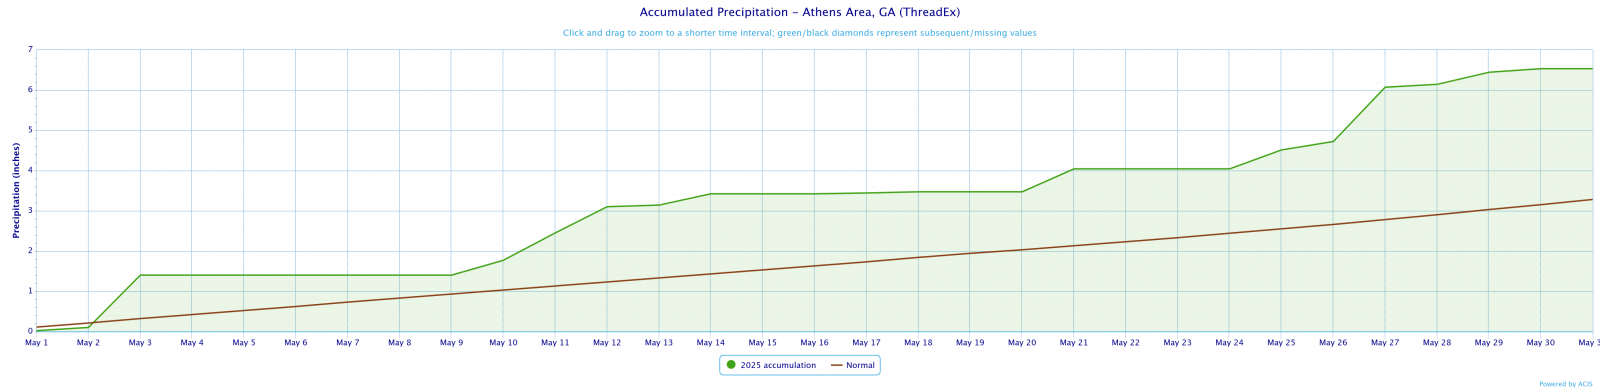
Athens
6.53
3.15
3.38
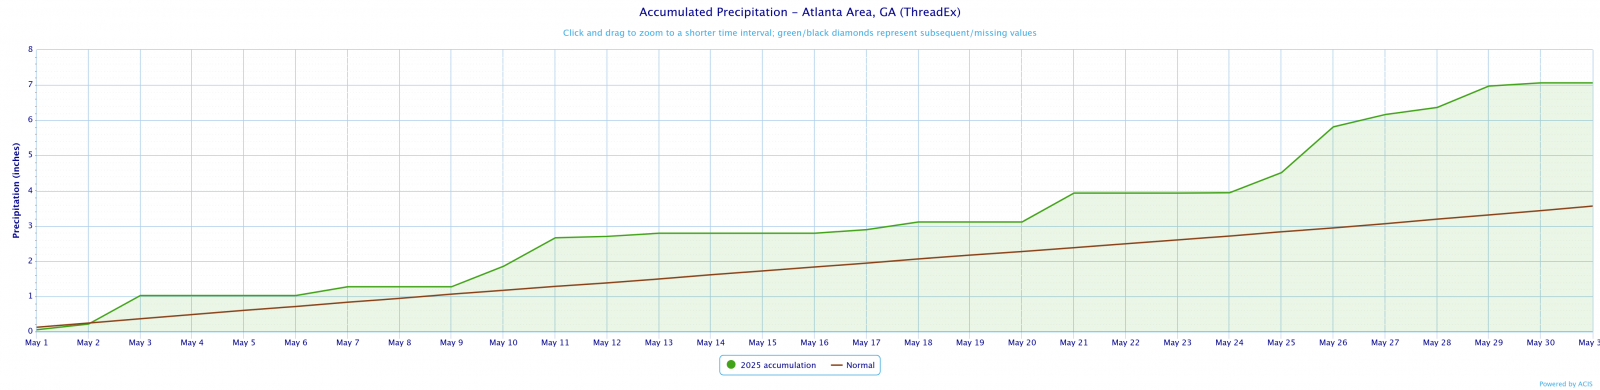
Atlanta
7.06
3.43
3.63
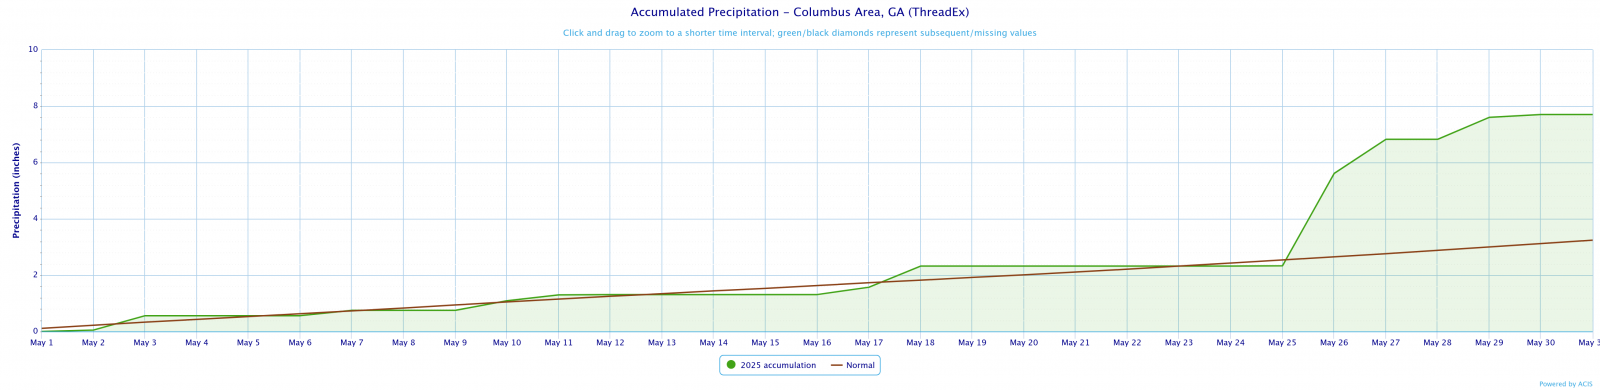
Columbus
7.70
3.12
4.58
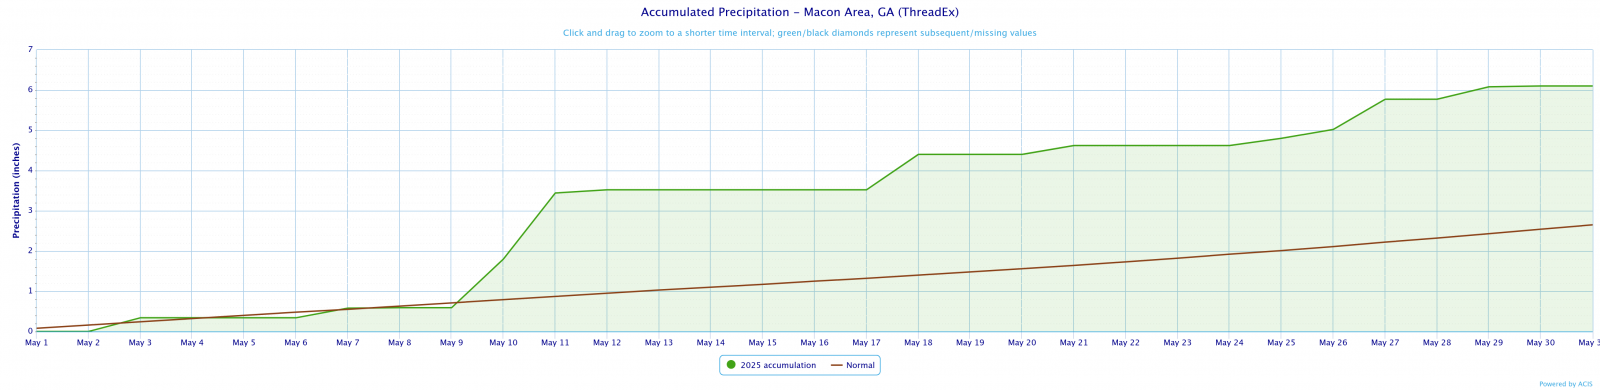
Macon
6.1
2.54
3.56
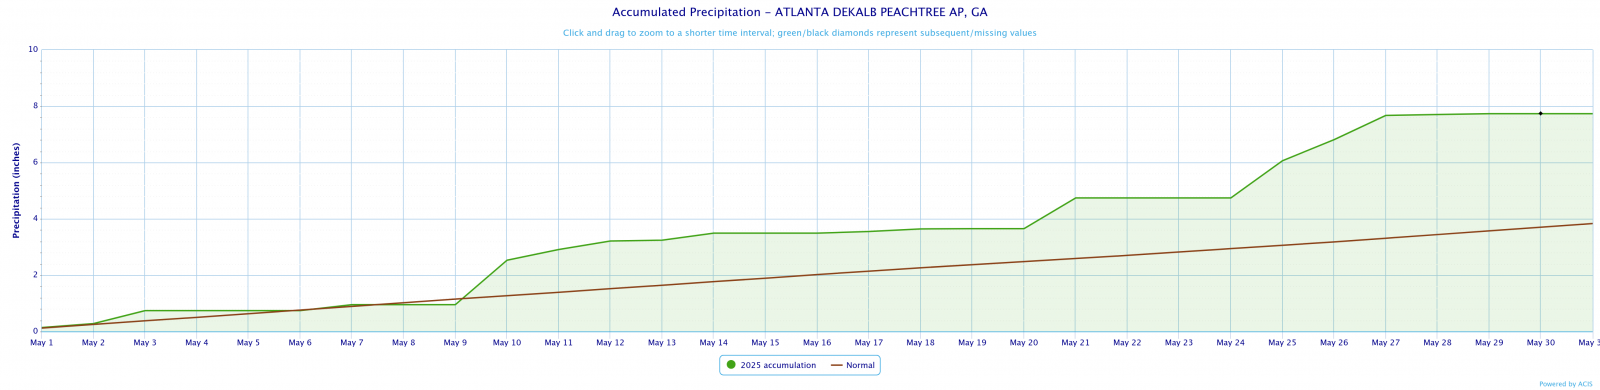
Dekalb Peachtree Arpt
7.73
3.70
4.03
Fulton County Arpt
7.5
3.53
3.97
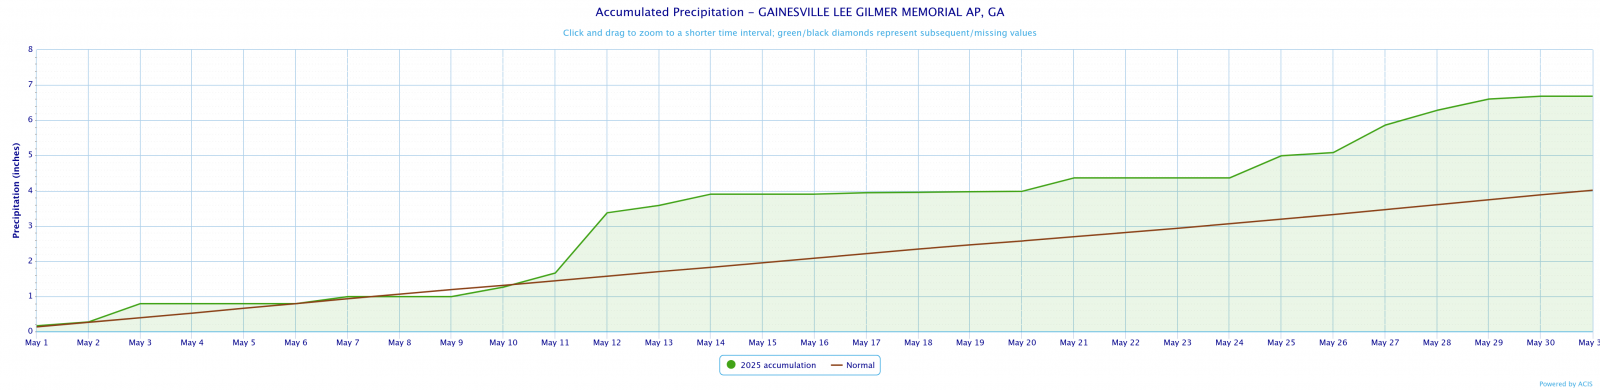
Gainesville
6.68
3.88
2.80
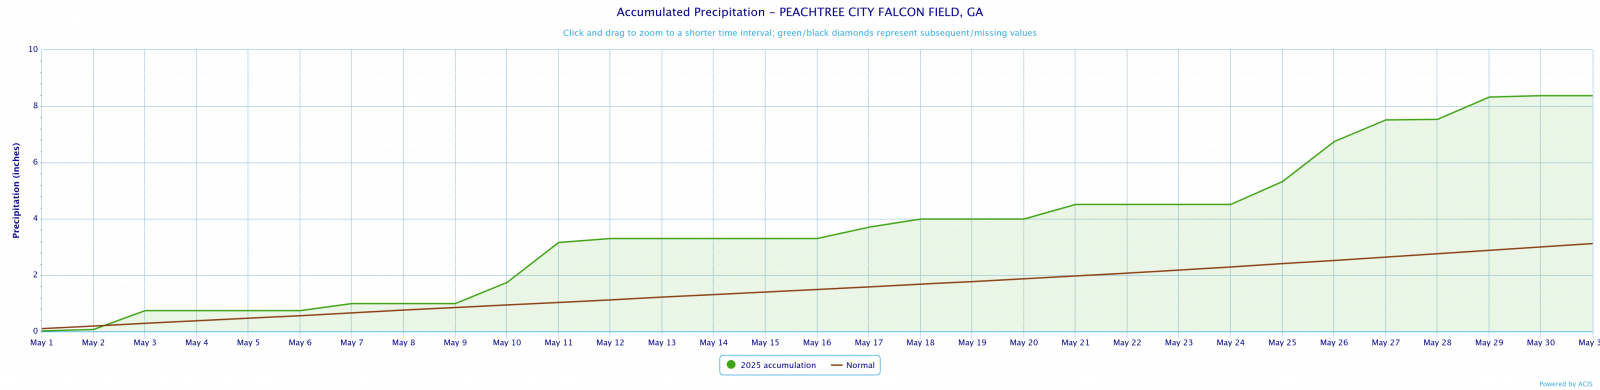
Peachtree City
8.37
3.00
5.37
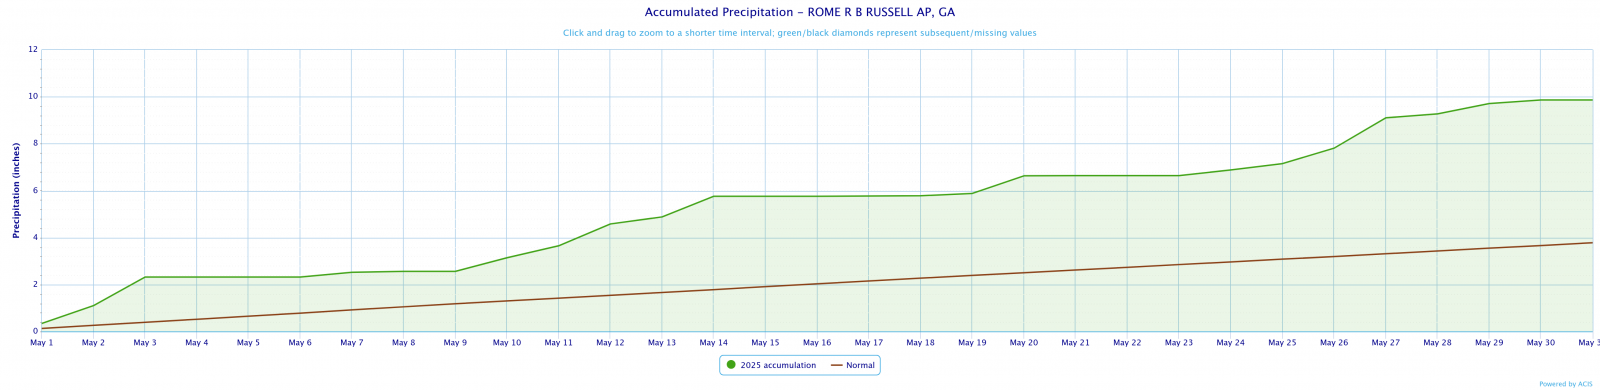
Rome
9.86
3.66
6.20
May 2025 Precipitation Climate Statistics
Athens
1.35
5/27
Atlanta
1.43
5/26
Columbus
3.28
5/26
Macon
1.71
5/10
Dekalb Peachtree Arpt
1.59
5/10
Fulton County Arpt
1.44
5/21
Gainesville
2.02
5/11
Peachtree City
2.09
5/25
Rome
1.74
5/2
Click the links below to explore the temperature and precipitation data across north and central Georgia for the month of May 2025.
Temperature Maps
Precipitation Maps
Temperature Graphs
Precipitation Graphs

Temperature and precipitation records at our 4 main climate sites are located below.
May 2025 Climate Records
No Records were broken during the last month.
Larger events that occurred across north and central Georgia this past January can be found here.
May 3rd, 2025
May 20-21, 2025
May 25 and 27, 2025
May 29th, 2025 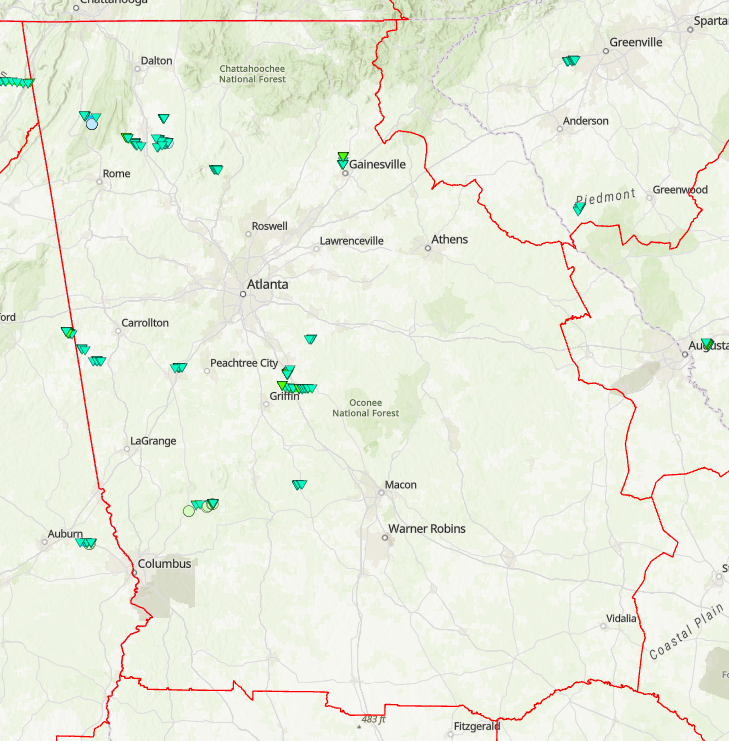
June Outlook