| Previous Month | Next Month |
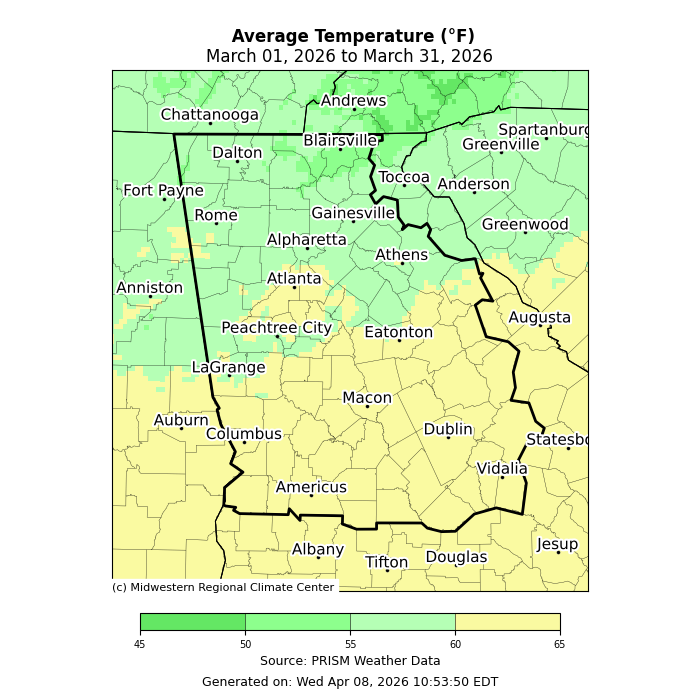
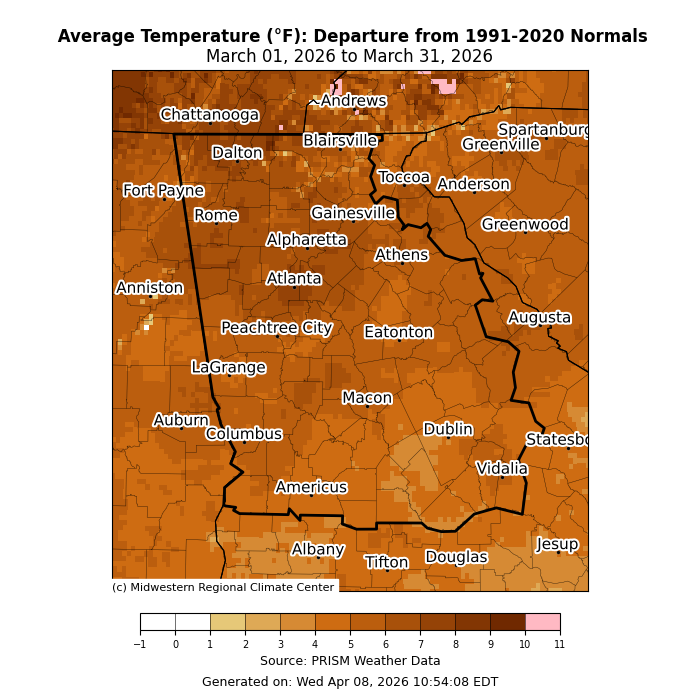
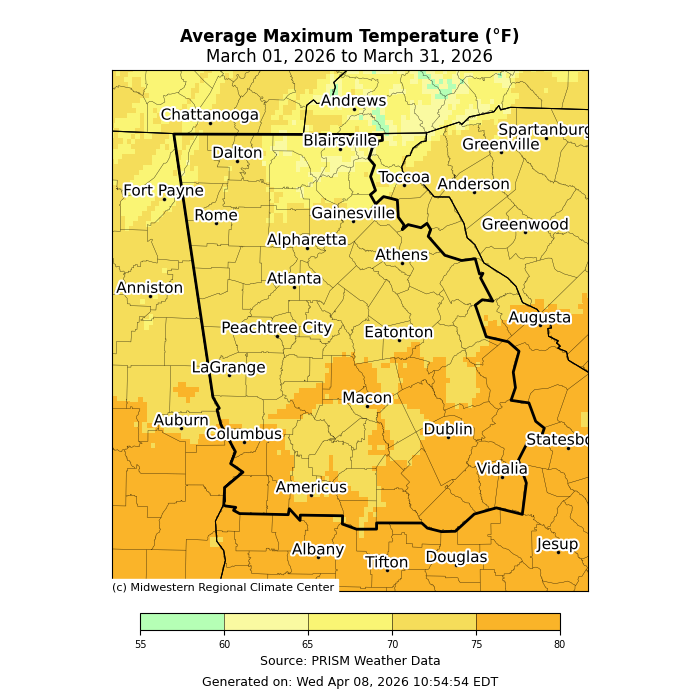
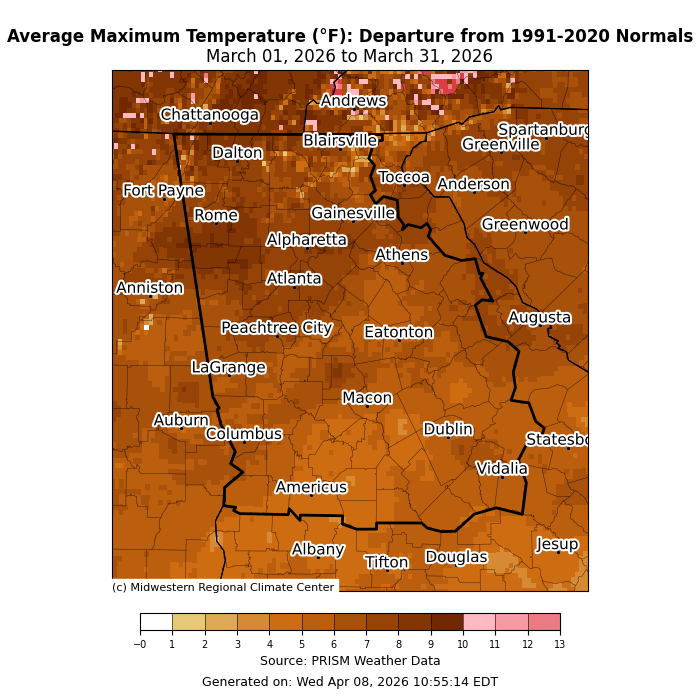
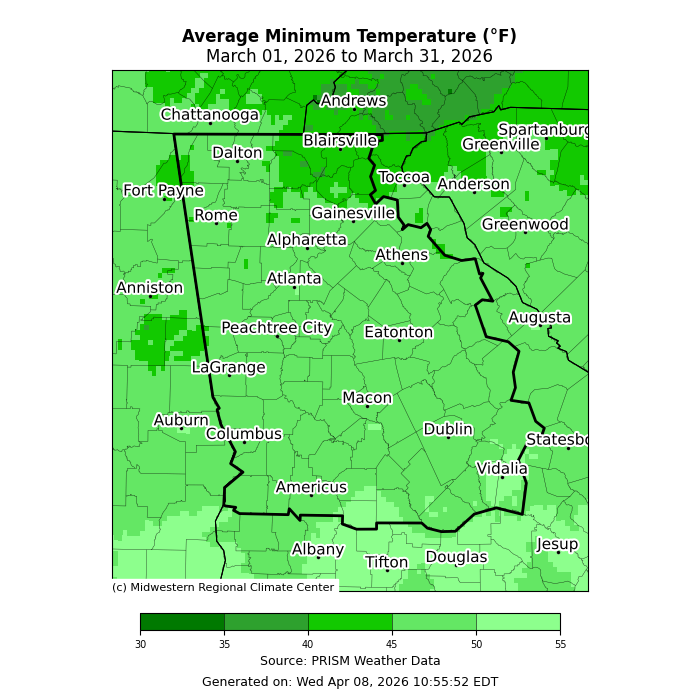
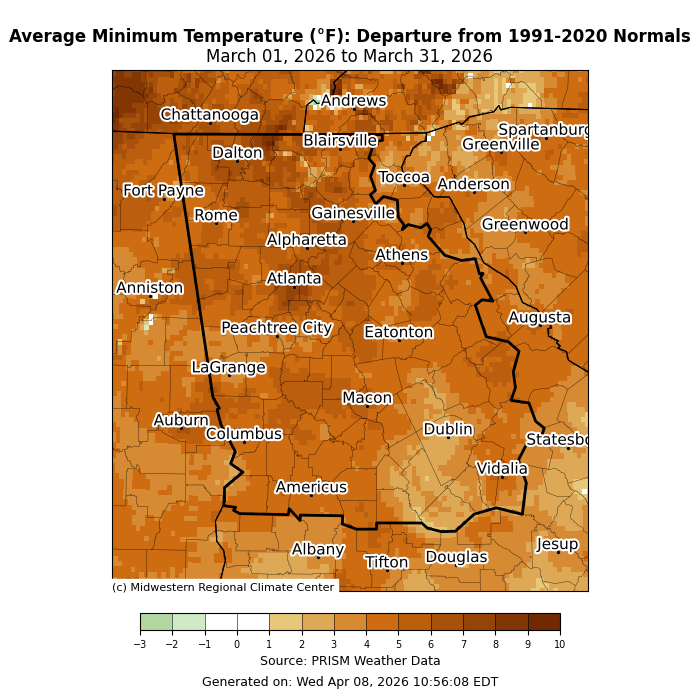
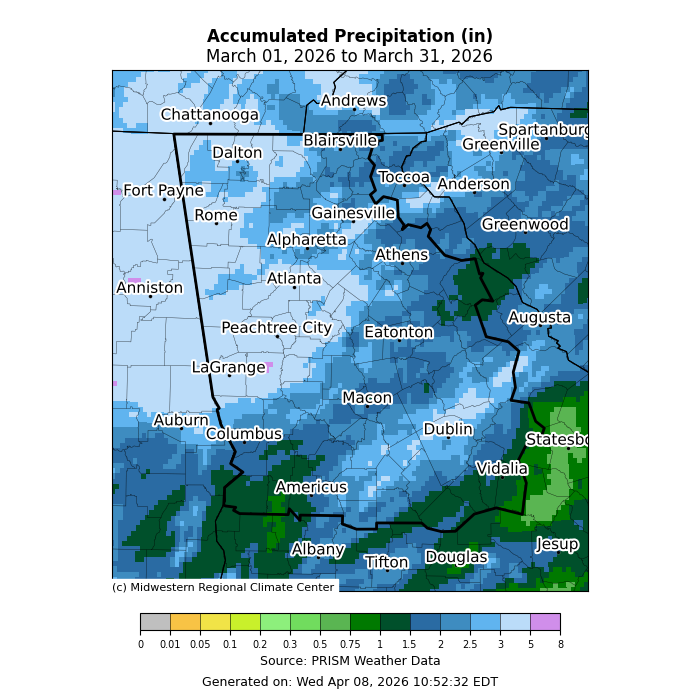
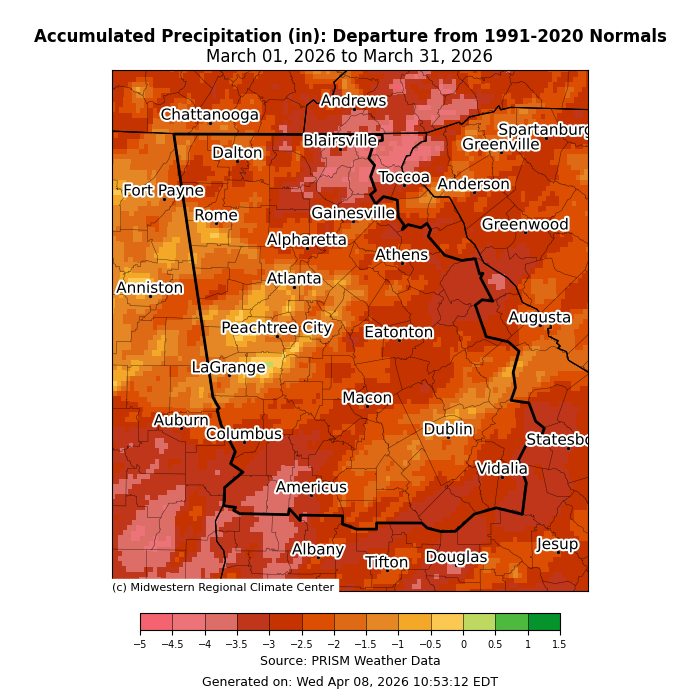
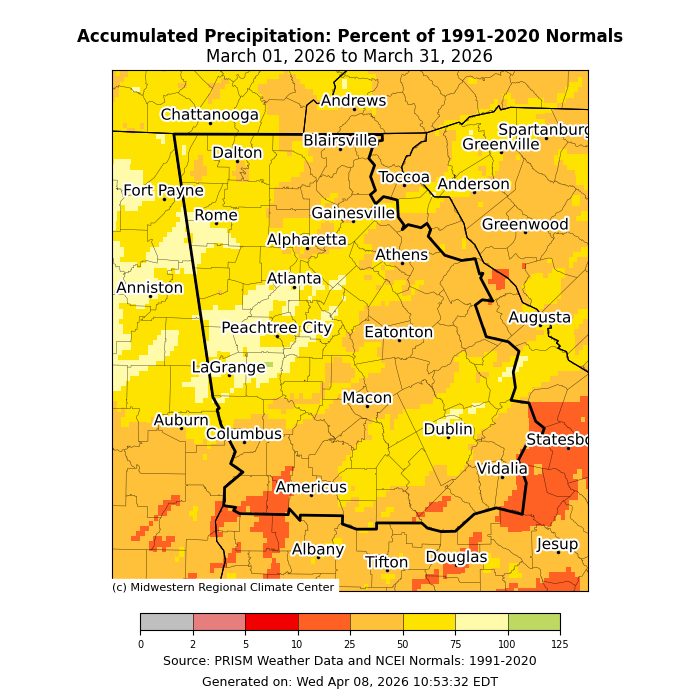
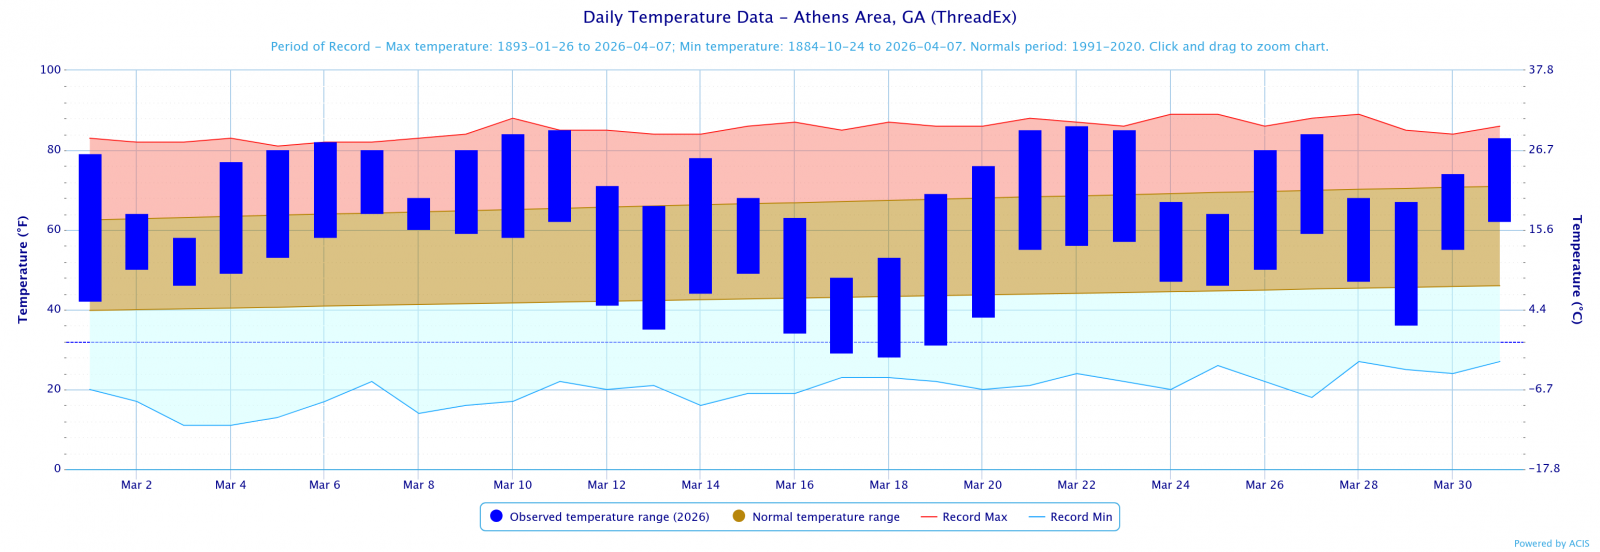
Temperatures through the month of March were 6 to 7 degrees above normal. Precipitation through the month of March were around 1 to 2 inches below normal.
Climate Site Maximum Temperature Max T Date *Indicates a daily record was set Climate Site Total Precipitation DFN (Departure Climate Site Maximum Daily Precip (in inches) Max P Date *Indicates a daily record was set Data prepared by NWS Peachtree City/Atlanta On March 12th and March 16th, a line of thunderstorms pushed into north and central Georgia resulting in tornadoes across central Georgia ranging from EF0-EF2 damage. Check out this storymap to learn more about the event and the individual tornadoes. https://storymaps.arcgis.com/stories/a8f59e9db66c4fe79dd86a06dcee2009 Based on the Climate Prediction Center's outlook for April, All of north and central Georgia has a 50-60% chance of above normal temperatures. Northwest Georgia has an equal chance of above or below normal precipitation while the remainder of Georgia has a 33-40% chance of below normal precipitation. Data prepared by NWS Peachtree City/Atlanta.
Overview
Climate Graphs
Records
Events
April Outlook
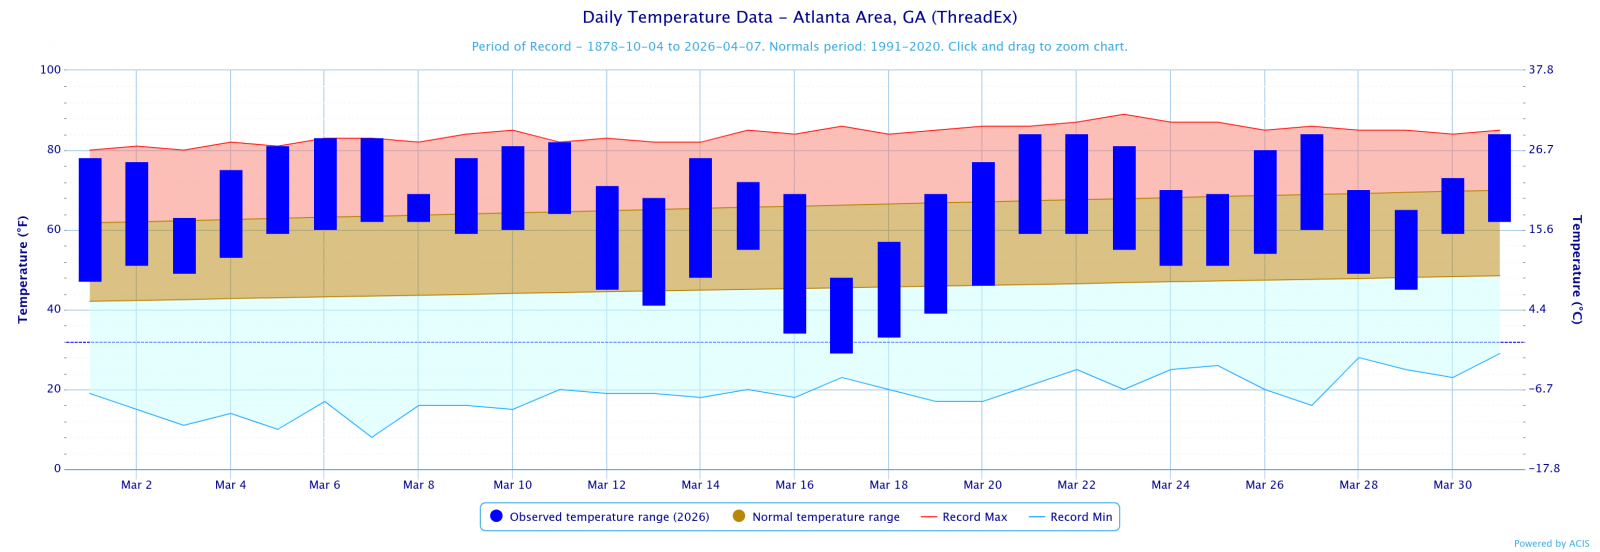
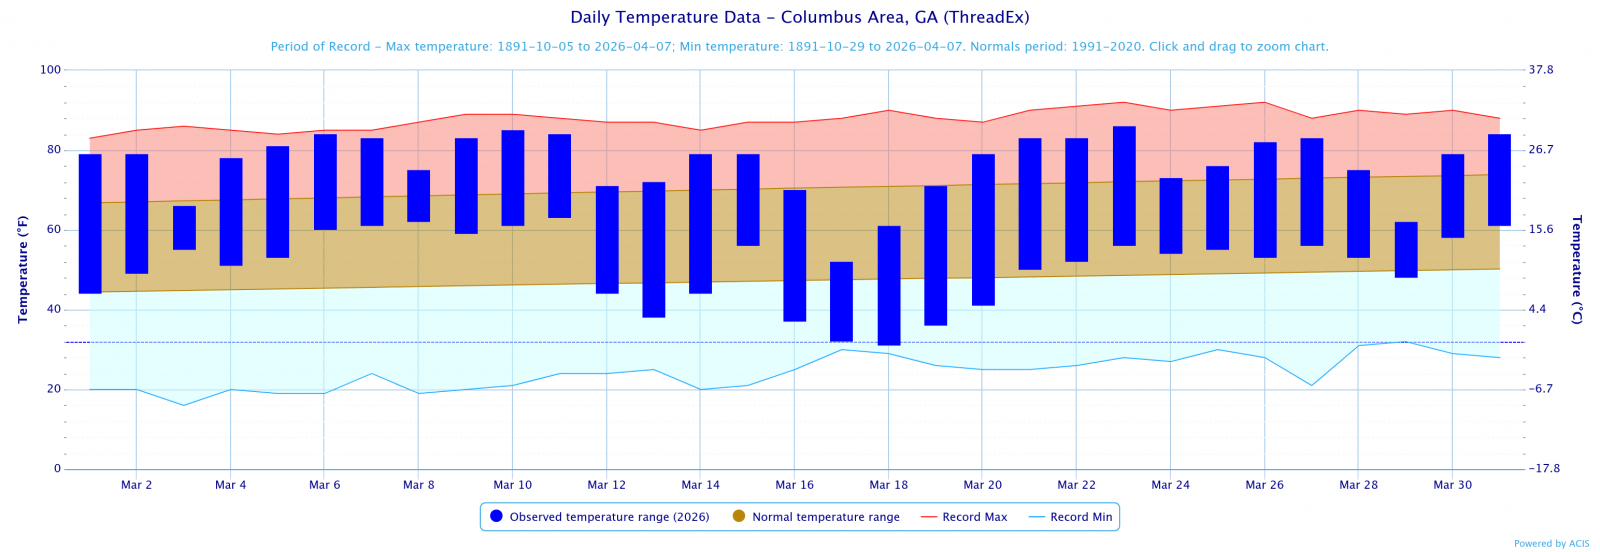
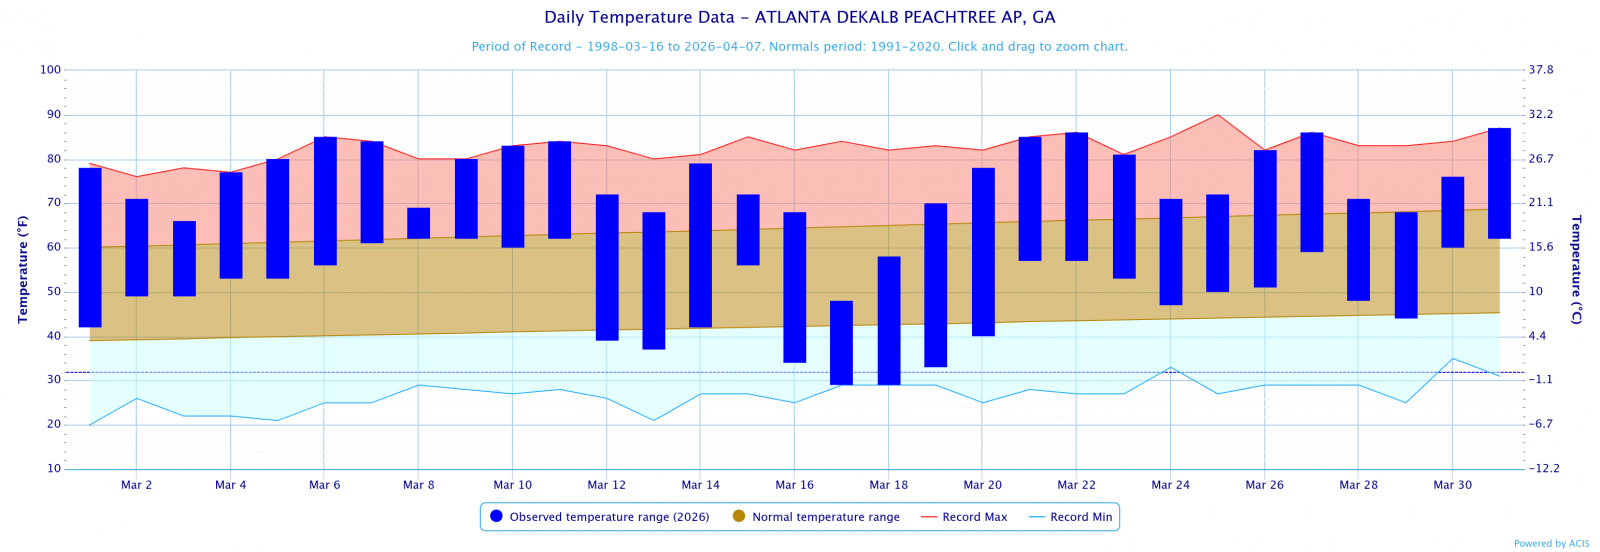
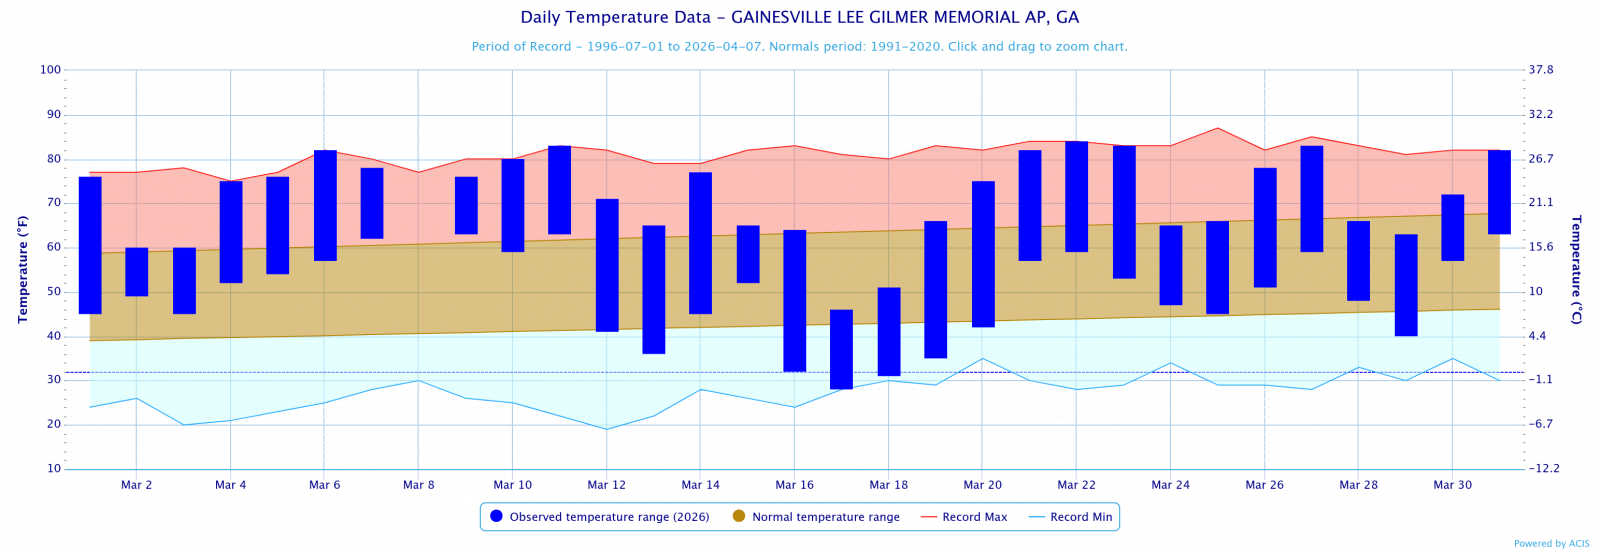
Below are the overview stats for March 2026 for our 9 climate sites.
March 2026 Climate Averages
Climate Site
Month Temp (°F)
Average Temp
Departure from normal
Athens
60.8
54.9
5.9
Atlanta
63
55.6
7.4
Columbus
63.7
58.9
4.8
Macon
61.8
57.7
4.1
Dekalb Peachtree Arpt
62.4
53.3
9.1
Fulton Co Arpt
60.9
54.4
6.5
Gainesville
60.3
52.9
7.4
Peachtree City
60.5
55.3
5.2
Rome
61.1
53.4
7.7
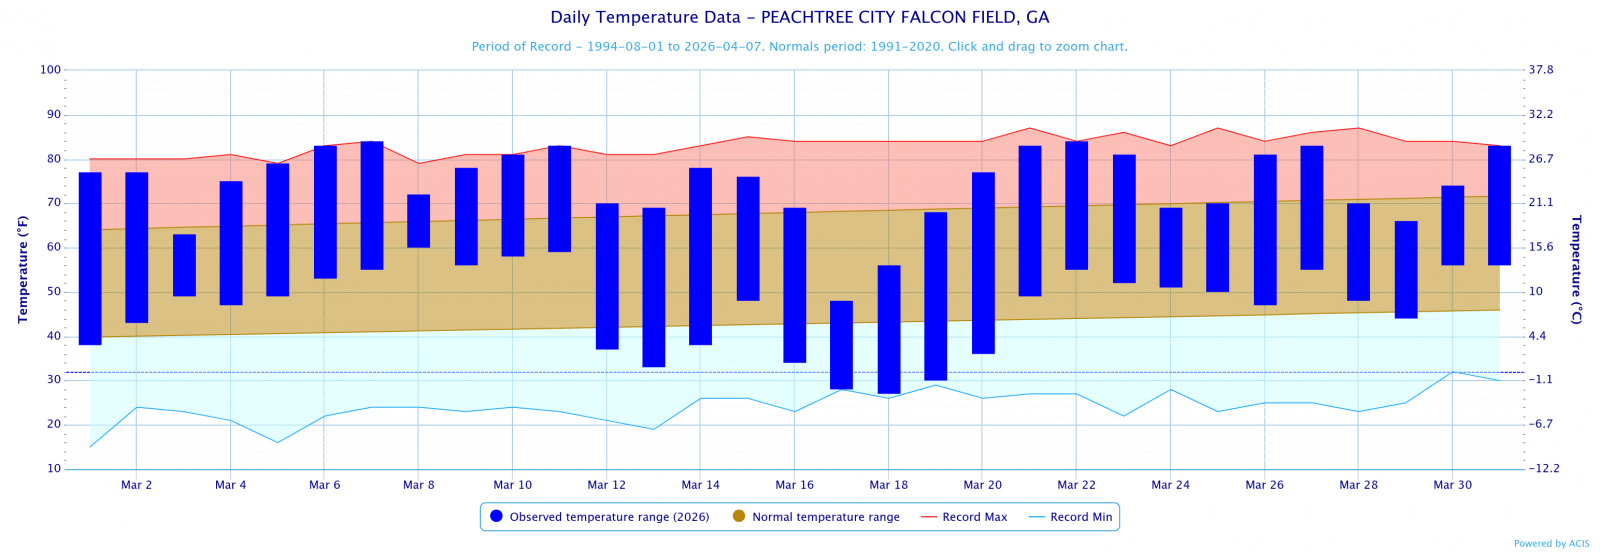
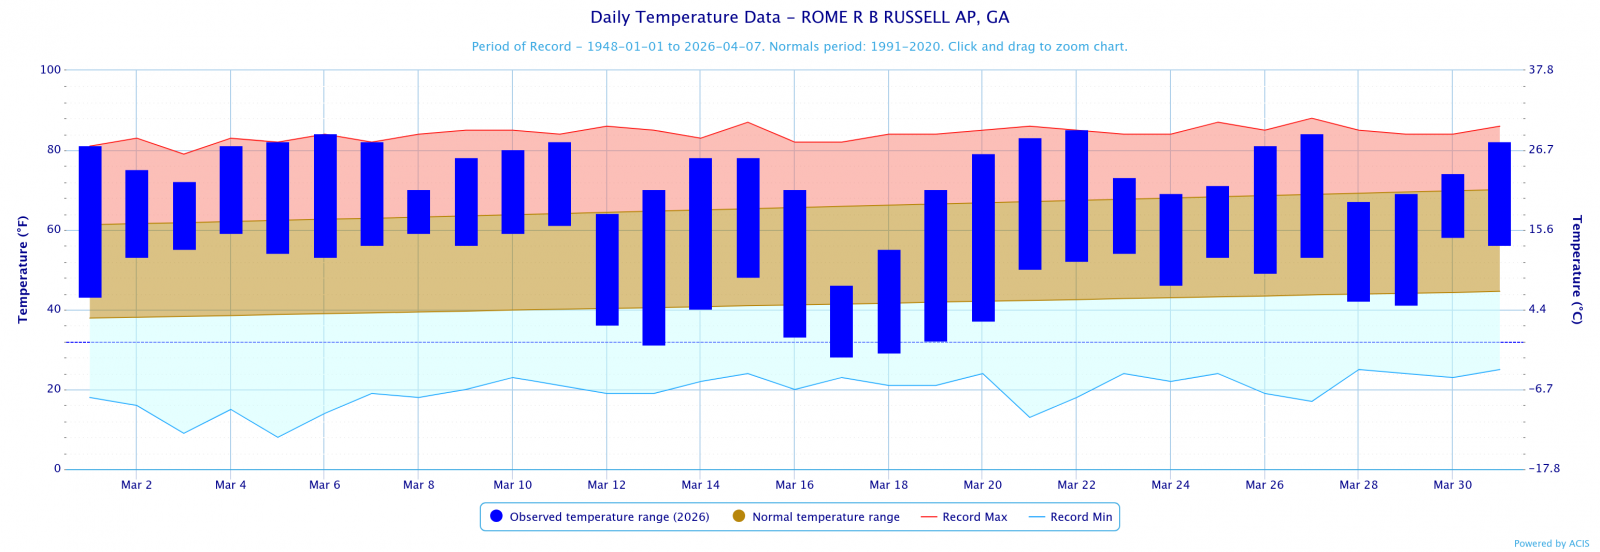
March 2026 Temperature Climate Statistics
Minimum Temperature
Min T Date
Athens
86
3/22
28
3/18
Atlanta
84
3/31,27
29
3/17
Columbus
86
3/23
31
3/18
Macon
88
3/23
26*
3/18
Dekalb Peachtree Arpt
87
3/31
29
3/17,18
Fulton Co Arpt
86
3/22
28
3/17,18
Gainesville
84
3/22
28
3/17
Peachtree City
84
3/7,22
27
3/18
Rome
85
3/22
28
3/17
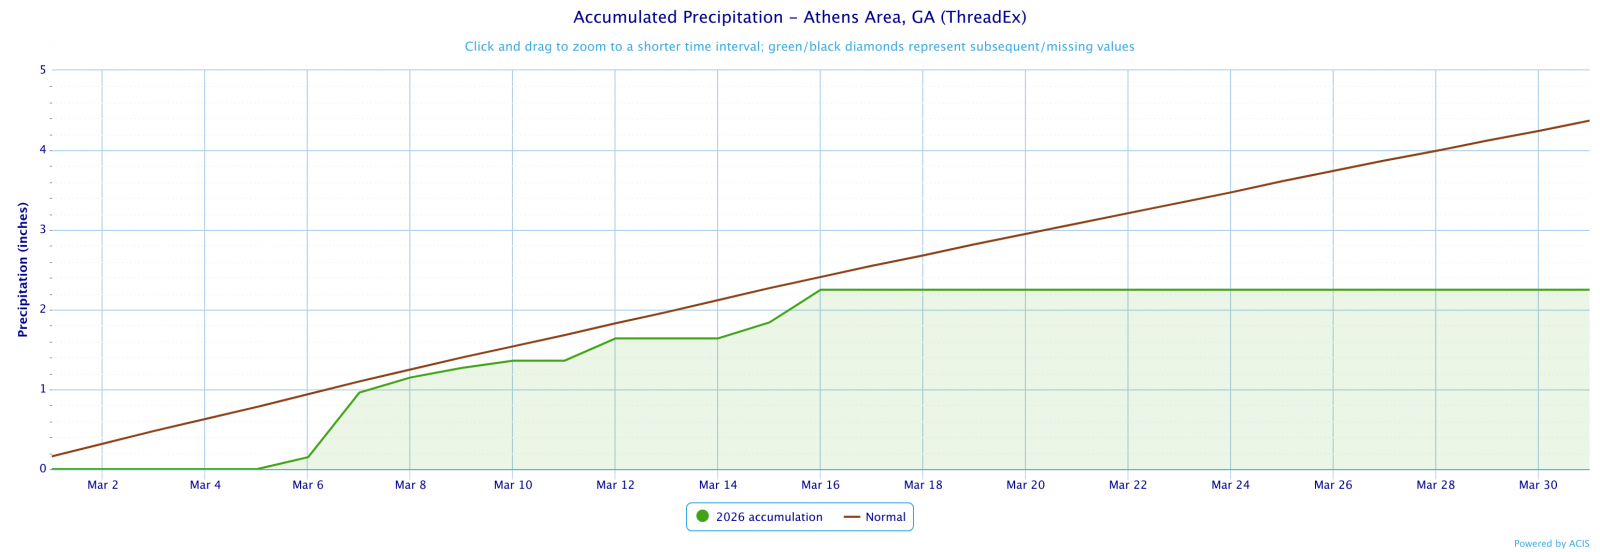
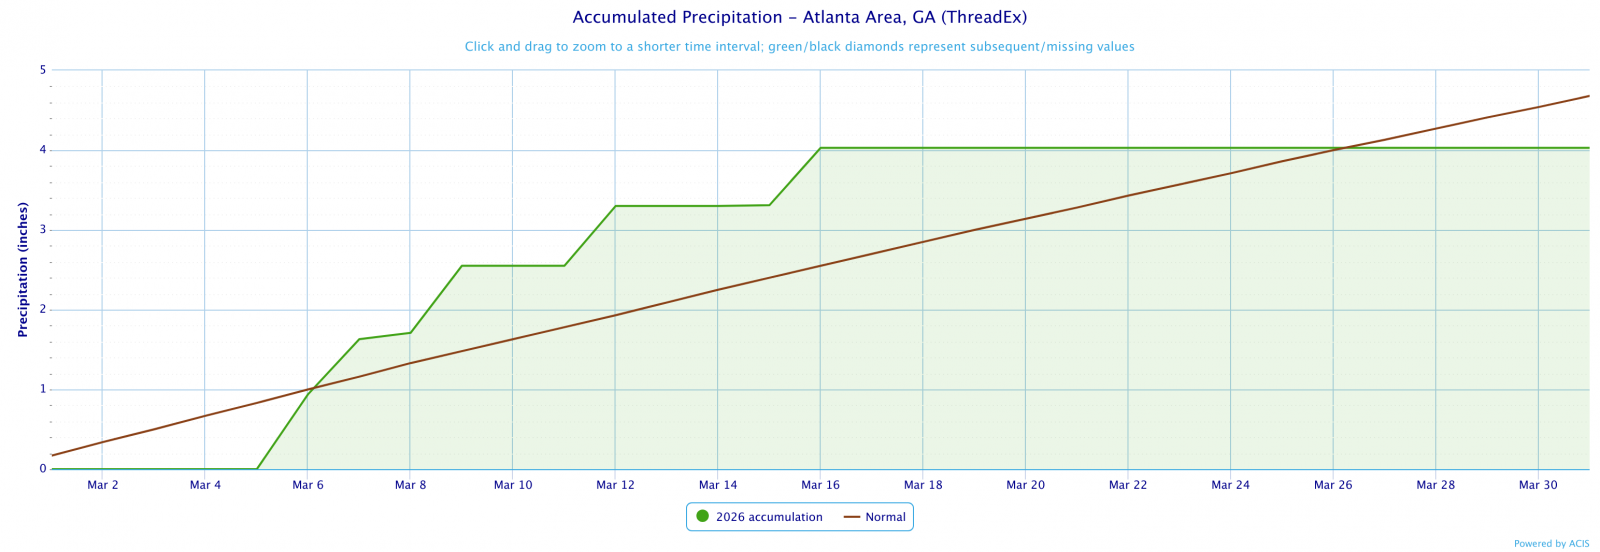
March 2026 Precipitation Climate Statistics
Average Precipitation
From Normal)
Athens
2.25
4.37
-2.12
Atlanta
4.03
4.68
-0.65
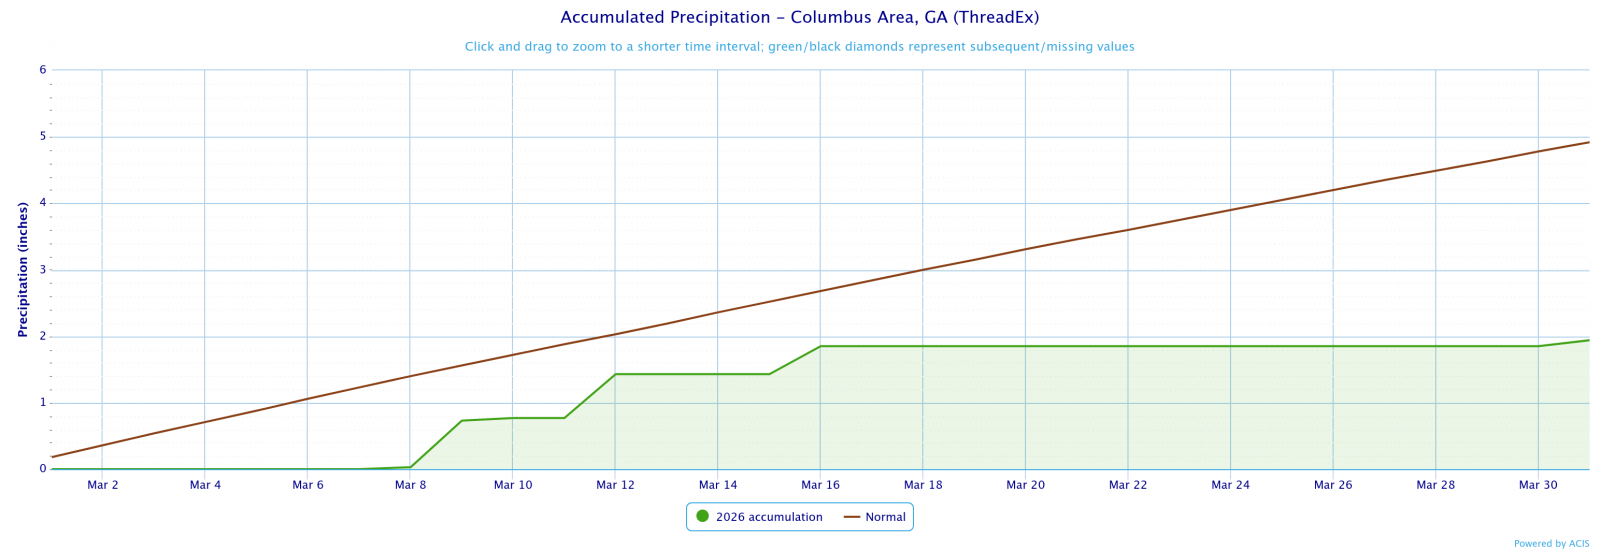
Columbus
1.94
4.92
-2.98
Macon
2.04
4.31
-2.27
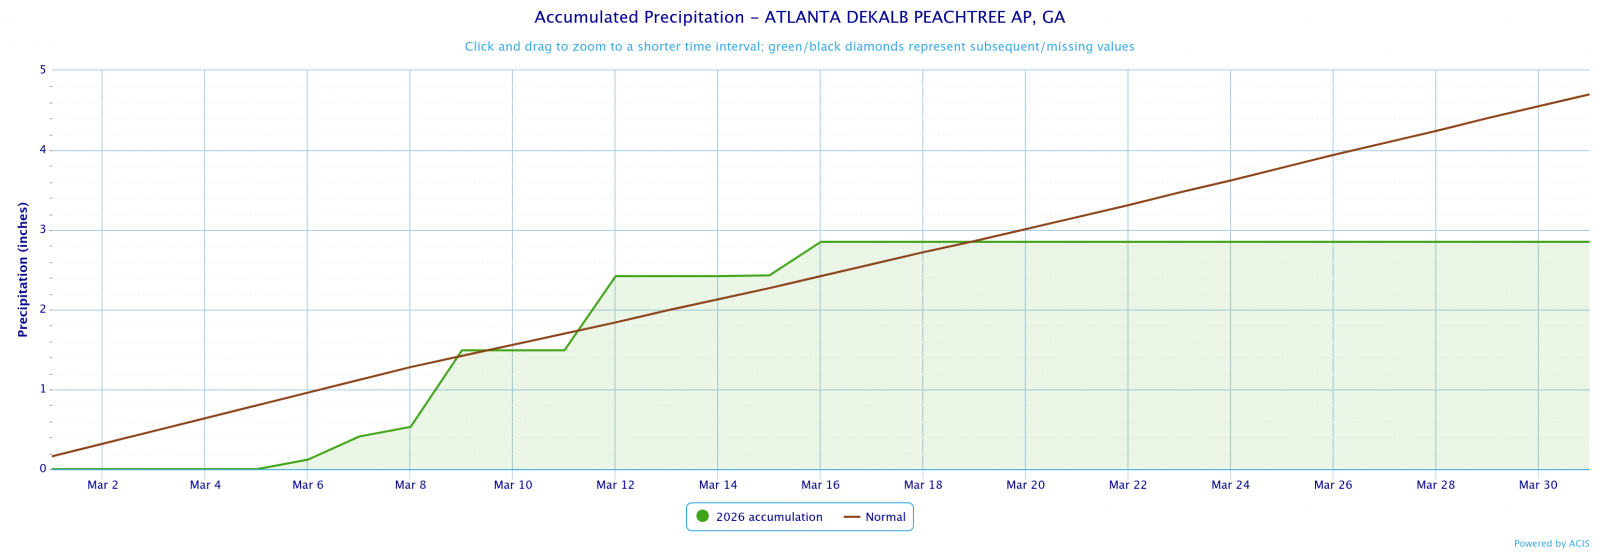
Dekalb Peachtree Arpt
2.85
4.70
-1.85
Fulton County Arpt
4.1
4.53
-0.43
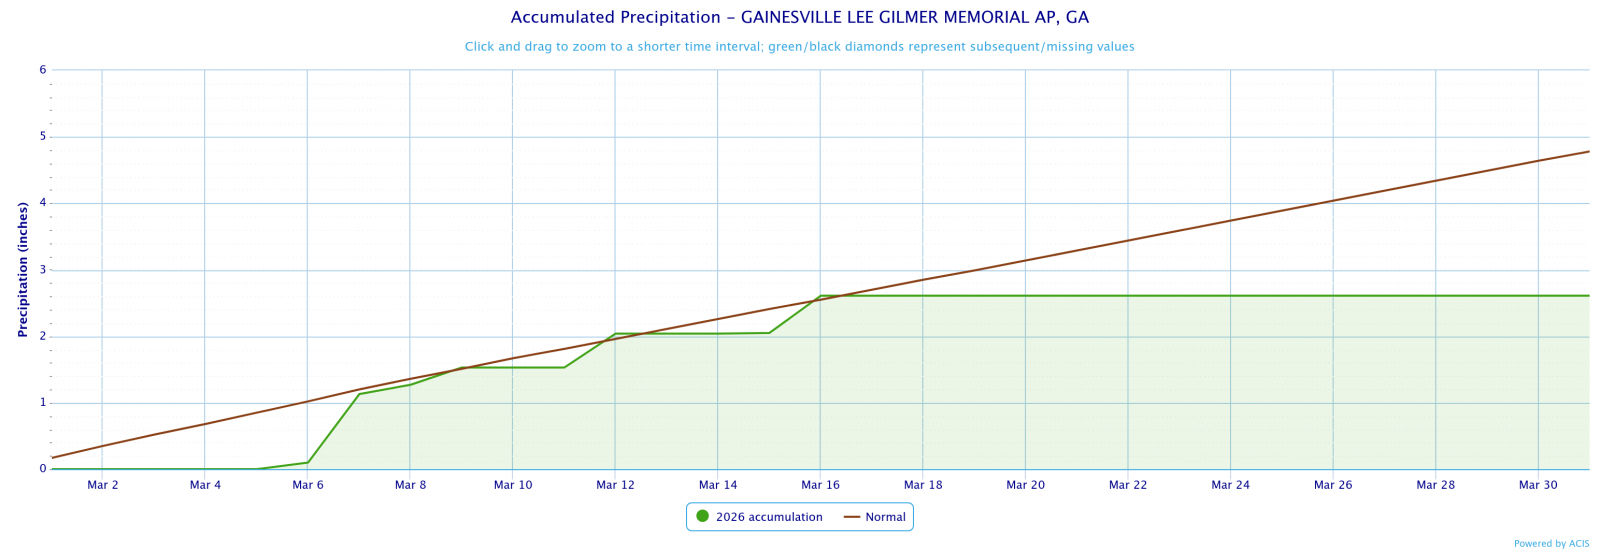
Gainesville
2.61
4.78
-2.17
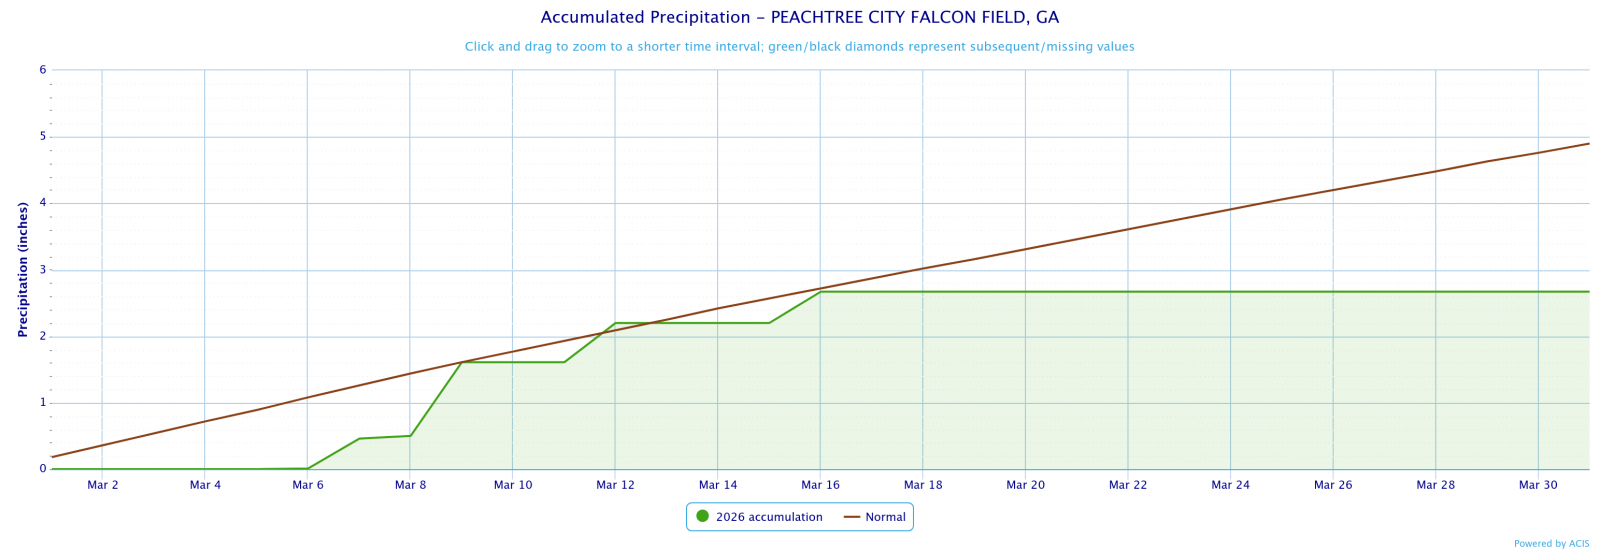
Peachtree City
2.67
4.90
-2.23
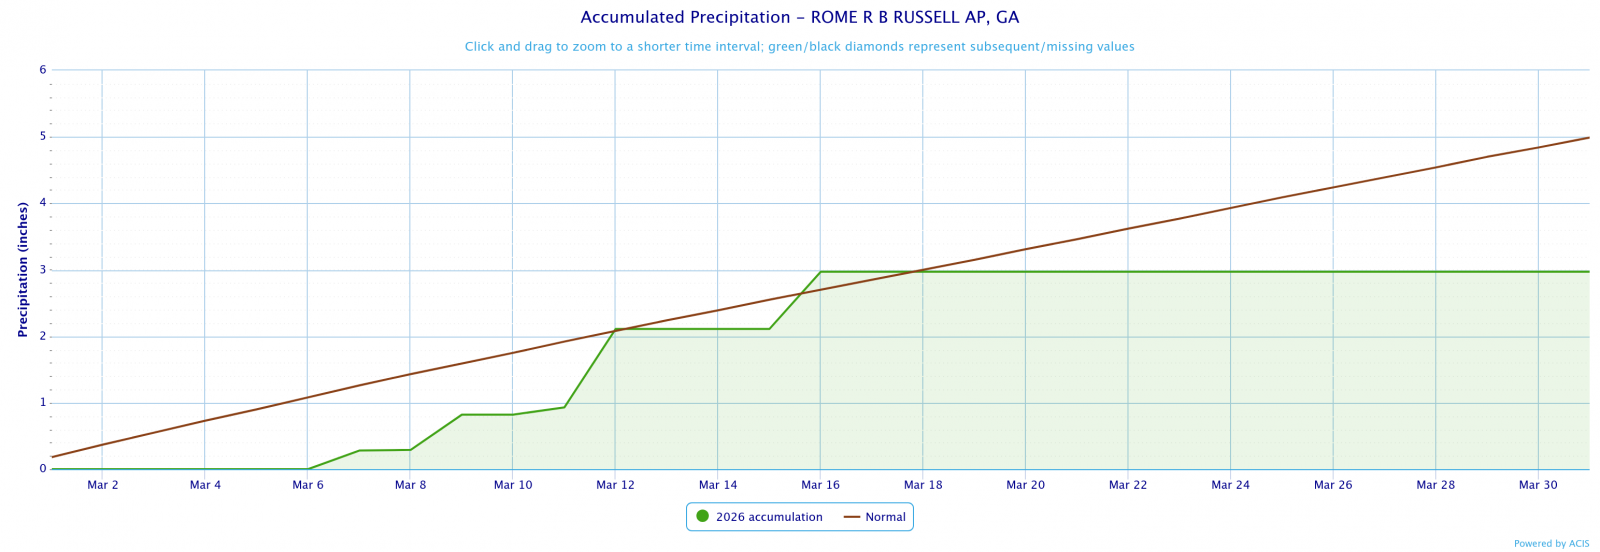
Rome
2.97
4.99
-2.02
March 2026 Precipitation Climate Statistics
Athens
1.00
3/7
Atlanta
0.94
3/6
Columbus
0.74
3/9
Macon
0.61
3/12
Dekalb Peachtree Arpt
0.96
3/9
Fulton County Arpt
1.18
3/9
Gainesville
1.17
3/7
Peachtree City
1.11
3/9
Rome
1.29
3/11
Click the links below to explore the temperature and precipitation data across north and central Georgia for the month of March 2026.
Temperature Maps
Precipitation Maps
Temperature Graphs
Precipitation Graphs


Temperature and precipitation records at our 4 main climate sites are located below.
March 2026 Climate Records
Date
Type
Location
Records set over a 24-hour period
3/18
Min Temp
Macon
Macon fell to 26°F which broke the record of 28°F set in 1941.
3/11
Max Temp
Athens
Athens rose to 85°F which broke the record of 84°F in 1925.
3/6
Max Temp
Atlanta
Atlanta rose to 83°F which broke the record of 80°F in 2022.
3/7
Max Temp
Atlanta
Atlanta rose to 83°F which broke the record of 80°F in 1974.
Larger events that occurred across north and central Georgia this past March can be found here.
The April climate outlook is below.
April Outlook