 |
|||||
Meteorological Data
Radar Images
These regional radar images are courtesy WSI and were printed in the National Disaster Survey Report "The Widespread November 21-23, 1992, Tornado Outbreak: Houston to Raleigh and Gulf Coast to Ohio Valley." Click on a thumbnail below for the full size image.
11:30 pm November 21st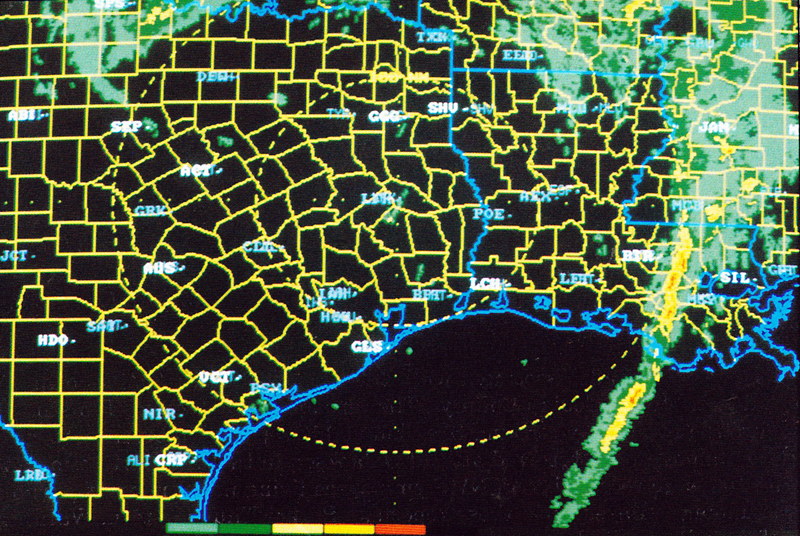 At this time, there were three tornadoes on the ground across our area. One was occurring with the thunderstorm cell over Jefferson Davis County. Another (the "Brandon Tornado") was moving from northeastern Copiah County into northwestern Simpson County. A third was developing in Sharkey County. |
Midnight November 22nd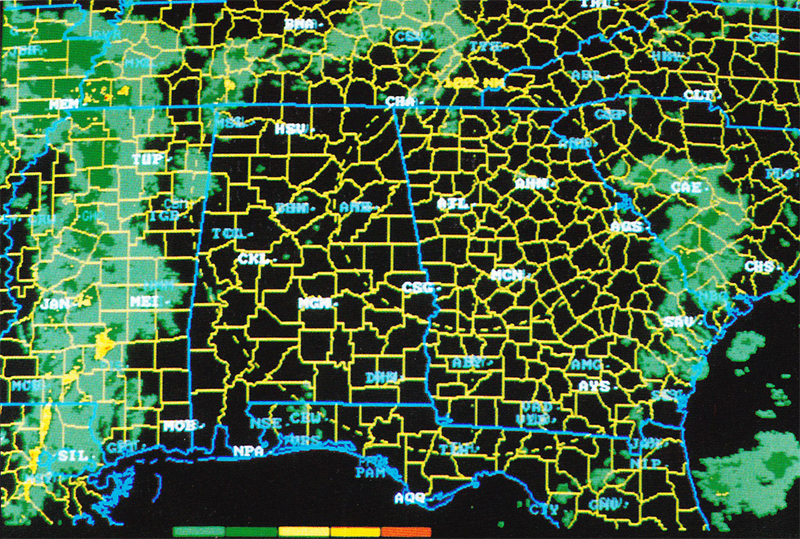 At this time, there were two long-track tornadoes still on the ground. An F4 tornado was moving through the Brandon area, and an F3 tornado was approaching Mount Olive. |
The images below are radar summary messages, which provide a general idea of the precipitation that was occurring across the region.
10:35 pm November 21st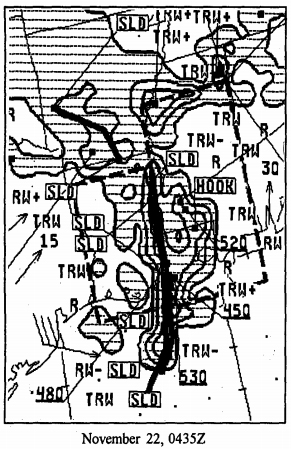 |
11:35 pm November 21st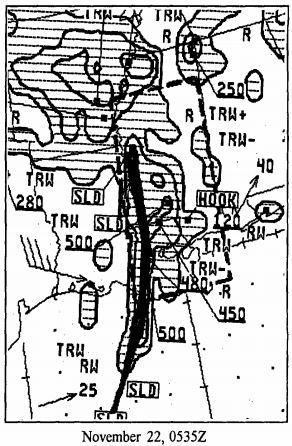 |
12:35 am November 22nd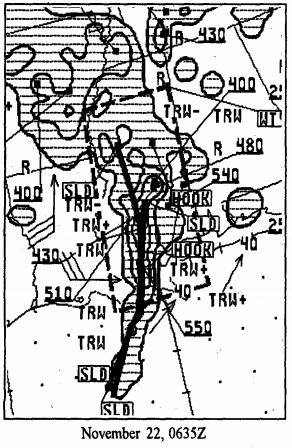 |
Satellite Images
The images below are infrared satellite images from the evening of November 21st. Click on a thumbnail below for the full size image.
9 pm November 21st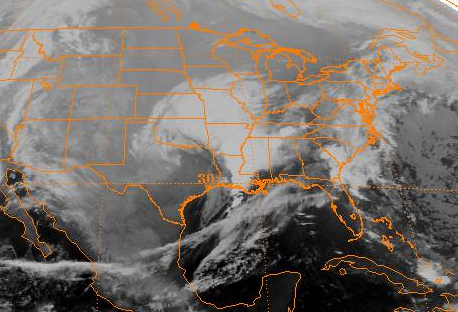 |
Midnight November 22nd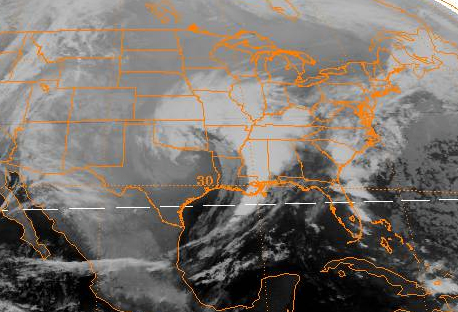 |
Upper Air Sounding Data
The Skew-T plots below were taken from 00Z November 22nd weather balloon releases..
Jackson (KJAN) Modified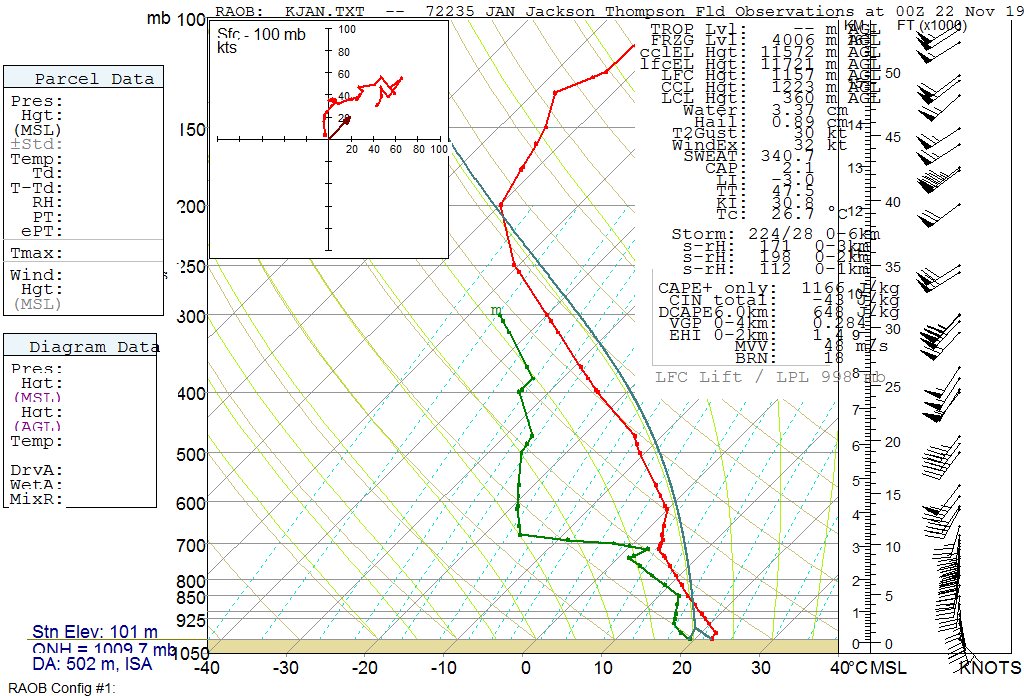 This is data from the 00z KJAN balloon release, modified with surface observations from the time shortly before thunderstorms moved across the Jackson area that evening. The modified sounding indicated surface CAPE over 1,100 J/kg and modest shear. |
Lake Charles (KLCH)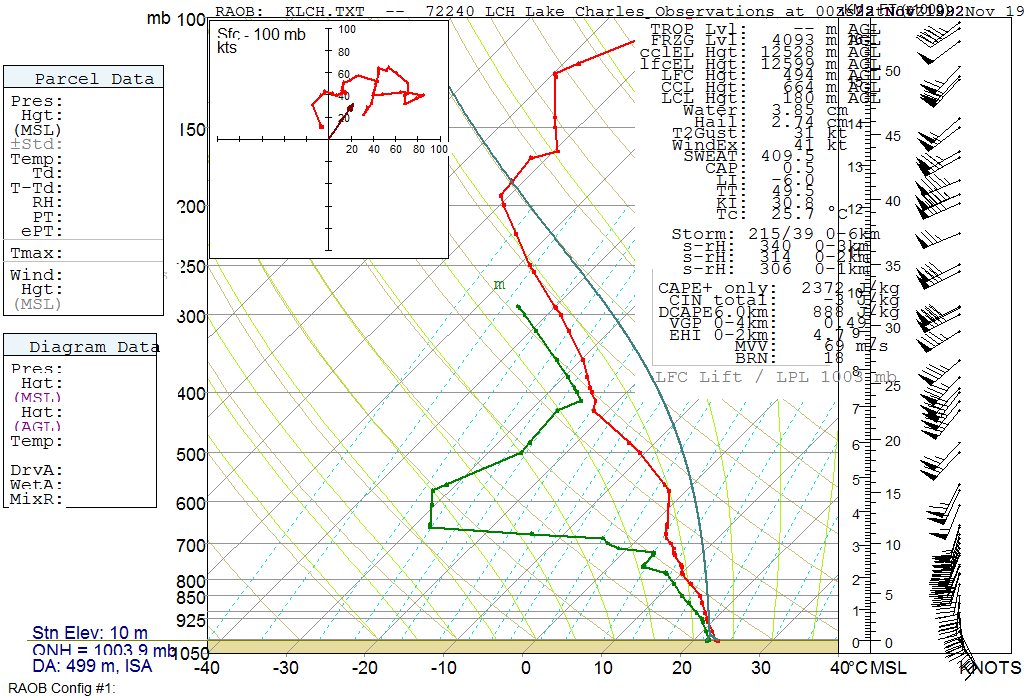 This is unmodified data from the 00z KLCH balloon release. Because Lake Charles was just ahead of the line of thunderstorms around the time of this release, this may actually provide a more realistic perspective of the atmosphere as the thunderstorms moved across northeast Louisiana and central Mississippi that night. In this sounding, instability is rather strong for November, and wind shear is also quite impressive. |
Upper Air Charts
The images below are morning 500mb charts from the Daily Weather Maps. Here we can see a very sharp upper level trough and closed low swinging across the southern Plains states, becoming negatively-tilted as it approaches the Lower Mississippi River Valley.
November 21st |
November 22nd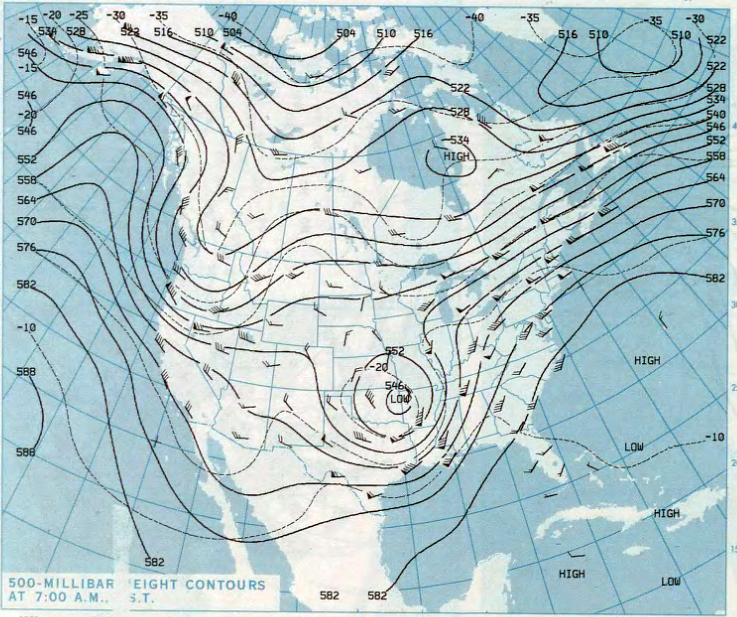 |

