Wind and Pressure Reports
Sources: National Weather Service Post Storm Reports
National Centers for Environmental Information (NECI)
Monthly Weather Review - 1988 Atlantic Hurricane Season
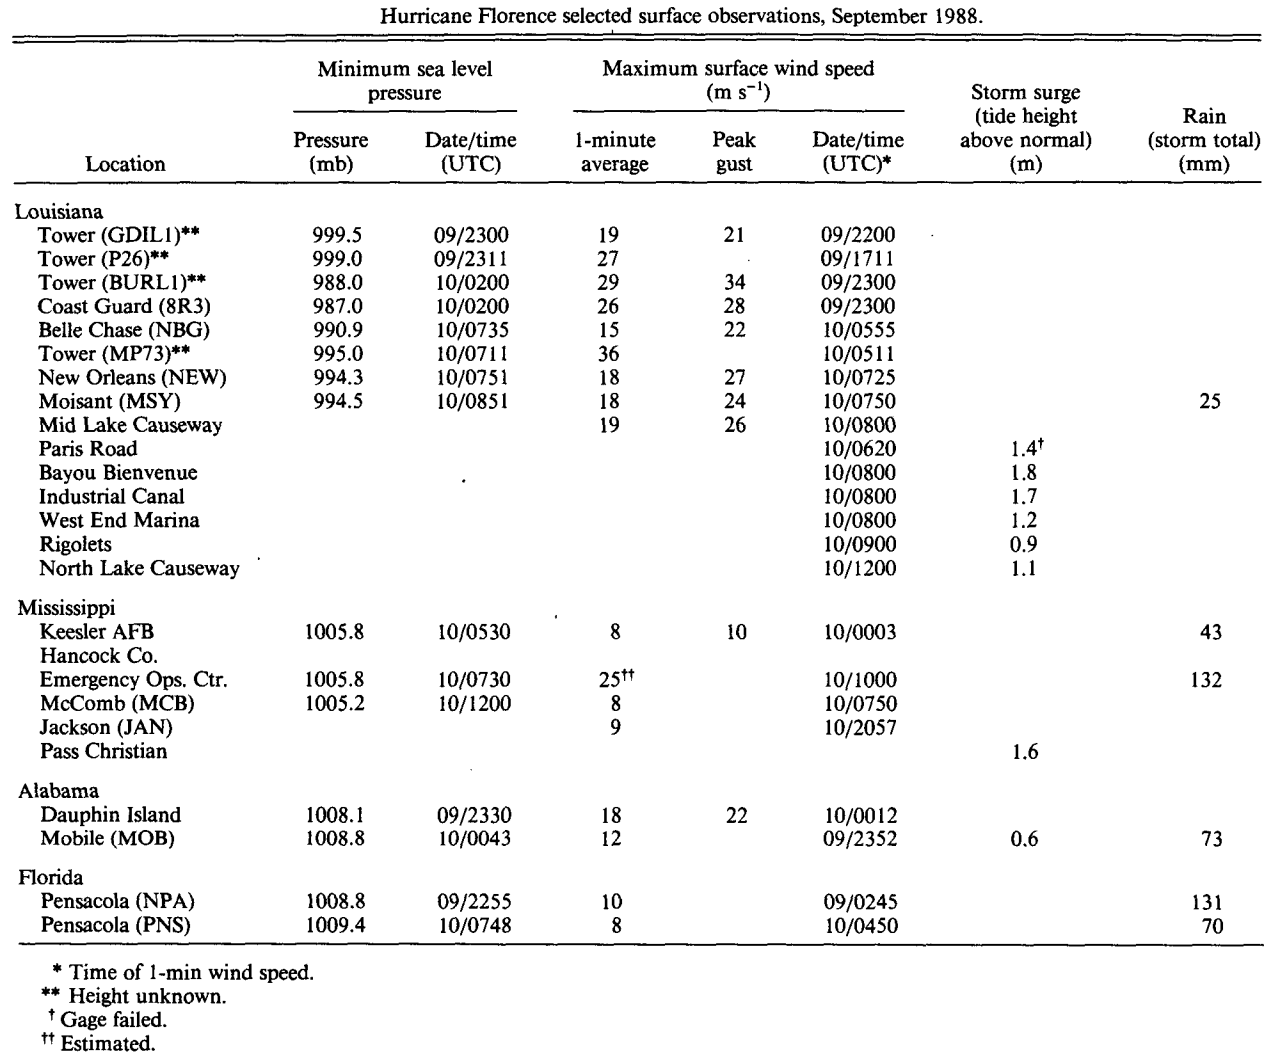
Monthly Weather Review Meteorological Data of Hurricane Florence (Note: All data in metric system) |
| Location |
Minimal Sea Level Pressure |
Maximum Sustained Wind (1 Min. Avg.) |
Peak Wind Gust |
Port Arthur, TX
(KBPT-NWS) |
1008.8 mb (29.79")
9/10 @ 5:00 PM CDT |
16 mph (14 knots)
9/09 @ 12:00 PM CDT |
23 mph (20 knots)
9/09 @ 11:00 AM CDT |
Lake Charles, LA
(KLCH-NWS) |
1009.5 mb (29.81")
9/10 @ 4:40 PM CDT |
18 mph (15 knots)
9/09 @ 4:49 PM CDT |
23 mph (20 knots)
9/09 @ 3:48 PM CDT |
Lafayette, LA
(KLFT-WBAN) |
1007.1 mb (29.74")
9/10 @ 5:00 AM CDT |
20 mph (17 knots)
9/09 @ 1:00 PM CDT |
25 mph (22 knots)
9/09 @ 12:00 PM CDT |
Alexandria (Esler), LA
(KESF-WBAN) |
1007.1 mb (29.70")
9/10 @ 4:00 PM CDT |
23 mph (20 knots)
9/10 @ 12:35 PM CDT |
29 mph (25 knots)
9/10 @ 12:35 PM CDT |
Fort Polk, LA
(KPOE-Army Base) |
1008.1 mb (29.77")
9/10 @ 4:00 PM CDT |
14 mph (12 knots)
9/10 @ 11:00 AM CDT |
17 mph (15 knots)
9/10 @ 6:16 PM CDT |
Baton Rouge, LA
(KBTR-NWS) |
1000.7 mb (29.55")
9/10 @ 8:00 AM CDT |
24 mph (21 knots)
9/10 @ 7:00 AM CDT |
37 mph (32 knots)
9/10 @ 7:00 AM CDT |
Grand Isle, LA
(GDIL1-NDBC) |
999.5 mb (29.52")
9/09 @ 6:00 PM CDT |
43 mph (37 knots)
9/09 @ 5:00 PM CDT |
47 mph (41 knots)
9/09 @ 5:00 PM CDT |
Grand Isle, LA
(KP26-WBAN) |
999.0 mb (29.52")
9/09 @ 6:11 PM CDT |
61 mph (53 knots)
9/09 @ 12:11 PM CDT |
|
Burrwood, LA
(BURL1-NDBC) |
988.0 mb (29.18")
9/09 @ 9:00 PM CDT |
64 mph (56 knots)
9/09 @ 6:00 PM CDT |
76 mph (66 knots)
9/09 @ 6:00 PM CDT |
Southwest Pass, LA
(K8R3-USCG) |
987.0 mb (29.15")
9/09 @ 9:00 PM CDT |
58 mph (50 knots)
9/09 @ 6:00 PM CDT |
64 mph (56 knots)
9/09 @ 6:00 PM CDT |
New Orleans, LA
International
(KMSY-WBAN) |
994.5 mb (29.37")
9/10 @ 3:51 AM CDT |
39 mph (34 knots)
9/10 @ 2:50 AM CDT |
53 mph (46 knots)
9/10 @ 2:04 AM CDT |
New Orleans, LA
Lakefront
(KNEW-WBAN) |
994.3 mb (29.36")
9/10 @ 2:51 AM CDT |
40 mph (35 knots)
9/10 @ 2:25 AM CDT |
61 mph (53 knots)
9/10 @ 2:14 AM CDT |
Belle Chase NAS, LA
(KNBG-WBAN) |
990.9 mb (29.26")
9/10 @ 2:55 AM CDT |
33 mph (29 knots)
9/10 @ 1:28 AM CDT |
49 mph (43 knots)
9/10 @ 1:28 AM CDT |
Biloxi Keesler AFB, MS
(KBIX-WBAN) |
1005.8 mb (29.70")
9/10 @ 12:30 AM CDT |
17 mph (15 knots)
9/09 @ 7:03 PM CDT |
31 mph (27 knots)
9/09 @ 7:03 PM CDT |
McComb, MS
(KMCB-WBAN) |
1005.2 mb (29.68")
9/10 @ 7:00 AM CDT |
17 mph (15 knots)
9/10 @ 2:50 AM CDT |
|
Jackson, MS
(KJAN-NWS) |
1010.2 mb (29.83")
9/10 @ 4:00 AM CDT |
17 mph (18 knots)
9/10 @ 3:57 PM CDT |
|
Mobile, AL
(KMOB-NWS) |
1008.8 mb (29.83")
9/10 @ 7:43 PM CDT |
26 mph (23 knots)
9/09 @ 6:52 PM CDT |
36 mph (31 knots)
9/09 @ 3:51 AM CDT |
| Dauphin Island, AL |
1008.1 mb (29.77")
9/10 @ 6:30 PM CDT |
40 mph (35 knots)
9/09 @ 7:12 PM CDT |
48 mph (42 knots)
9/09 @ 7:12 PM CDT |
Pensacola, FL
(KPNS-NWS) |
1009.4 mb (29.81")
9/10 @ 2:48 PM CDT |
18 mph (16 knots)
9/09 @ 11:50 PM CDT |
|
Pensacola NAS, FL
(KNPA-WBAN) |
1008.8 mb (29.79")
9/09 @ 5:55 PM CDT |
23 mph (20 knots)
9/09 @ 9:45 PM CDT |
|
Selected Oil Rig Reports
(Anemometer heights listed if available) |
| Location |
Minimal Sea Level Pressure |
Maximum Sustained Wind (1 Min. Avg.) |
Peak Wind Gust |
MP73
(29.3°N, 88.9°W) |
995.0 mb (29.38")
9/10 @ 12:11 AM CDT |
81 mph (70 knots)
9/10 @ 12:11 AM CDT |
|
(E) = Estimated
(I) = Incomplete |


