|
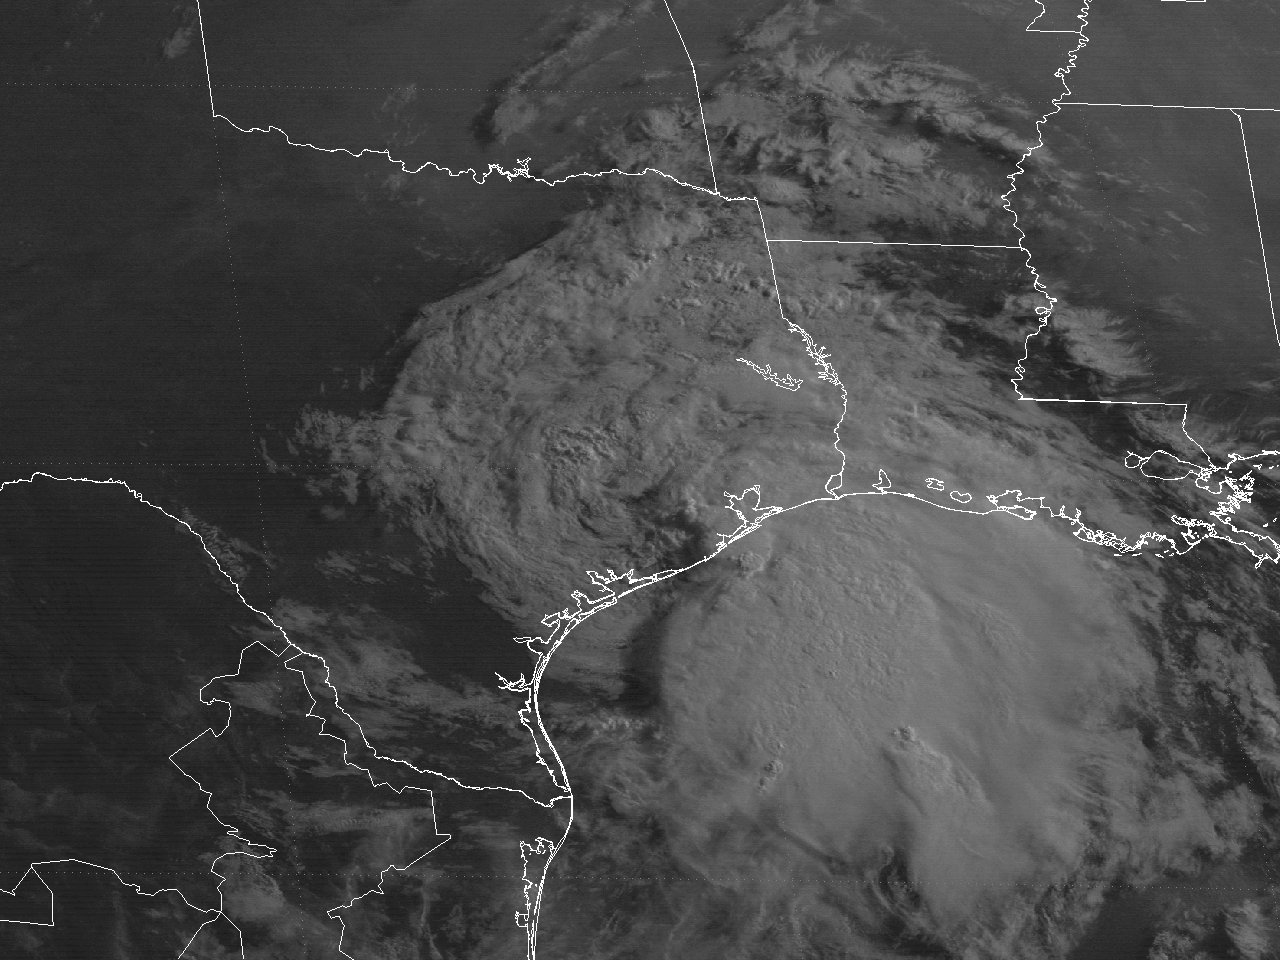
Above: GOES-7 visible satellite image of Tropical Storm Allison at landfall along the Texas coast at 8:01 AM CDT June 26, 1989.
Tropical Storm Allison had a complicated origin. According to National Hurricane Center Hurricane Specialist Bob Case, the formation of Tropical Storm Allison can be attributed to at least three meteorological phenomena: the remnant of East Pacific Hurricane Cosme, the northern portion of a westward moving tropical wave and a strong anticyclone at 200-millibars over the Gulf.
On June 22nd, a deep mid to upper longwave trough over the Western U.S. and Mexico, along with a building mid to upper level ridge over the Eastern U.S. and Gulf, allowed East Pacific Hurricane Cosme to move rapidly northward across Eastern Mexico. The surface circulation eventually dissipated just south of Brownsville by daybreak on June 23rd. However, most of the remnant moisture emerged over the Western Gulf and merged with the approaching tropical wave from the Caribbean Sea. The combined tropical disturbance organized a new surface circulation just off the Upper Mexican coast, and by the early afternoon hours of June 24th, was designated Tropical Depression #2 located about 90 miles east of the South Texas Coast.
Under the influence of the mid to upper ridge of high pressure over the Southeastern U.S. and Gulf, the tropical depression drifted northward the next couple of days, slowly becoming better organized. By daybreak on June 26th, Air Force Reconnaissance aircraft detected a large area of 45 to 50 mph winds at flight level, and the depression was upgraded to Tropical Storm Allison at 7 AM CDT. The post seasonal analysis indicated that the depression likely attained tropical storm status at 7 PM June 25th, which is indicated in the storm archive. Tropical Storm Allison made landfall on the East end of Matagorda Bay, TX at 8 AM CDT June 26th with maximum sustained winds of 45 mph (40 knots) and a minimum central pressure of 1002 millibars (29.59 inches). A GOES-7 visible satellite image at 8:01 AM CDT June 26th shows Tropical Storm Allison at landfall along the Texas coast. Despite moving further inland, Tropical Storm Allison intensified a little further with maximum sustained winds of 50 mph (45 knots) and a minimum central pressure of 999 millibars (29.50 inches) over Sugarland near the western side of the Houston Metropolitan area.
Tropical Storm Allison began to slowly weaken that evening into the early morning hours of June 27th, now moving slowly northeast across Southeast Texas. Tropical Storm Allison weakened back to a tropical depression by daybreak and an extratropical storm by sunset on June 27th.
From June 27th through the 30th, the mid to upper level pattern was dominated by two stagnate ridges of high pressure over the Western and Eastern U.S. with Allison basically trapped between these two cells of high pressure. This caused Allison to slow down significantly by the evening of June 27th near Jasper, Texas and make a slow clockwise loop back over the Houston Metropolitan area by the evening of June 29th into the morning hours of June 30th. An approaching mid to upper level shortwave trough was finally enough to lift Allison’s weakening circulation to the northeast across East Texas for the remainder of June 30th and across Northwest Louisiana and Southern Arkansas on July 1st. The remnant broad circulation of Allison continued to move northeast eventually stalling again over Southern Illinois and Indiana by July 3rd. The broad circulation began to move southward once again by July 4th and 5th over Tennessee, Alabama, Mississippi and turned west over Northern Louisiana on July 6th before finally dissipating over the ArkLaTex. Click here for an interactive track of Tropical Storm Allison.
Eleven U.S. deaths were attributed to Tropical Storm Allison, all due to drownings. Three deaths occurred in Texas, three in Louisiana, and five in Mississippi.
Due to the slow movement and multiple loops of Allison from the pre-depression stage on June 23rd through the dissipating post tropical cyclone stage on July 7th, numerous rounds of heavy rain and thunderstorms moved repletely over areas across Southeast Texas and the Western two thirds of Louisiana. This caused historic freshwater and river flooding from the Houston Metropolitan to Beaumont/Port Arthur, Texas areas, and most of Western Louisiana from Lake Charles to DeRidder and Leesville.
WIND & PRESSURE:
The strongest winds associated with Tropical Storm Allison occurred June 26th across Southeast Texas with the initial landfall, and June 27-28th across Central and Southern Louisiana, all associated with the strongest rain bands east of the center. Sea Rim State Park, Texas along coastal Jefferson County recorded a maximum sustained wind of 44 mph (38 knots) and a peak wind gust of 60 mph (52 knots) shortly after 5 AM CDT June 27th. The National Weather Service Lake Charles, Louisiana recorded a maximum sustained wind of 43 mph (37 knots) and a peak wind gust of 55 mph (48 knots) during the early morning hours of June 27th. For complete meteorological statistics, see the Wind and Pressure section.
STORM SURGE:
Tides of 3 to 4 feet MSL occurred across Jefferson County in Southeast Texas causing minor coastal flooding, mainly along Highway 87. Tide levels from Cameron, Louisiana were not available, but the usual spots of Highway 82 between Holly Beach and Cameron had minor flooding. Higher tides of at least 6 feet MSL occurred across the northern portion of Galveston Bay with a visual observation of water level just over the 6 foot MSL top of the staff gauge at Baytown, TX. For other storm surge and high-water marks, see the Storm Surge section.
RIVER LEVELS:
Major flooding occurred, especially along the Calcasieu, Sabine and Neches river basin. Many locations reached levels ranking in the top 5 highest in recorded history. For other river level crests, see the River Levels section.
RAINFALL:
Due to the slow movement and multiple loops of Allison from the pre-depression stage on June 23rd through the dissipating post tropical cyclone stage on July 7th, numerous rounds of heavy rain and thunderstorms moved repletely over areas across Southeast Texas and the Western two thirds of Louisiana. Fifteen to twenty inches of rainfall was recorded across most reporting stations across Southeast Texas and Western Louisiana. The highest total recorded within our region was 21.81 inches in Sulphur, Louisiana and 21.56 in Orange, Texas. Further east across Central and South-Central Louisiana, generally 10 to 15 inches of rainfall was recorded. The highest official rainfall of 25.67 inches with an unofficial total of 29.52 inches was recorded near Winnfield, Louisiana just north of our region. For complete rainfall totals reported across our region, see the Rainfall section.
TORNADOES:
Numerous F1 tornadoes were reported within the rain bands of Allison, with the most occurring on June 27th. The most noteworthy was the F1 tornado near Hackberry, Louisiana at 8:20 AM CDT June 27th causing about a quarter million dollars in property damage with two injuries. For complete details on all the tornadoes reported across Texas and Louisiana, see the Tornadoes section.
|


