|
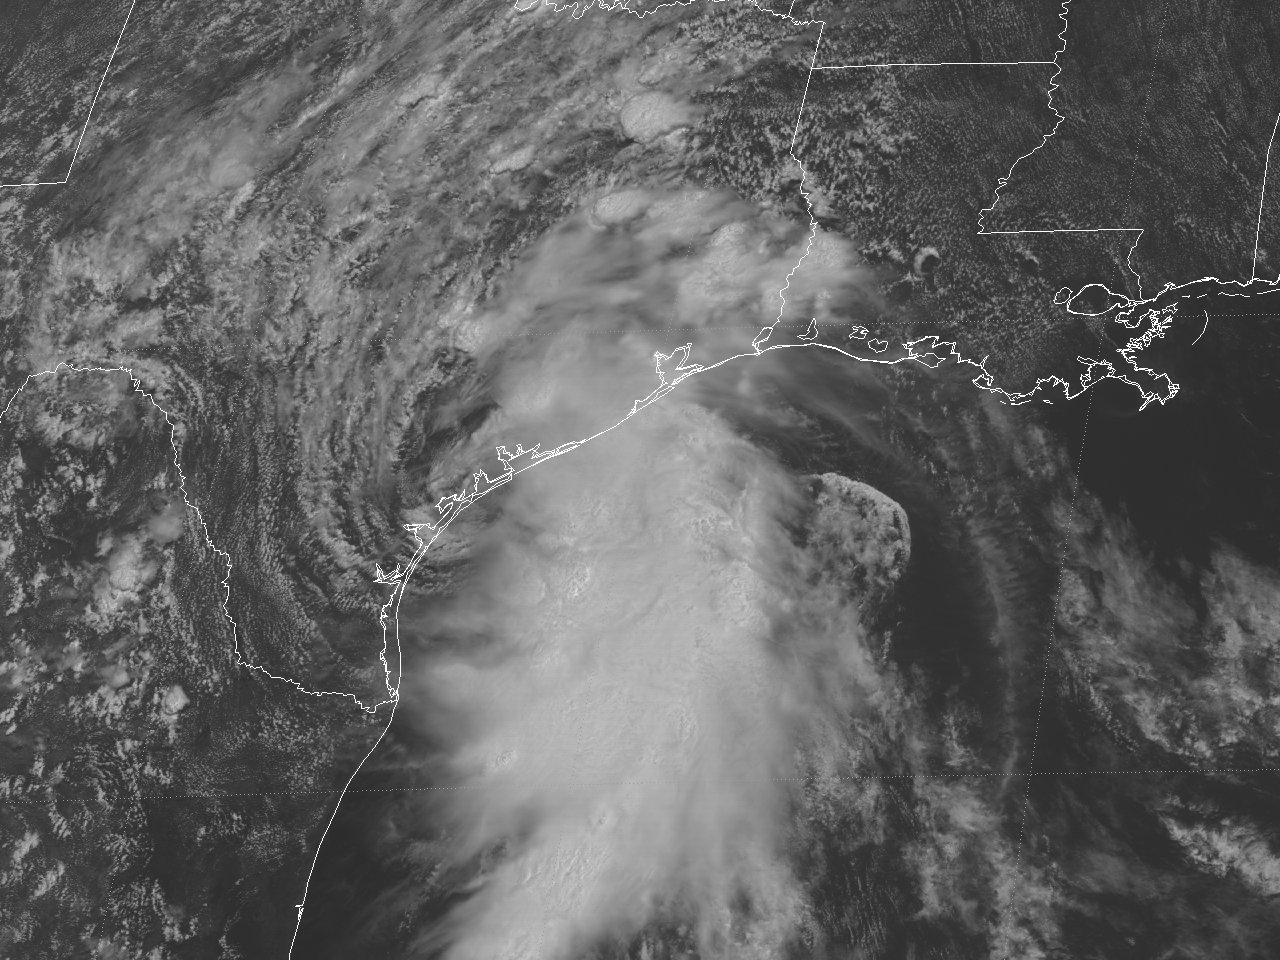
Above: GOES 13 Visible Satellite Image of Tropical Storm Bill making landfall across the Central Texas coast at 11:45 AM CDT June 16, 2015.
The genesis of Tropical Storm Bill began as a tropical disturbance across the Western Caribbean Sea and the interaction with an upper-level trough on June 12th. For the next couple of days, the tropical disturbance moved northwest, eventually crossing the Yucatan Peninsula on June 13-14th. The disturbance emerged over the southern Gulf late on June 14th and moved across the central Gulf on June 15th. While the disturbance was producing tropical storm force winds, the surface low was very broad and elongated as determined by aircraft reconnaissance investigating the system.
By the evening of the 15th, the circulation began consolidating enough to be classified as a tropical storm, with the National Hurricane Center initiating advisories by 10 PM. Tropical Storm Bill gradually became better organized overnight into the morning hours of June 16th, but still had most of the tropical storm force winds near the center across the eastern semicircle of the system. The center of Tropical Storm Bill made landfall on Matagorda Island, Texas at 11:45 AM CDT with sustained winds of 60 mph and a central pressure of 997 millibars (29.44 inches). Bill continued to move inland and re-curved northward across Central Texas later that evening into the morning of June 17th. See below for a preliminary track of Tropical Storm Bill.
Impacts from Tropical Storm Bill included tides 3.0 feet MLLW above astronomical predictions along the Upper Texas Coast. Along the Southwest and South Central Louisiana Coast, tides ranged 2.0 - 2.5 feet above astronomical predictions, with total tide values, or the storm surge, ranging from 3.75 to 4.25 feet MLLW. Gusts to tropical storm force were mainly confined to the rain bands along and south of I-10 to the coast and coastal waters on June 15-16th.
The biggest impact was flash flooding during the afternoon and evening of June 17th into June 18th across Southeast Texas. Even though the center of Bill was north of Dallas, TX (creating another flood across the Red River), a persistent southwest to northeast oriented feeder band set up across Southeast Texas, where it persisted with training thunderstorms for most of the afternoon and evening. The highest rainfall total was a CoCoRaHS observation near Kirbyville, TX with 9.51 inches (10.53 storm total), with 8-10 inches of rainfall common for most of Jasper, Newton, Hardin, Jefferson, and Orange Counties. Lake Charles WSR-88D Dual-Pol estimates was higher across Southern Jasper County estimating 12-15 inches possible, but no ground truth observations were available.
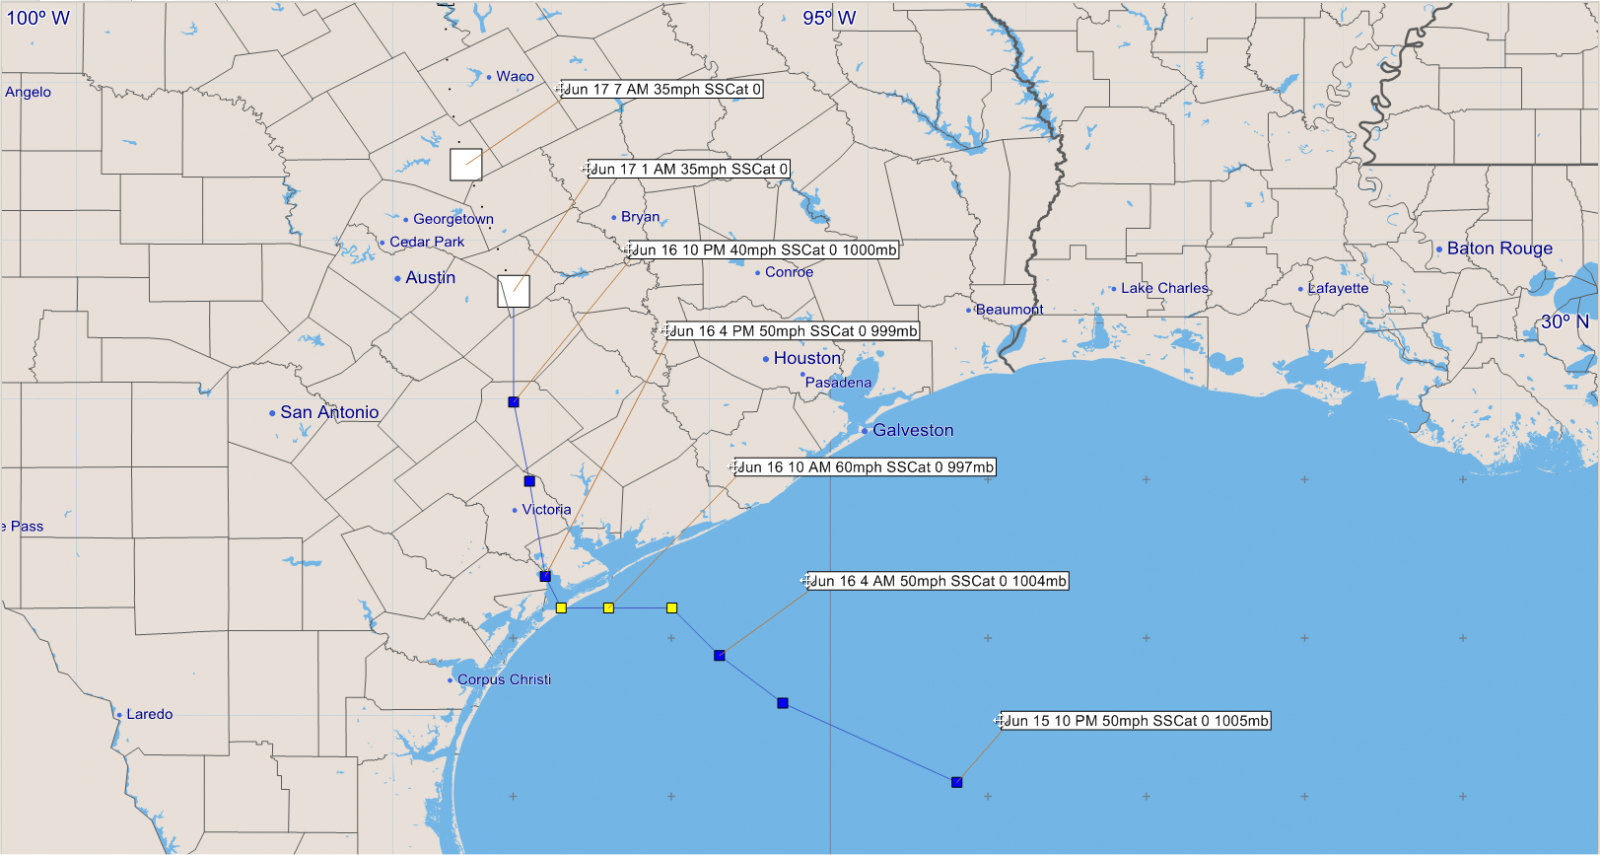
Above: Hurrevac track of Tropical Storm Bill from operational National Hurricane Center public advisories.
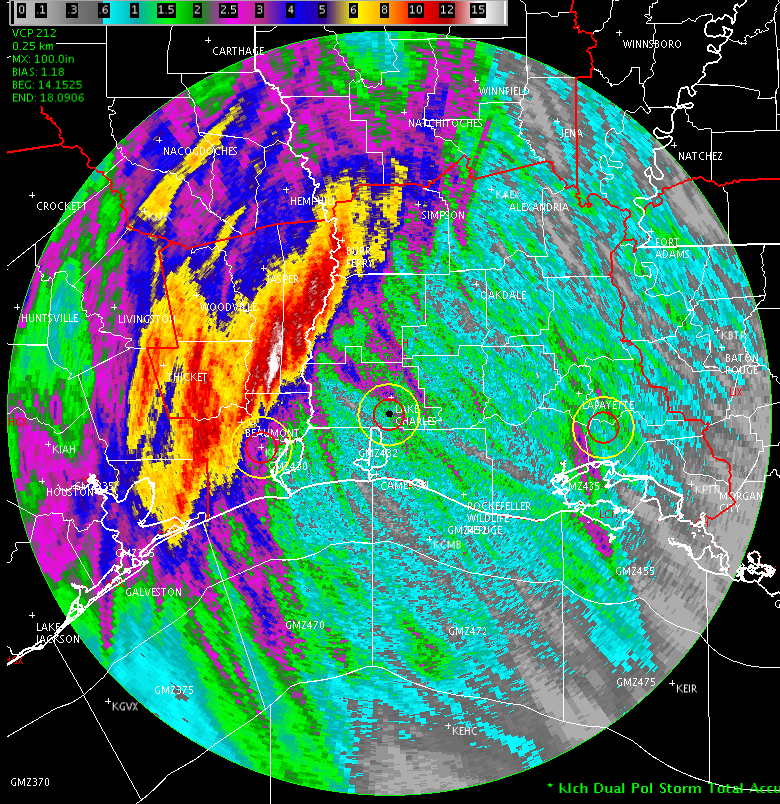
Above: Lake Charles, LA WSR-88D Dual-Pol Storm Total Precipitation Estimate June 14-18, 2015. Most of the rainfall over Southeast Texas occurred during the afternoon and evening of June 17, 2015.
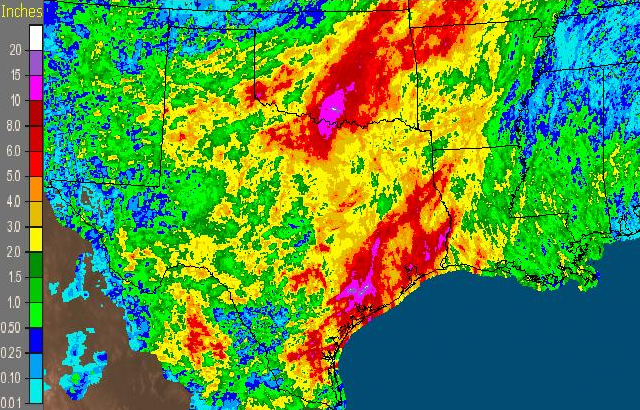
Above: Storm Total Precipitation Estimate across the region for June 13-19, 2015.
Listed below are post-storm reports and meteorological data gathered. All data is considered preliminary, and is subject to change at any time. Additional information will continue to be added to this page in the future.
|


.png)
.png)
.png)
.png)
.png)
.png)
.png)
.png)
.png)
.png)
.png)
.png)
.png)
.png)