|
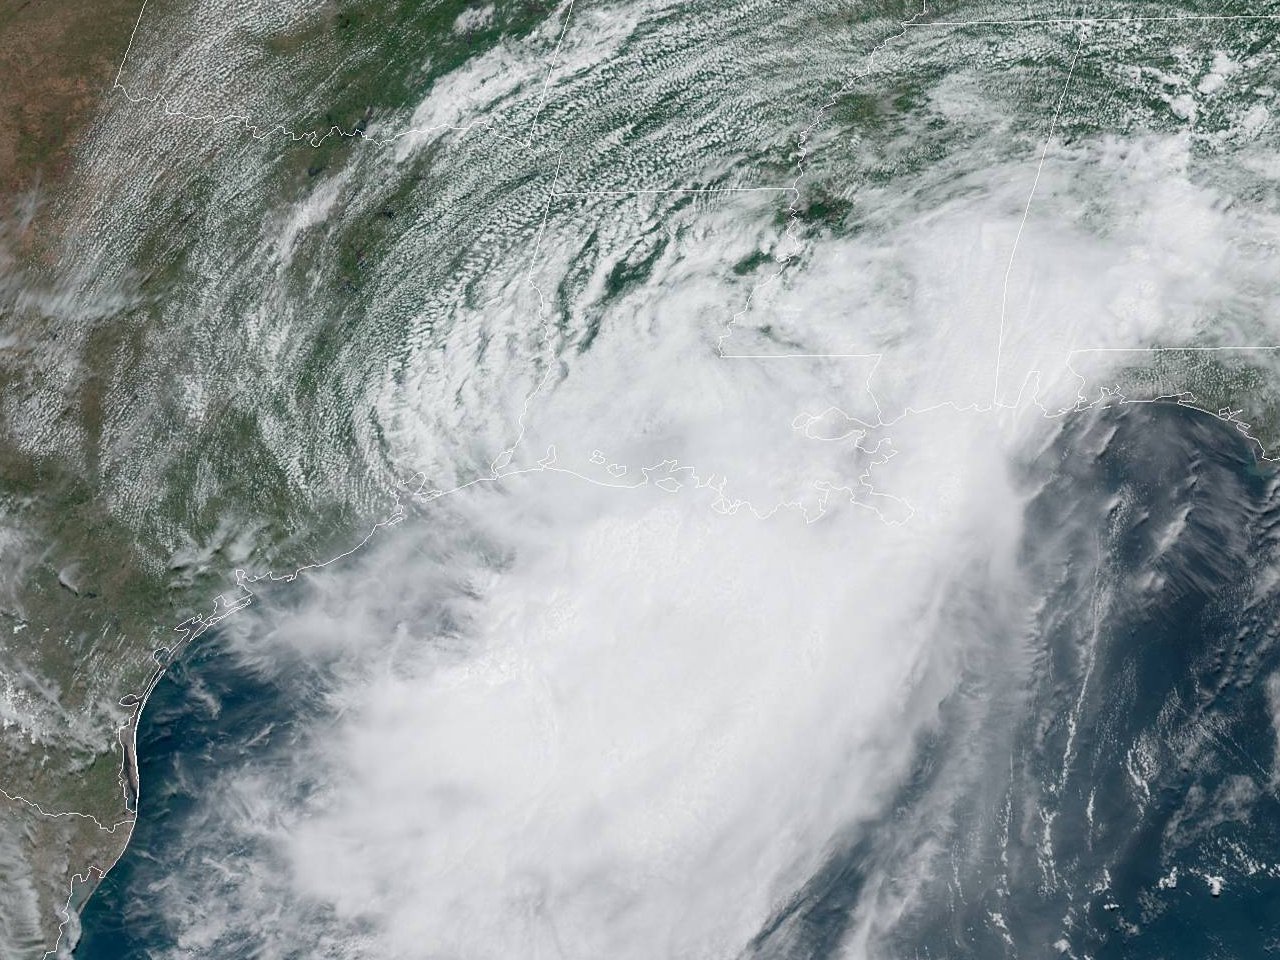
Above: GOES 16 GeoColor Satellite Image of Hurricane Barry around landfall at Intracoastal City, LA at 12:01 PM CDT on July 13, 2019.
On July 6, the National Hurricane Center began monitoring a trough of low pressure as it moved from the Midwest over the Tennessee Valley. The National Hurricane Center expected the trough to emerge into the Gulf, and potentially develop into a tropical cyclone within several days. From July 6-9th, the trough drifted southeastward across Tennessee, and southward across Georgia and the Florida Panhandle due to the steering influence of a ridge of high pressure over the Central United States. On July 9th, a broad area of low pressure developed across South Alabama, Georgia & the Florida Panhandle before the system entered the Gulf. The low-pressure system, while still lacking a well-defined center of circulation, became a little better defined on the following day. As the system had a high potential of producing tropical storm conditions and storm surge along the coast of Louisiana within the next couple of days, the National Hurricane Center initiated advisories on Potential Tropical Cyclone Two at 10 AM CDT on July 10th. The system subsequently organized into a Tropical Storm Barry at 10 AM CDT on July 11th.
Tropical Storm Barry moved slowly westward, only slowly strengthening due to the tropical cyclone experiencing northerly wind shear through July 12th. This resulted in an abnormally structured storm, with most of the thunderstorms south of the center.
By the morning of July 13th, thunderstorms moved closer to the center of circulation, but overall still was experiencing northerly wind shear. By 7 A.M. CDT, Barry was upgraded to a hurricane based on observations from the Hurricane Hunters, Lake Charles & New Orleans Doppler Radar estimates, and sustained winds of 71 mph with a peak gust of 85 mph recorded at the National Ocean Service Tide Station at Eugene Island, LA. Barry made landfall as a minimal category 1 hurricane with maximum sustained winds of 75 mph (65 knots) and a minimal central pressure of 993 millibars (29.32 inches) about 12 miles east-southeast of Pecan Island, Louisiana. Barry weakened to a tropical storm by early afternoon on July 13th as it continued to track in a general northwestward direction over Southern Louisiana for the remainder of the day. Barry began moving northward over Western Louisiana on July 14th and weakened to a tropical depression by 4 P.M. CDT when the center was near Shreveport, LA. Barry continued northward over Western Arkansas on July 15th, weakening into a post-tropical low over northern Arkansas by the afternoon.
The following summarizes the effects of Barry by parishes across the National Weather Service Lake Charles area of responsibility.
Cameron Parish, LA:
Voluntary evacuations were called for south of the Intracoastal Waterway. Isolated power outages occurred due to the tropical storm-force wind gusts on Saturday and Sunday (July 13-14). When the winds shifted to the south on Sunday July 14th, tides rose and reached the edge of Highway 82 from Johnson Bayou to Holly Beach and near Rockefeller Refuge. Rainfall of 1 to 5 inches fell in Cameron Parish.
Calcasieu Parish, LA:
Due to almost 20 inches of rain that fell between Sunday night July 14th and Monday morning July 15th in the northeastern section of the parish, widespread flooding occurred. Exact number of homes flooded Is still being determined, but the preliminary numbers show 55 homes and mobile homes with major flooding, 105 with minor damage, and another 40 affected. In addition, 5 businesses received minor flooding. The worst hit areas were the north side of Moss Bluff through the Gillis and Topsy area. At least 20 water rescues were conducted, primarily for people who drove vehicles into water that was too deep. U.S. Highway 171 was closed from Moss Bluff north into Beauregard parish. Due to occasional wind gusts to near tropical storm-force, isolated power outages were noted on Saturday and Sunday (July 13-14).
Beauregard Parish, LA:
Southeastern Beauregard parish received 20 to 25 inches of rain between Sunday night and Monday morning (July 14-15). This was primarily in the Ragley region where widespread flooding occurred. U.S. Highway 171 was closed south of Ragley down through parts of Calcasieu Parish. Surveying is incomplete, but so far 15 homes are known to have been flooded. In addition, there were 10 water rescues for people who drove into deep water. Due to winds gusting to near tropical-storm force on Saturday and Sunday (July 13-14), isolated power outages occurred.
Vernon Parish, LA:
Vernon parish saw 1 to 6 inches of rain, causing isolated flash flooding in the southeastern part of the parish. Wind gusts near tropical storm-force on Saturday and Sunday (July 13-14) caused isolated power outages.
Jefferson Davis Parish, LA:
Jeff Davis parish saw 3 to 7 inches of rain, causing minor flooding from Jennings south to Lake Arthur. Isolated power outages occurred Saturday and Sunday (July 13-14) due to tropical storm-force wind gusts.
Allen Parish, LA:
Torrential rains Sunday night into Monday morning produced over 20 inches of rain in parts of western Allen parish. Widespread flooding was reported across the northern half of the parish. The number of homes flooded is still being investigated. In addition, isolated power outages occurred on Saturday and Sunday (July 13-14) due to tropical storm-force wind gusts.
Rapides Parish, LA:
Rainfall of 1 to 8 inches fell, causing isolated areas in the southeastern part of the parish to flood Sunday night into Monday (July 14-15). Isolated power outages were reported due to tropical storm-force wind gusts on Saturday and Sunday (July 13-14).
Vermilion Parish, LA:
A voluntary evacuation was called for low-lying areas in Vermilion Parish. Due to storm surge, Intracoastal City, Henry, Erath, and Delcambre flooded, with water depths varying from a few inches to several feet. Locals said the storm surge was comparable to what happened in 2002 with Hurricane Lili and Hurricane Ike in 2008. The number of homes flooded is still to be determined, although 10 uninsured homes were reported to flood. Rainfall totals of 3 to 10 inches fell over the weekend, and scattered power outages due to the tropical storm-force wind gusts occurred as well Saturday and Sunday (July 13-14). Scattered trees fell down across the parish.
Acadia Parish, LA:
A voluntary evacuation was called for south of LA 92. Rainfall of 3 to 8 inches of rain fell, causing isolated pockets of flooding. Due to tropical storm-force winds, several trees fell down. One tree hit a home and another hit a mobile home, causing major damage. Scattered power outages occurred over Saturday and Sunday (July 13-14).
Evangeline Parish, LA:
Several roads were closed due to heavy rains of 6 to 20 inches that fell Sunday night into Monday morning (July 14-15). How many homes flooded is still being investigated. In addition, tropical storm-force wind gusts toppled scattered trees, and scattered power outages were reported Saturday and Sunday (July 13-14).
Avoyelles Parish, LA:
Rainfall of 3 to 15 inches fell across Avoyelles parish, causing numerous roads to flood. Water was over a foot deep in places. Preliminary numbers show 5 homes receiving major damage, 10 with minor damage, and another 15 affected. Wind gusts of tropical storm-force on Saturday and Sunday (July 13-14) caused several trees to fall down, and scattered power outages occurred.
St. Landry Parish, LA:
Rainfall of 3 to 15 inches fell across St. Landry parish, causing flooded streets late Sunday into Monday (July 14-15). In addition, tropical storm-force wind gusts caused scattered power outages and blew down some trees.
Lafayette Parish, LA:
Rainfall of 3 to 7 inches fell across Lafayette parish, causing street flooding. In addition, tropical storm-force wind gusts caused scattered power outages and scattered trees to blow down.
St. Martin Parish, LA:
A voluntary evacuation was called for lower St. Martin parish, including the Stephensville area. Rainfall of 3 to 7 inches fell, causing scattered flooded roads on Saturday and Sunday (July 13-14). In addition, tropical storm-force wind gusts caused scattered to numerous power outages and many trees were blown down.
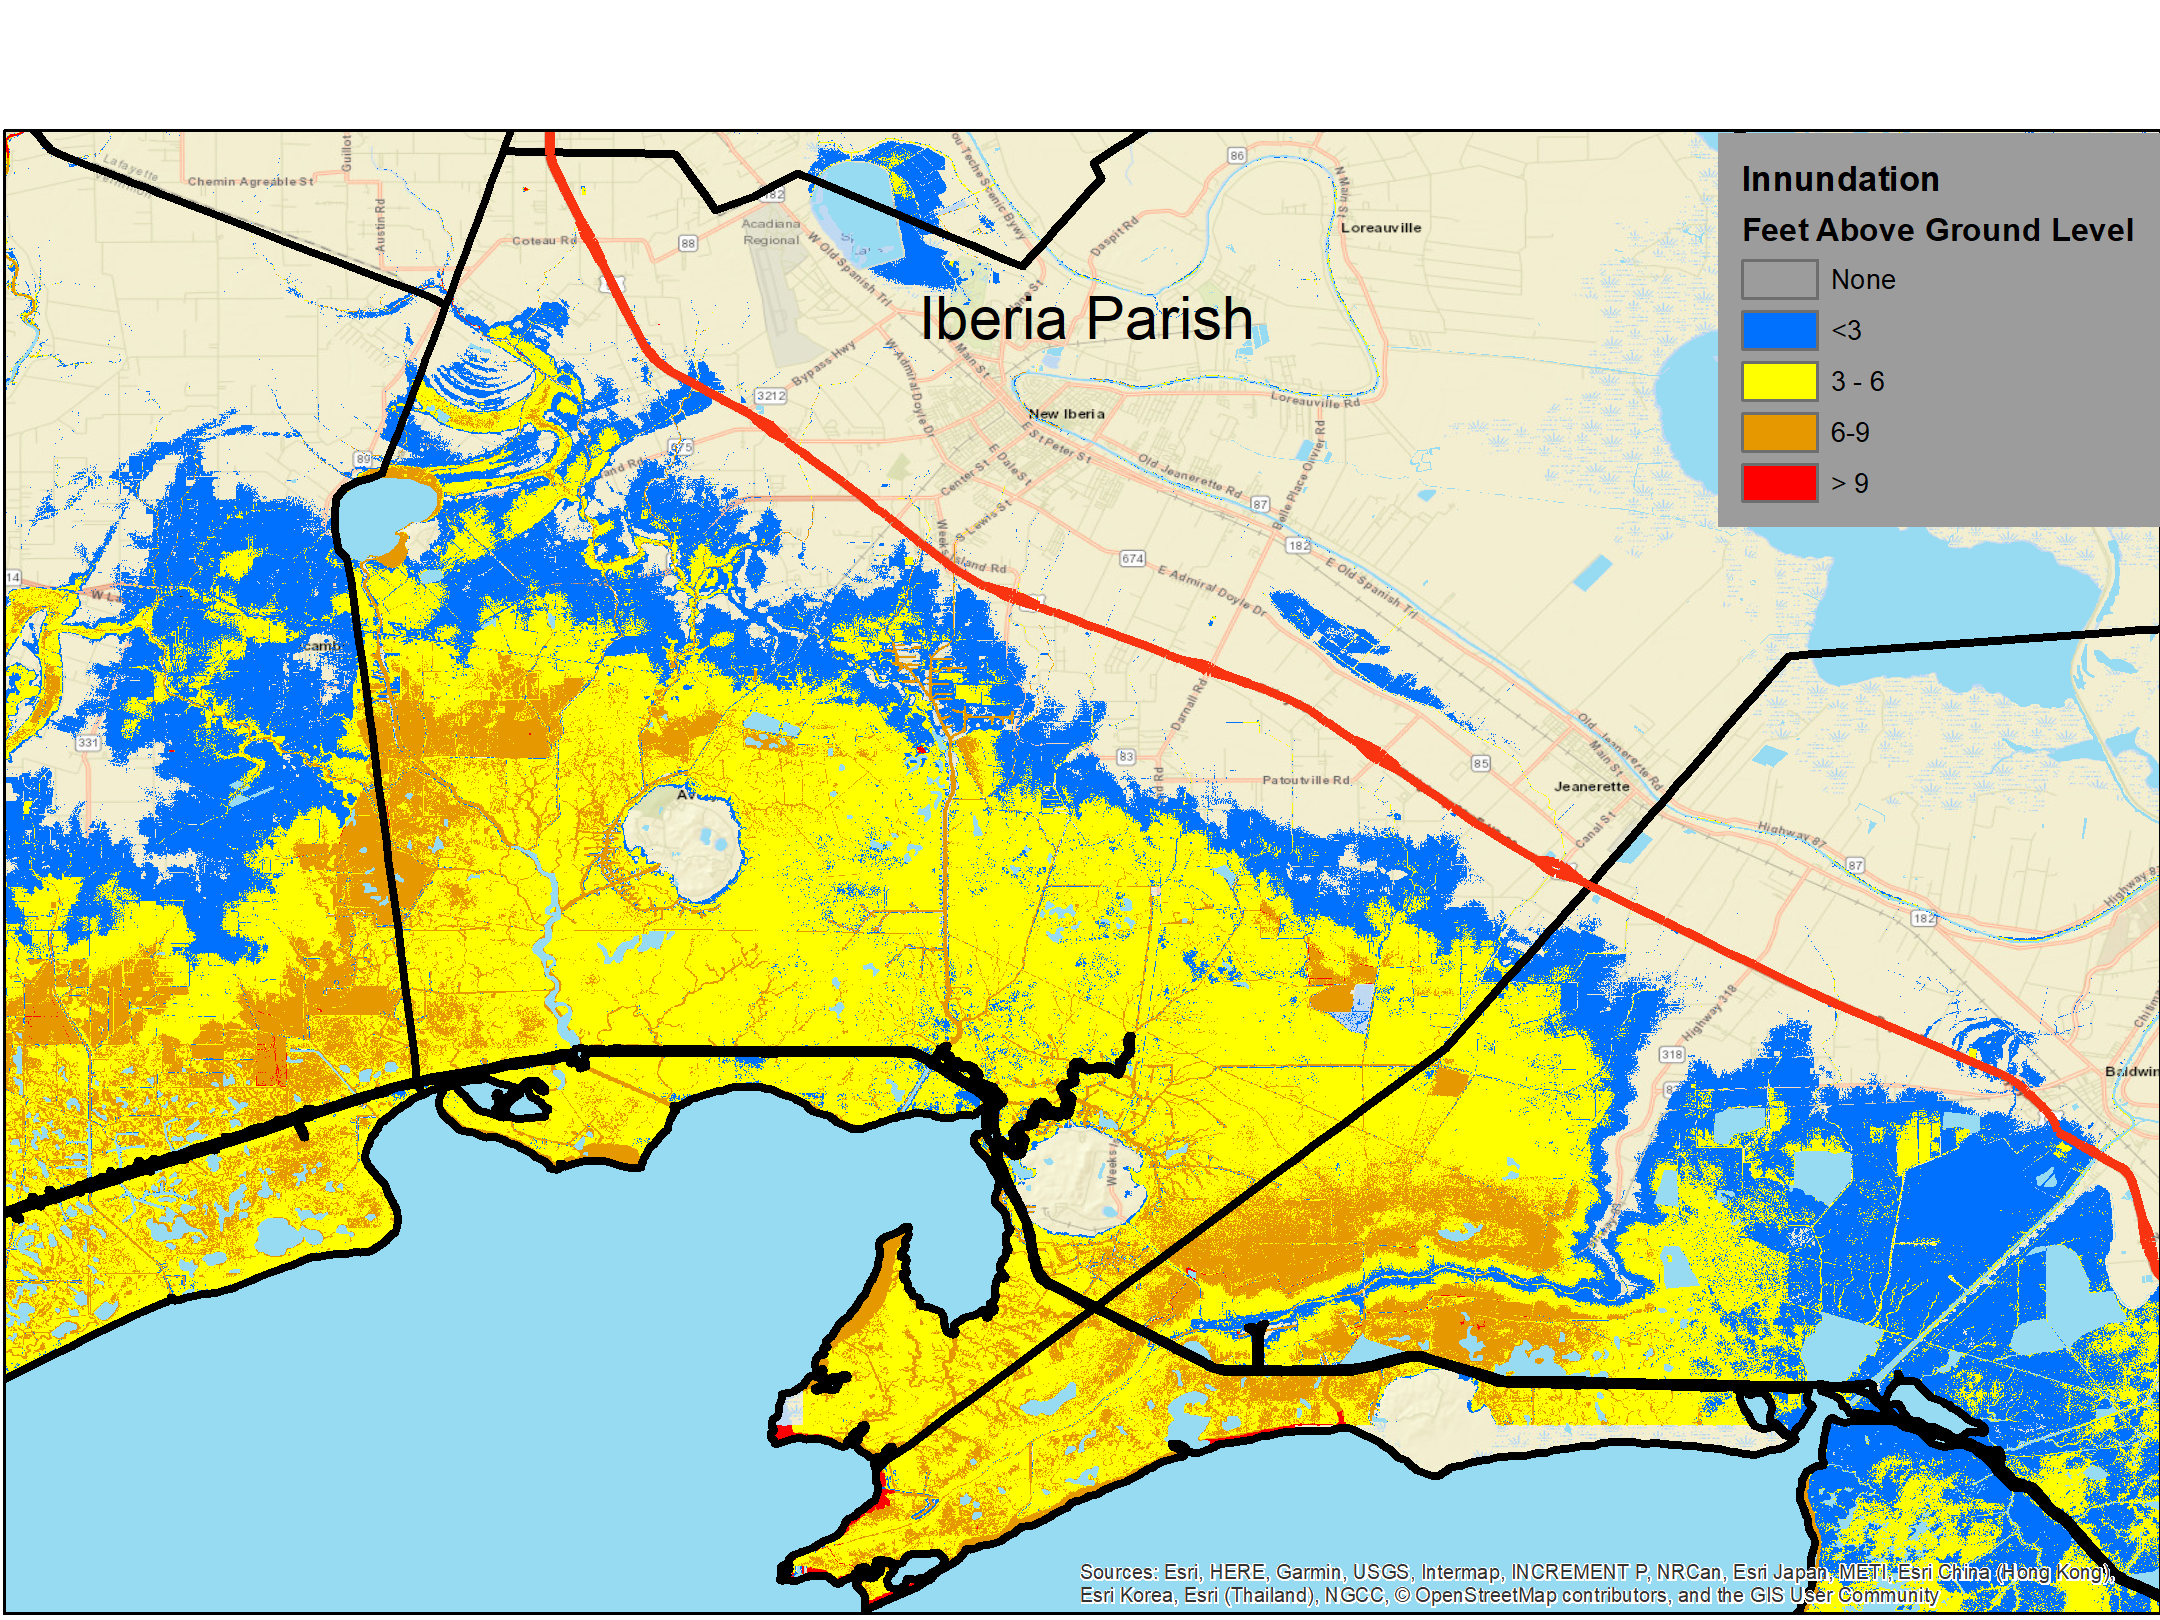
Iberia Parish, LA:
A voluntary evacuation was called for people living south of U.S. Highway 90 and other low-lying areas. Rainfall of 6 to 10 inches fell on Saturday and Sunday (July 13-14), causing widespread street flooding. In addition, storm surge caused parts of the Port of Iberia to flood. Other areas that saw storm surge flooding included the Delcambre area and areas northeast of Lake Peigneur. Locals compared the storm surge similar to what they saw with Hurricane Lili in 2002. Due to the strong tropical storm-force wind gusts, numerous power outages and numerous trees were blown down. The hospital in New Iberia lost power and it's two generators went out, so they had to evacuated 60 patients in the middle of the storm.
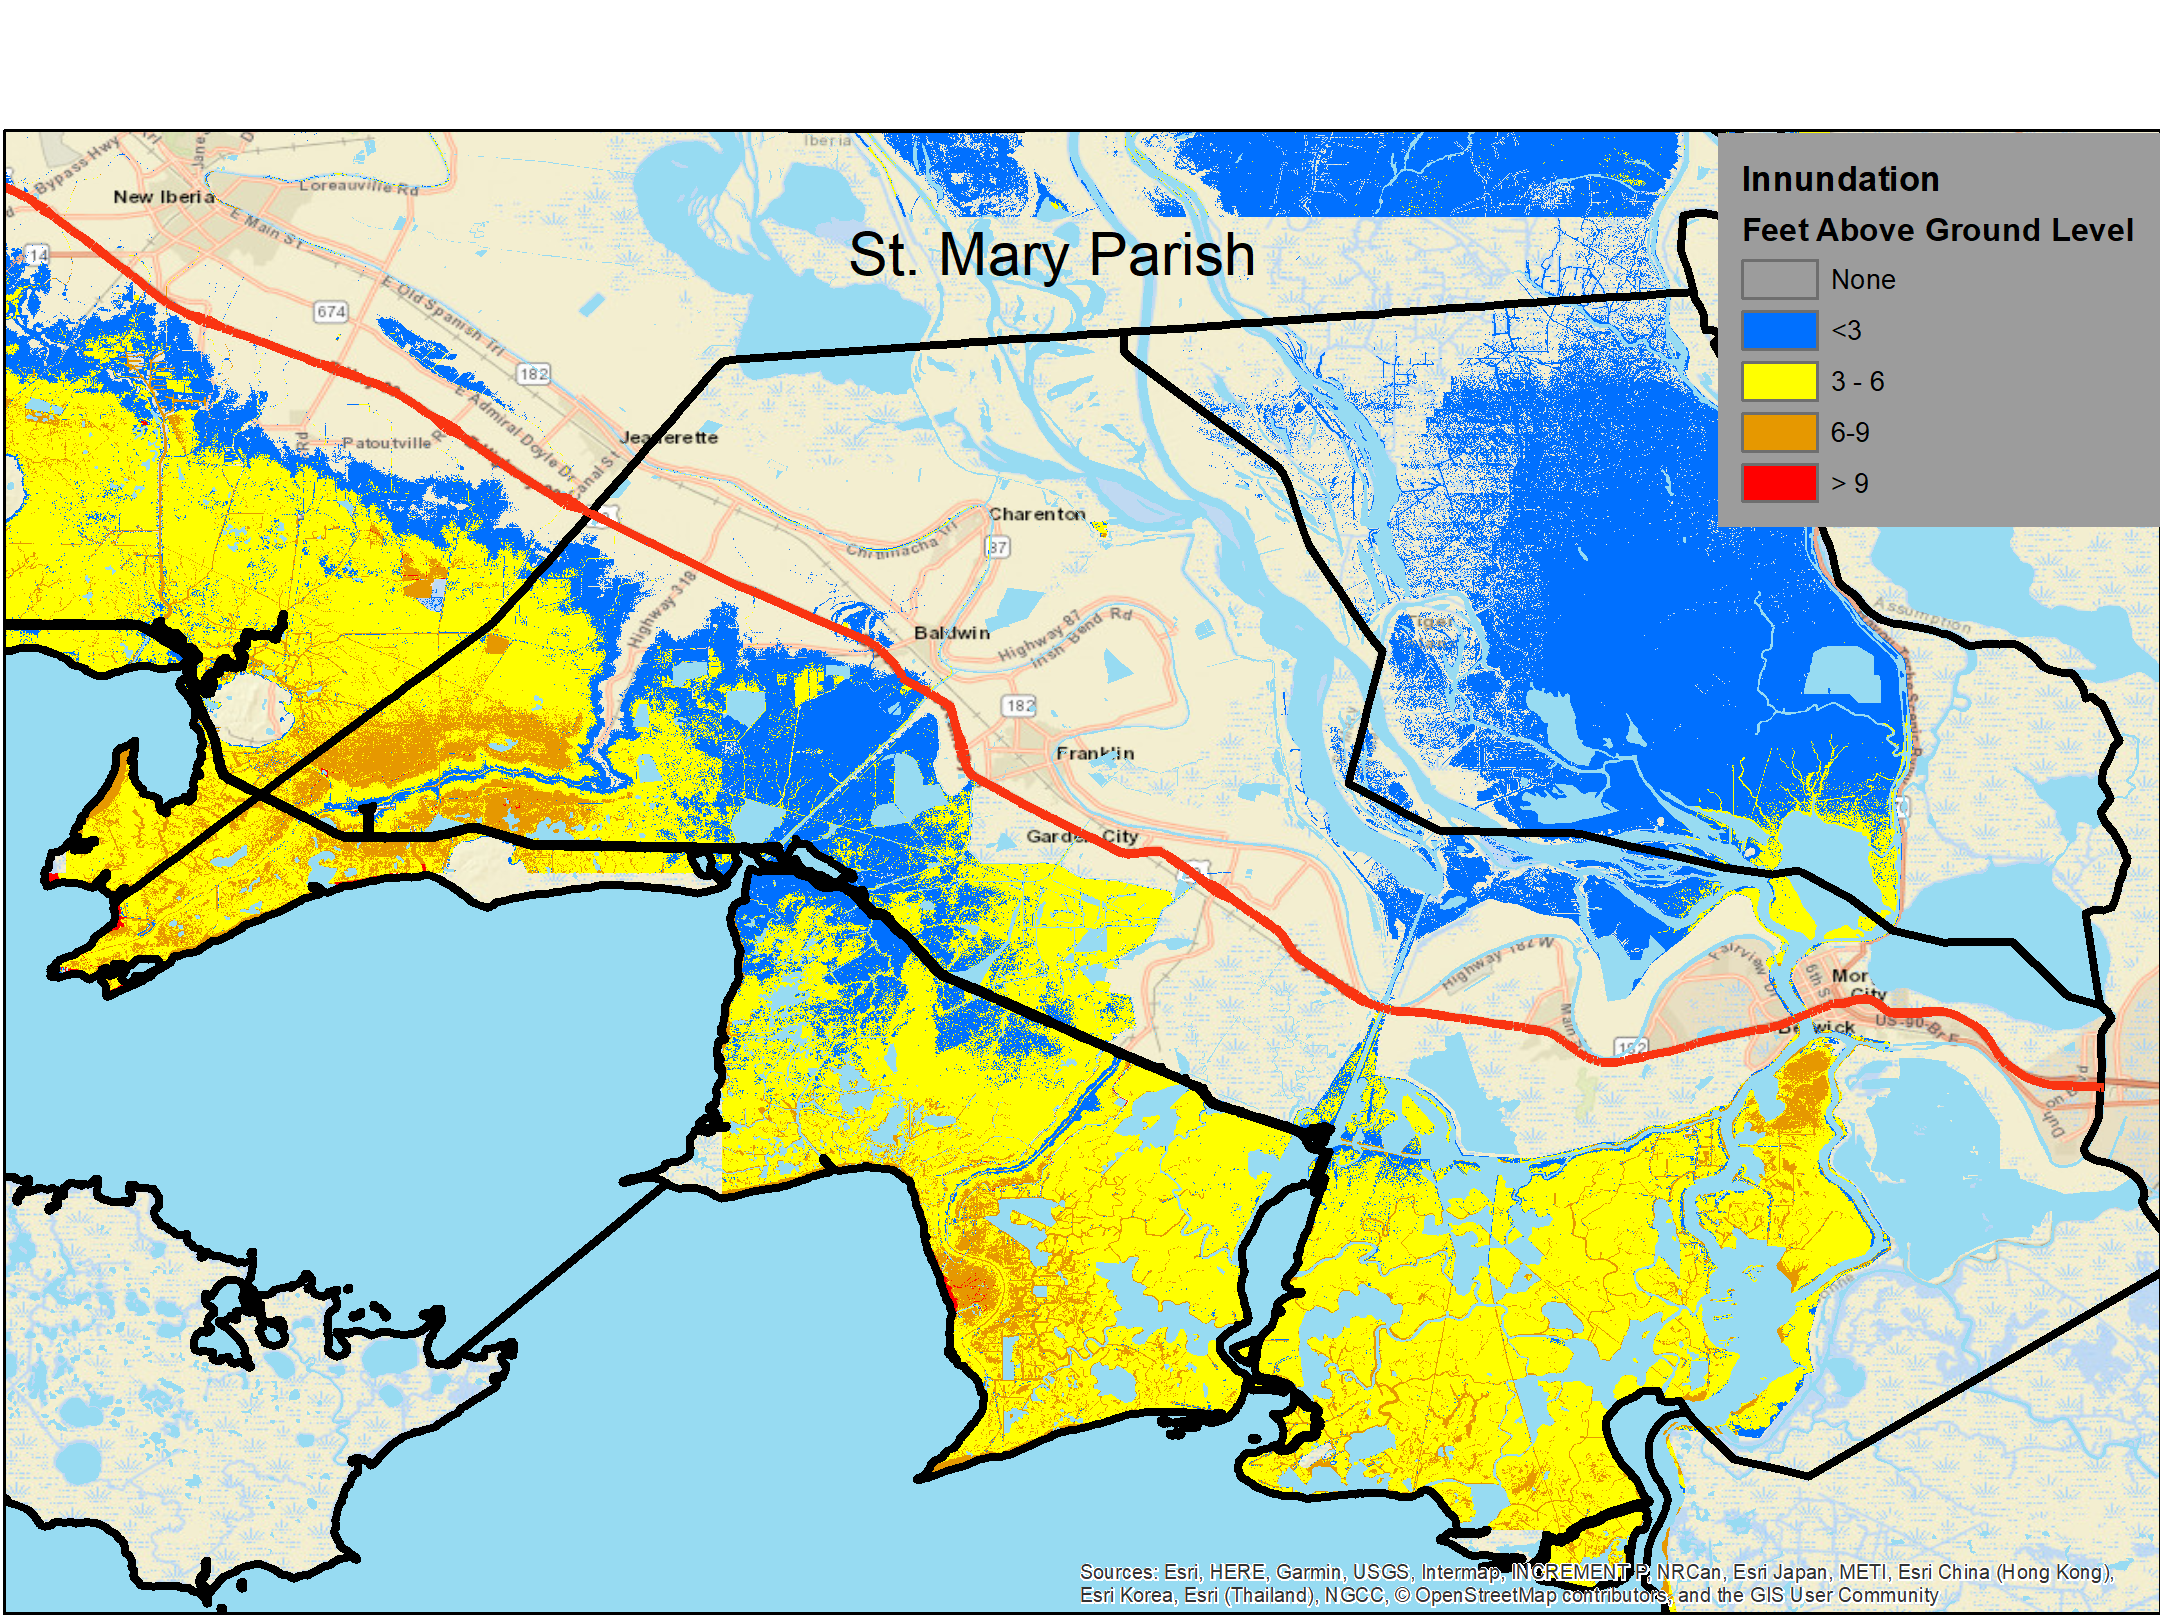
St. Mary Parish, LA:
Voluntary evacuations south of the Intracoastal Waterway were upgraded to mandatory due to storm surge impacts increasing. Cypremort Point, Burns Point, and areas outside of the levee in the Morgan city saw storm surge flooding. Levels varied from a few inches to 6 feet deep. Storm surge overtopped several levees, including the one on Highway 317. Locals compared the storm surge height comparable to a little higher than Hurricane Lili in 2002. St. Mary Parish saw 4 to 8 inches of rain, but saw widespread wind damage due to hurricane-force wind gusts. Power outages were widespread, and lasted for several days. Numerous trees and power lines were downed. Many homes and businesses saw wind damage.
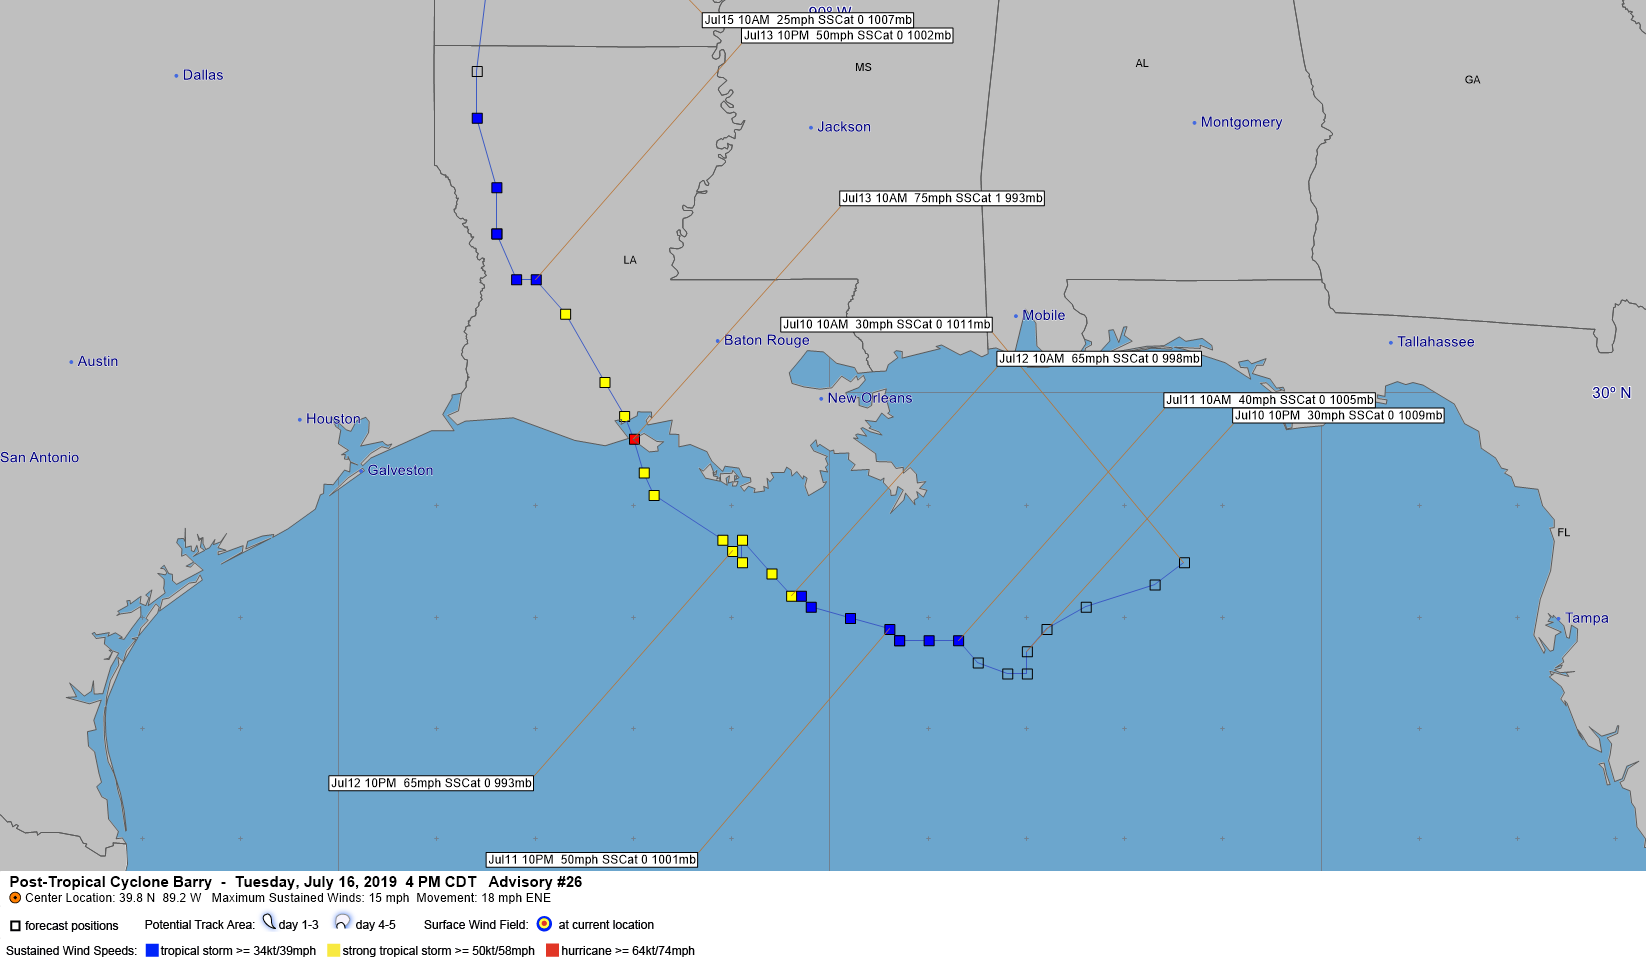
Above: Hurrevac track of Hurricane Barry from operational National Hurricane Center public advisories.
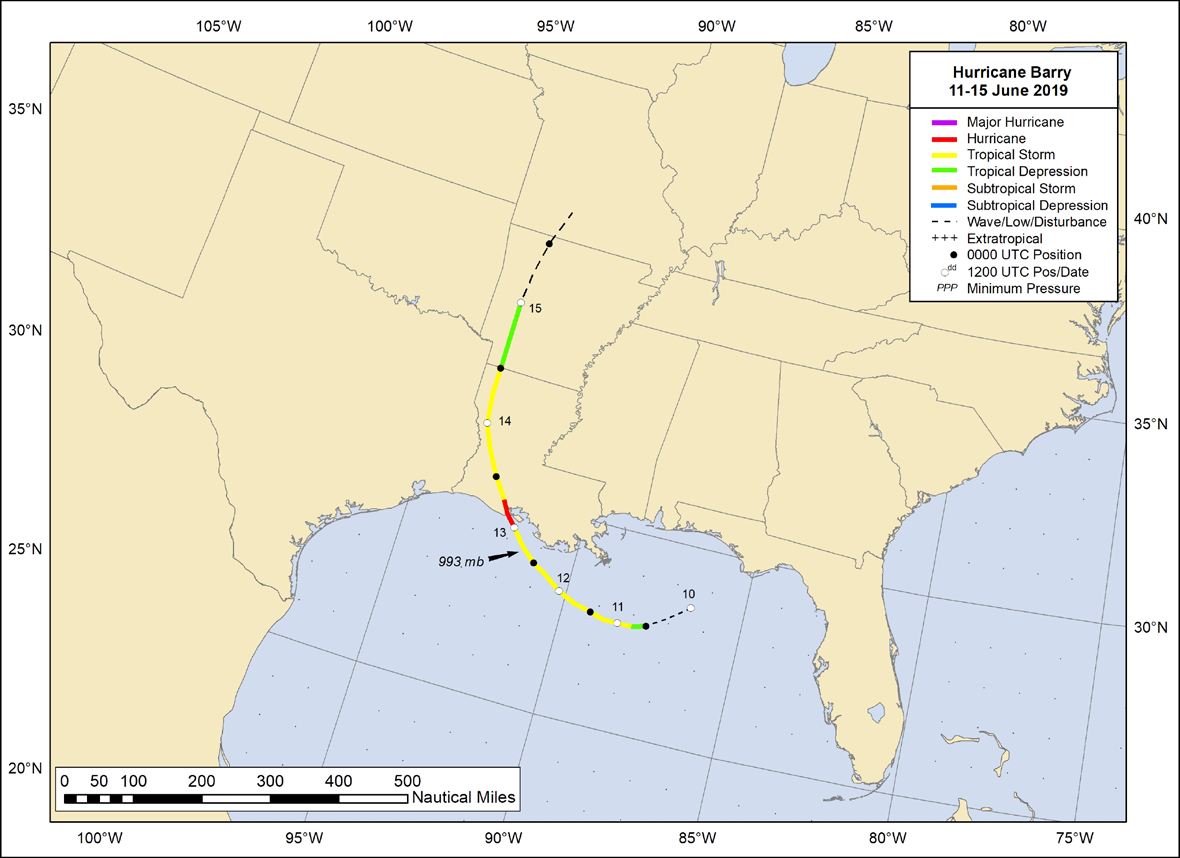
Above: National Hurricane Center track of Hurricane Barry.

Above: Raw NOAA Multi-radar multi-sensor quantitative precipitation estimation (inches) for Barry from July 12 (7 AM CDT) to July 16 (7 AM CDT), 2019. Graphic created by Jonathan Brazzell.
Listed below are post-storm reports and meteorological data gathered. All data is considered preliminary, and is subject to change at any time. Additional information will continue to be added to this page in the future.
| NOS Tidal Water Graphs |
| Sabine Pass North, TX |
Texas Point, Sabine Pass, TX |
Port Arthur, TX |
Rainbow Bridge, TX |
| Calcasieu Pass, LA |
Bulk Terminal, LA |
Lake Charles, LA |
Freshwater Canal Locks, LA |
| Eugene Island, LA |
Amerada Pass, LA |
Berwick, LA |
|
Webpage design by: Donovan Landreneau
Content by: NWS Lake Charles staff, other sources as noted above.
|


.png)
.png)
.png)
.png)
.png)
.png)
.png)
.png)
.png)
.png)
.png)
.png)
.png)
.png)
.png)
.png)
.png)
.png)
.png)
.png)
.png)
.png)
.png)
.png)
.png)
.png)