National Weather Service United States Department of Commerce

Severe Storms and Heavy Rain the Mississippi Valley and Midwest; Widespread Heat in the Central US

Severe thunderstorms and showers have the potential for large hail, a few strong tornadoes, damaging winds with gusts over 75 mph, and localized flash flooding across parts of the Mid/Upper Mississippi Valley and Midwest. A widespread heat wave will continue across the Central U.S. and Midwest today. Fire weather concerns persist in the Southwest into the central Rockies and northern California. Read More >

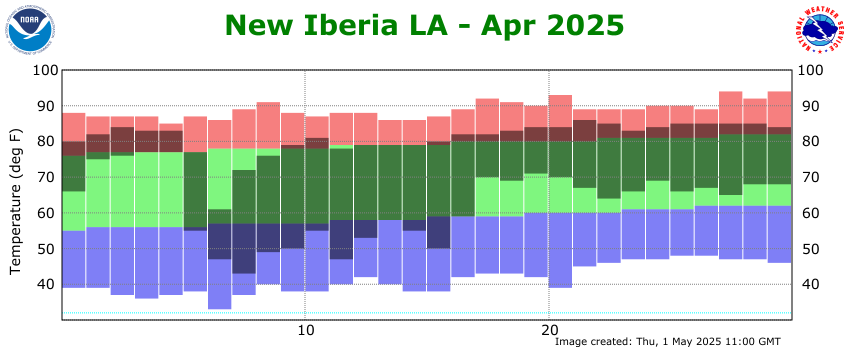
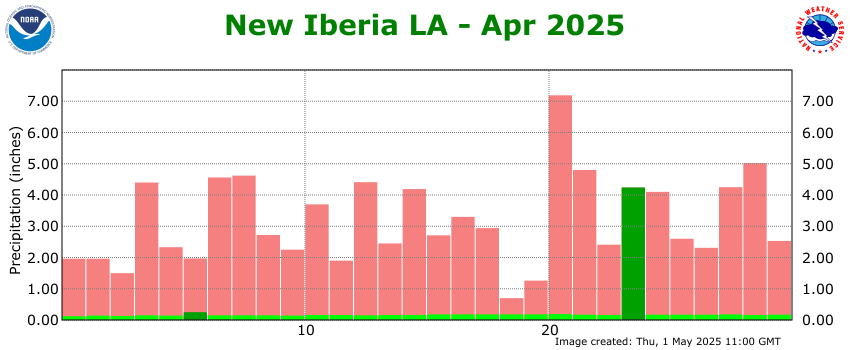
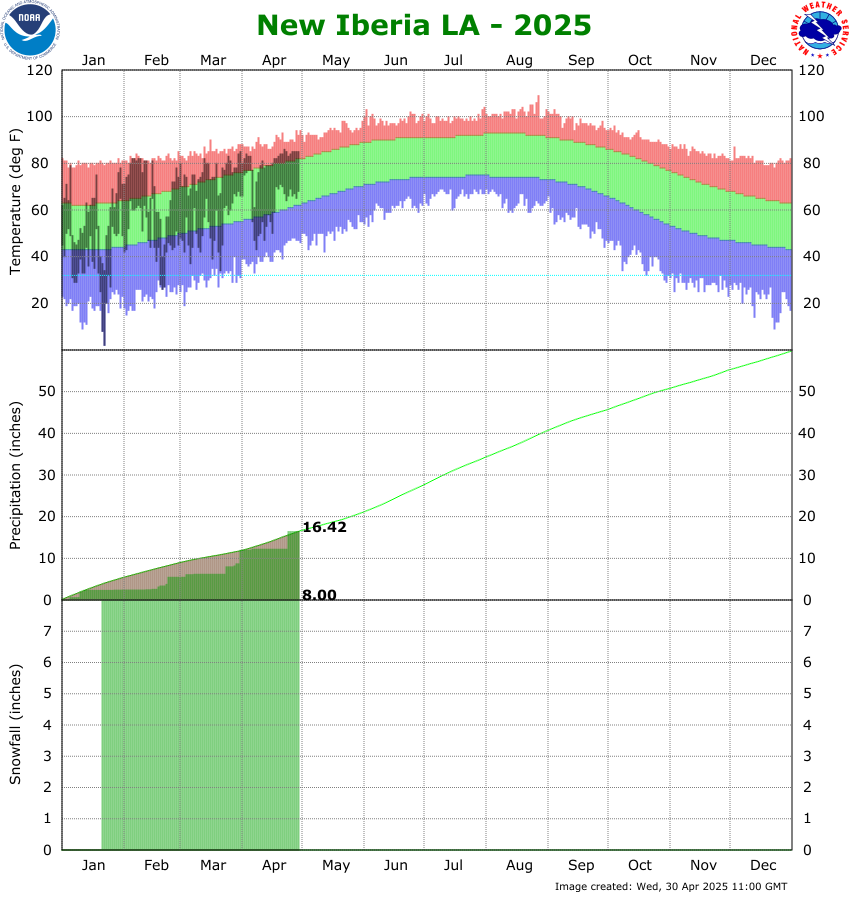
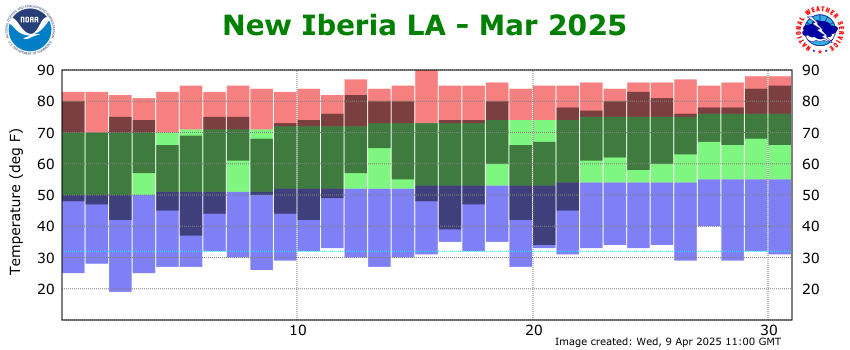
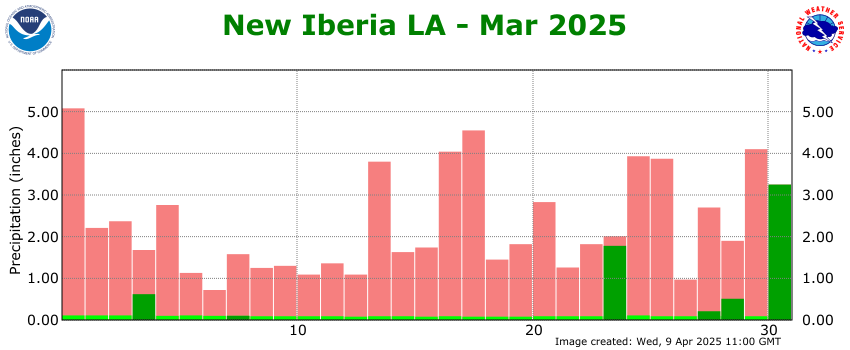
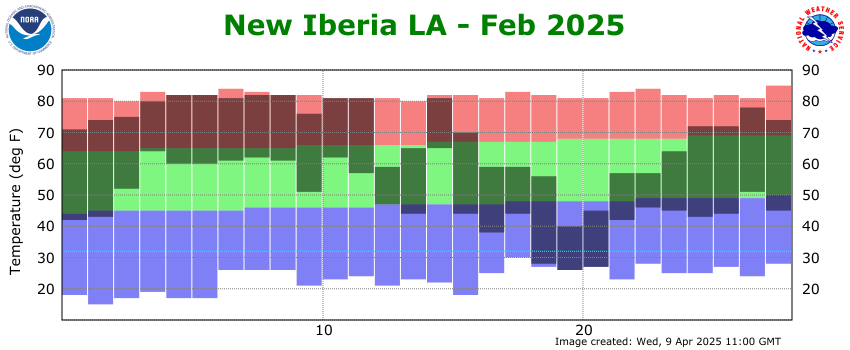
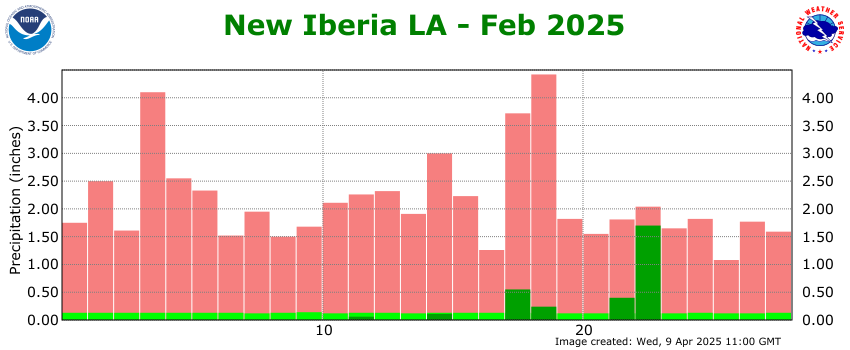
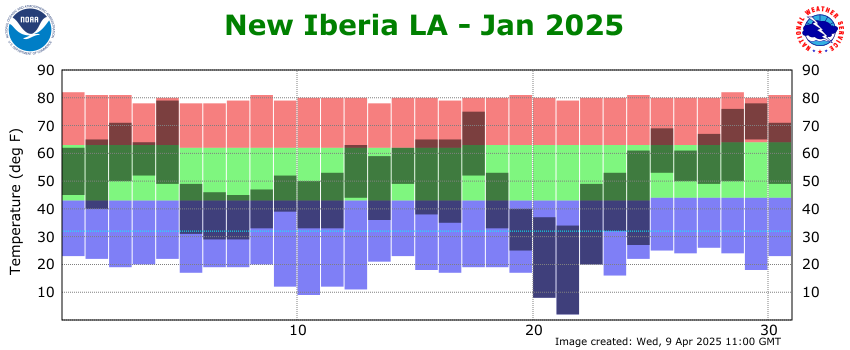
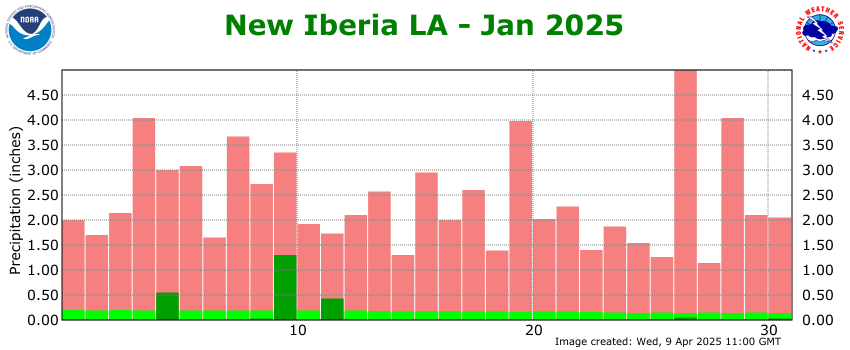
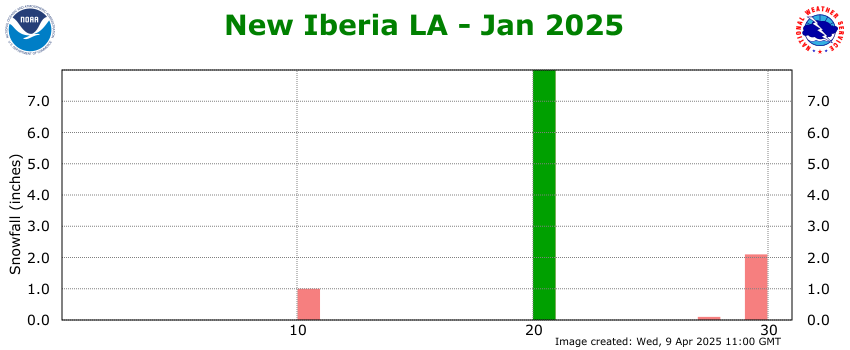
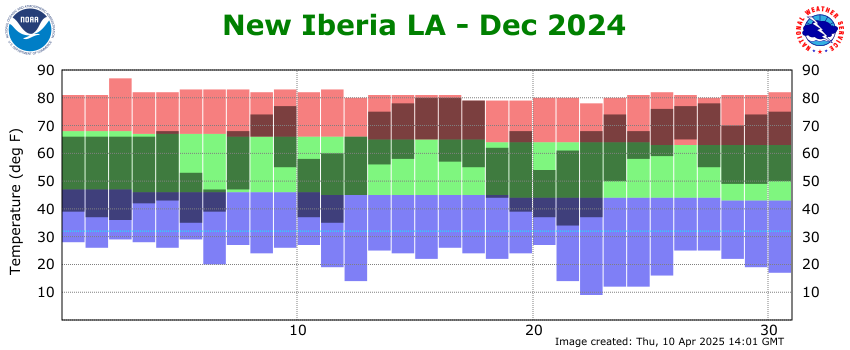
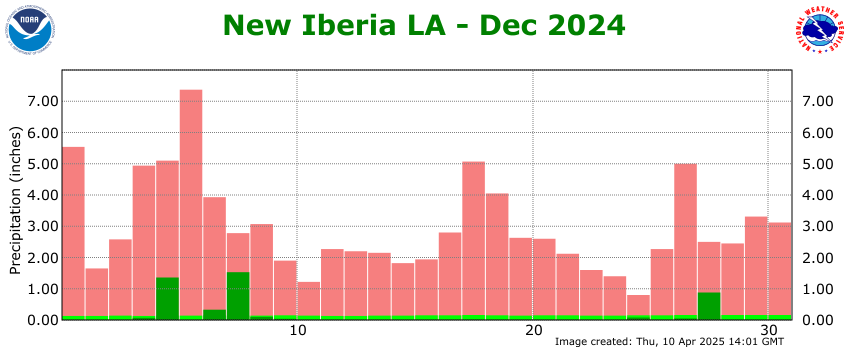
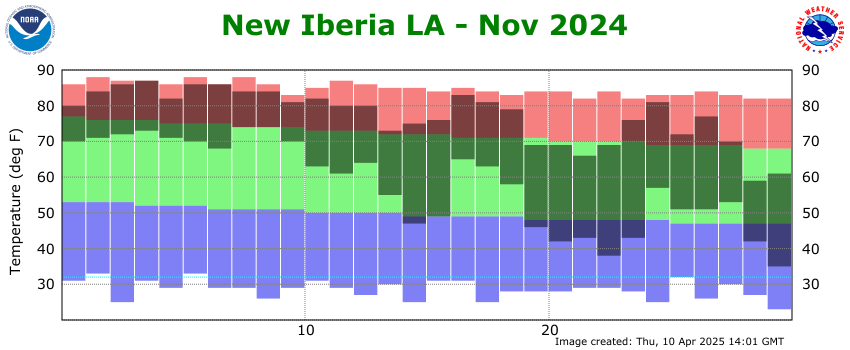
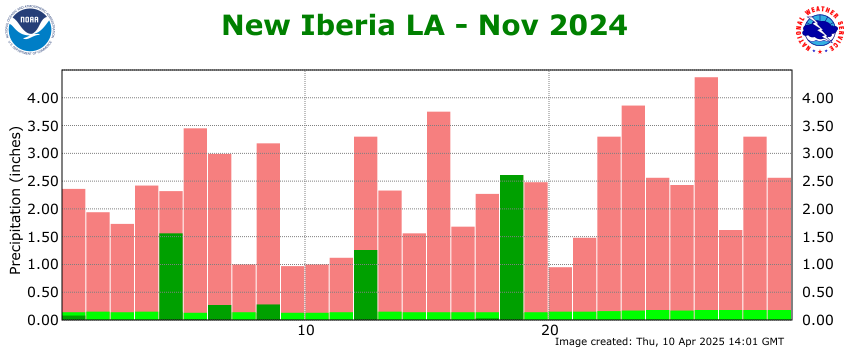
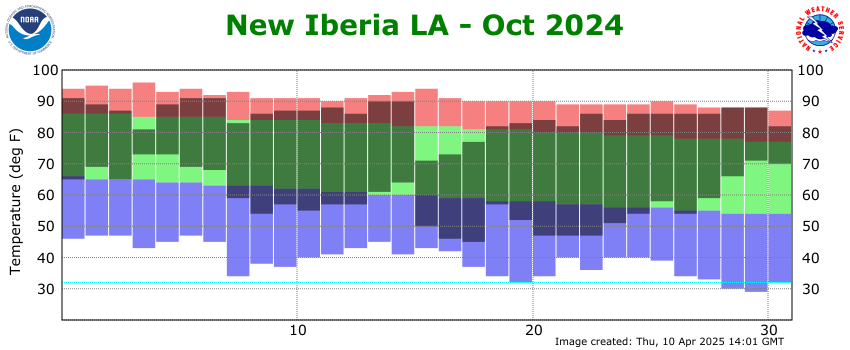
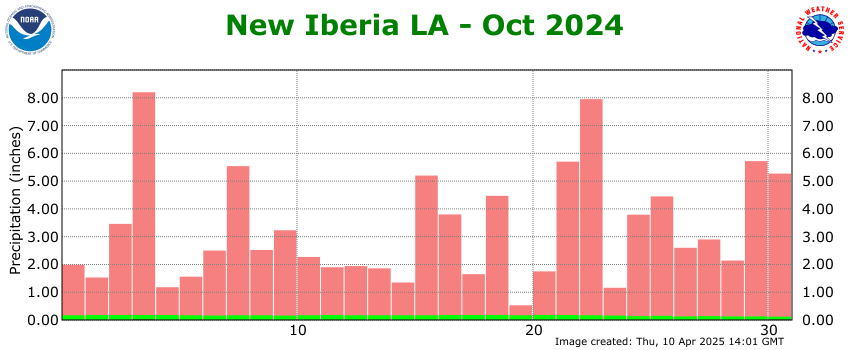
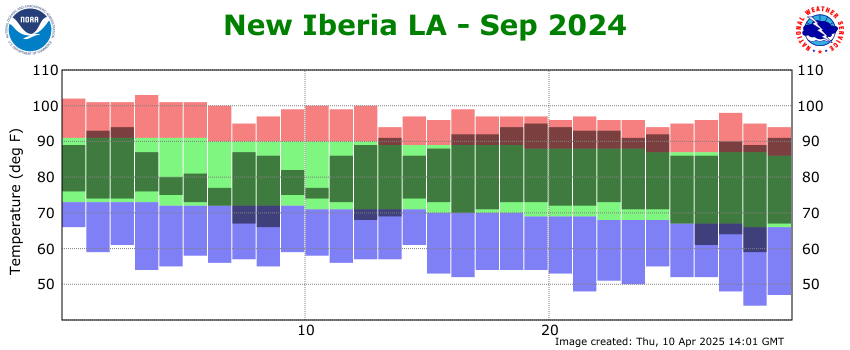
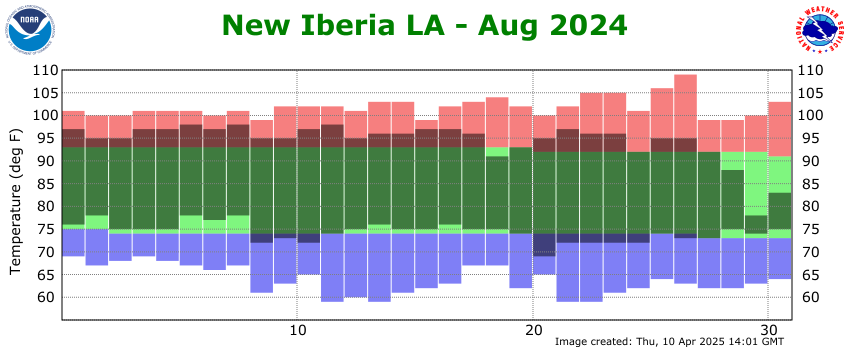
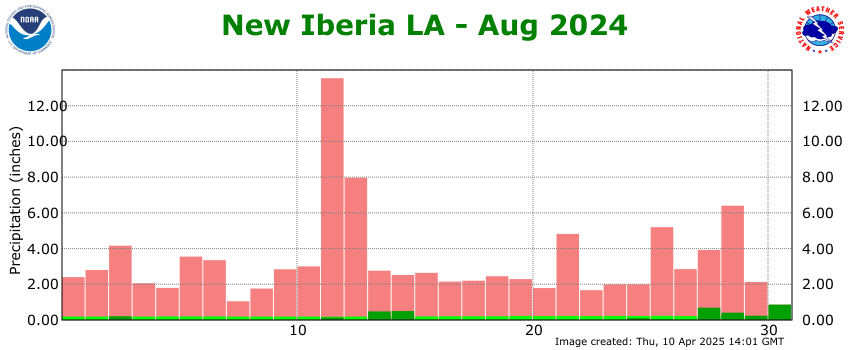
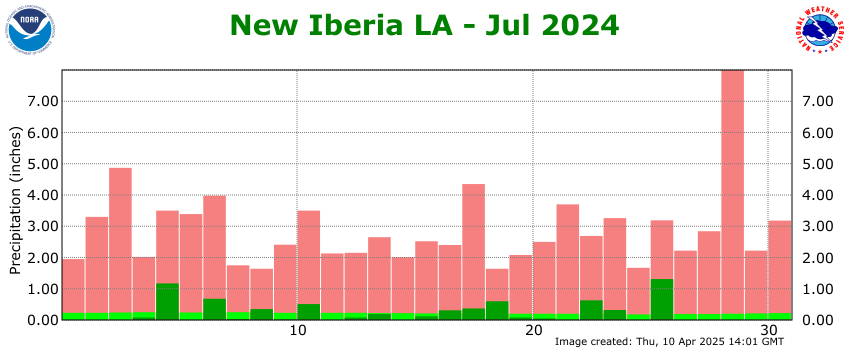
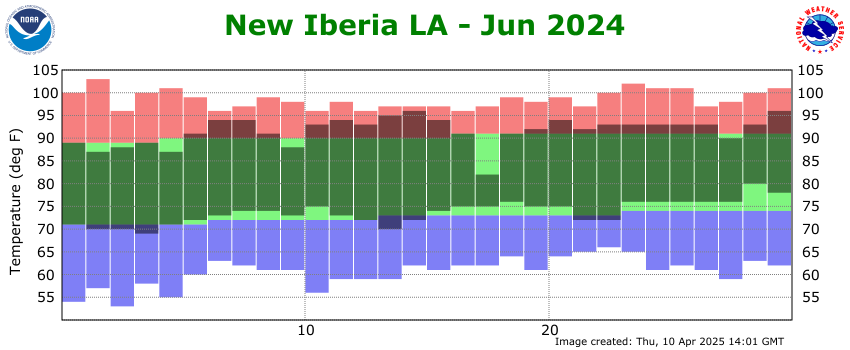
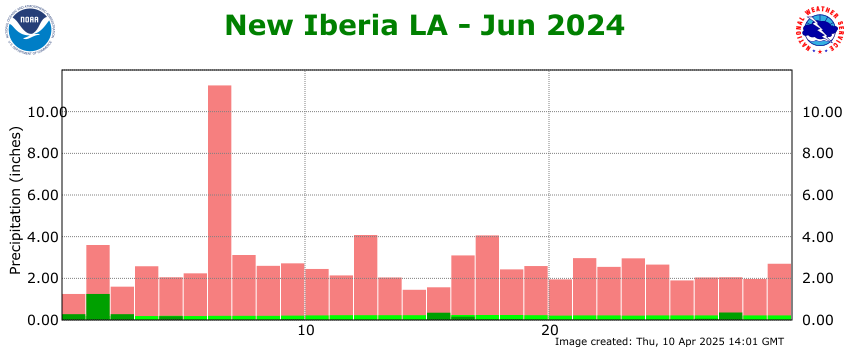
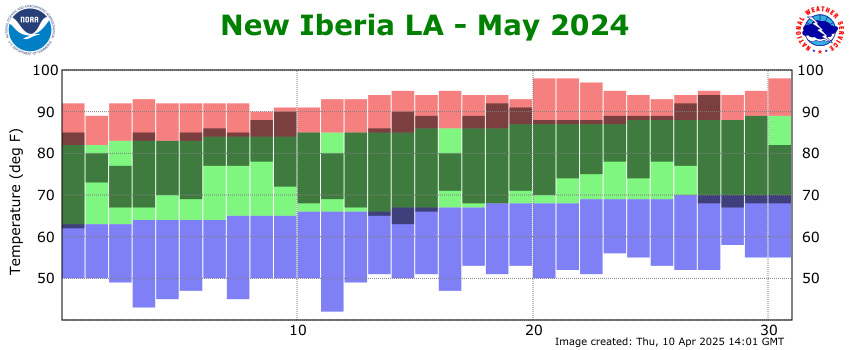
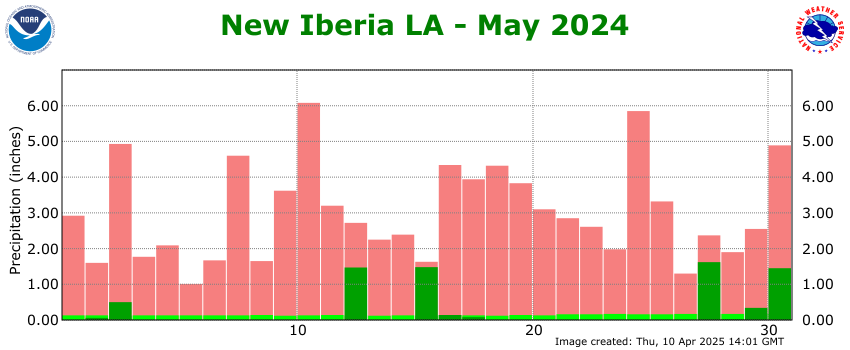
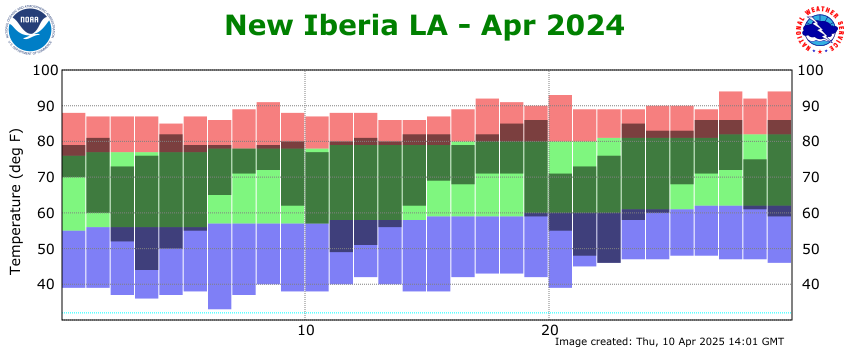
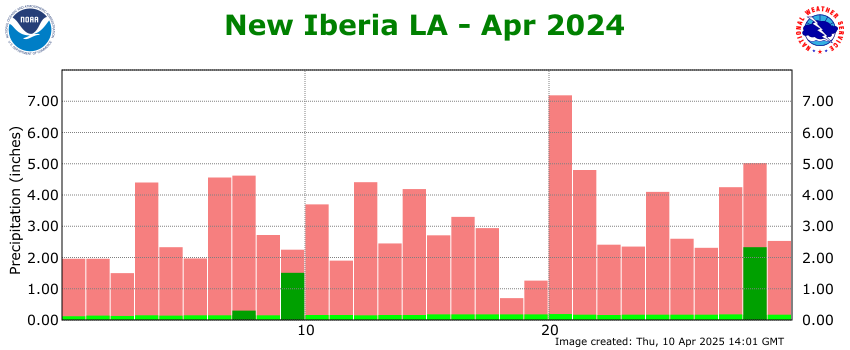
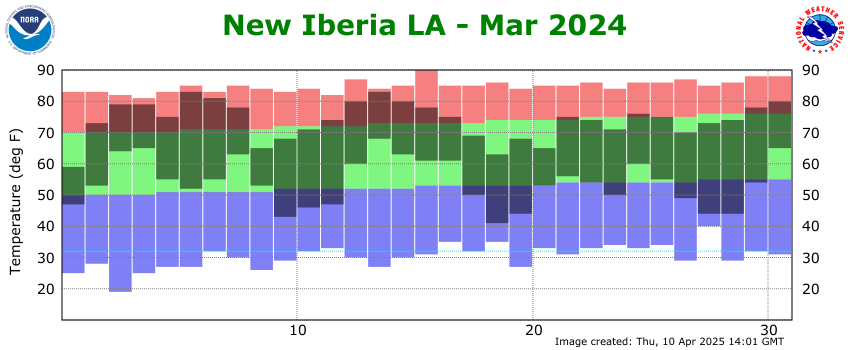
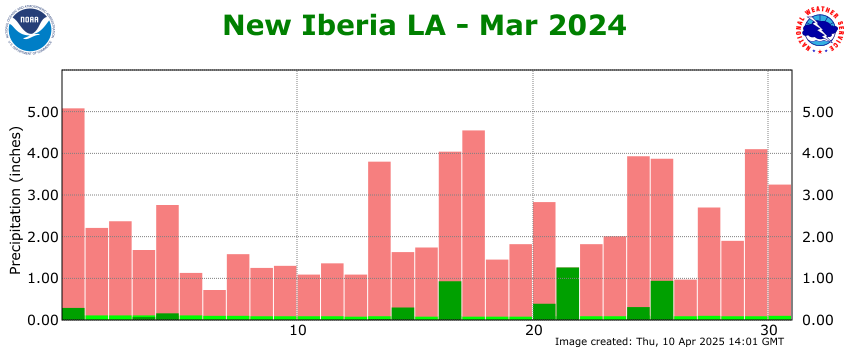
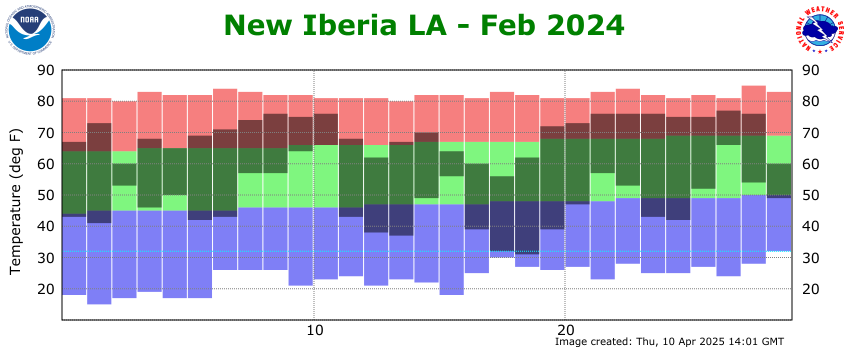
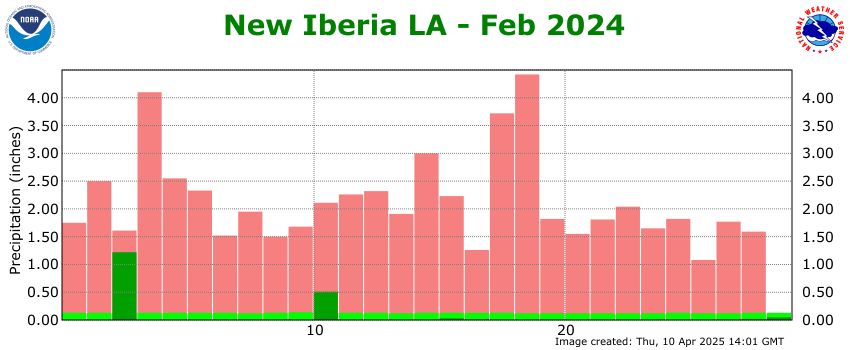
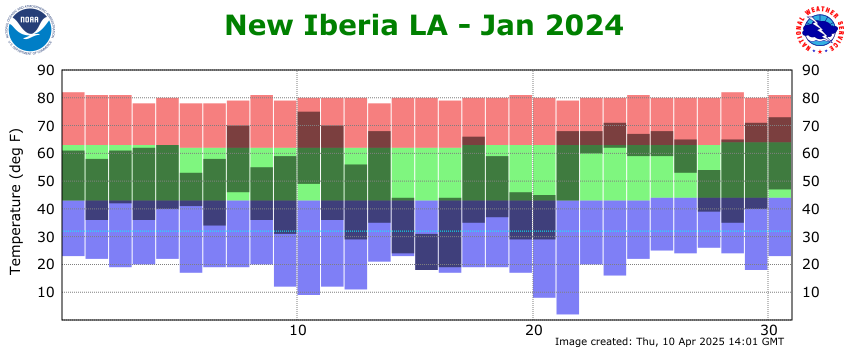
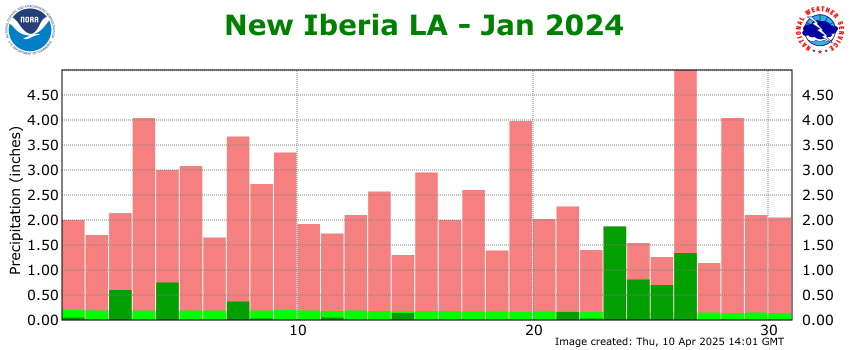
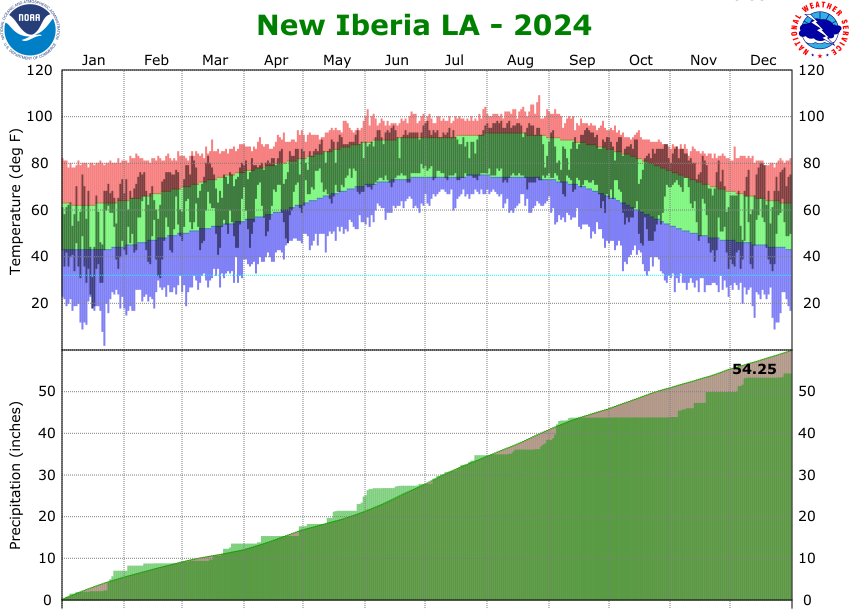
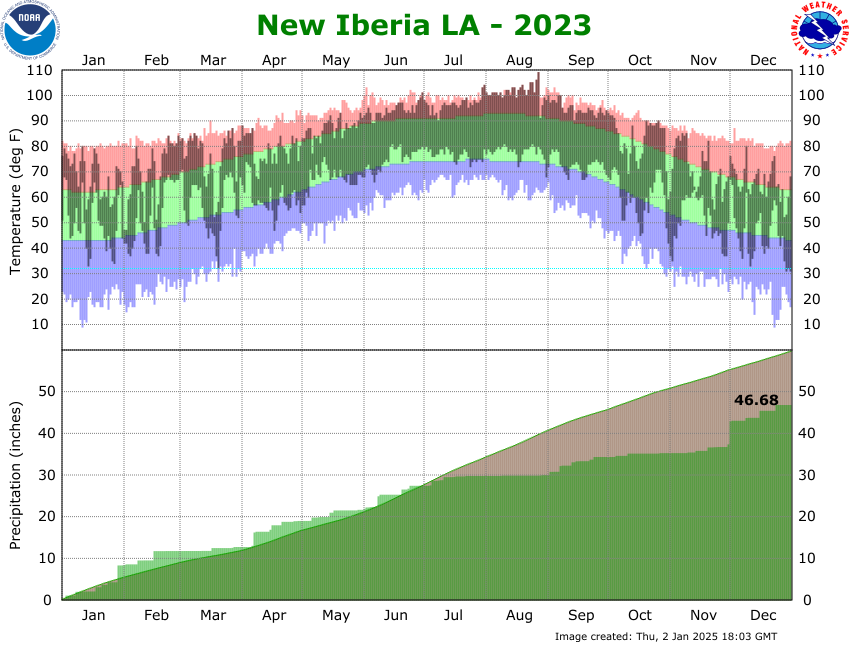
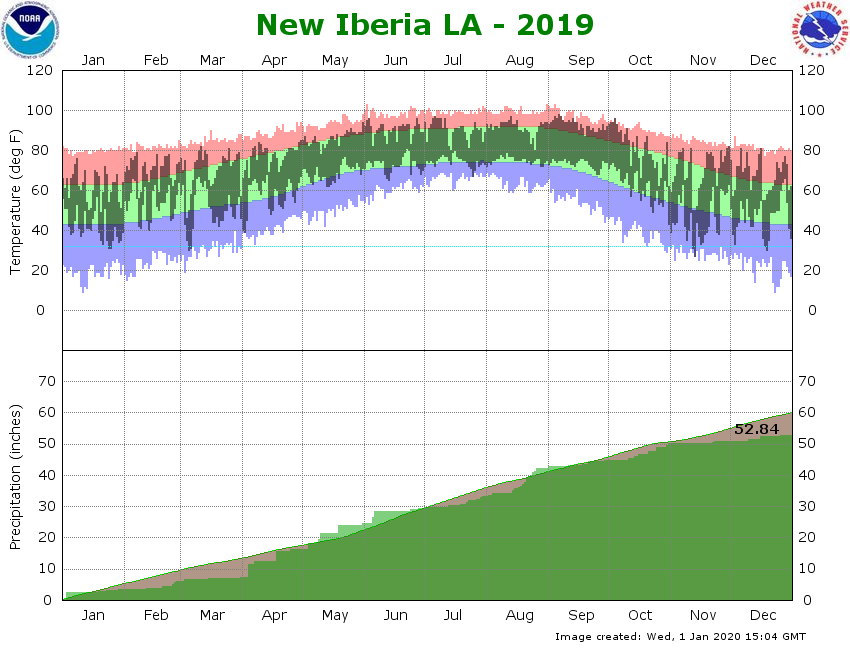
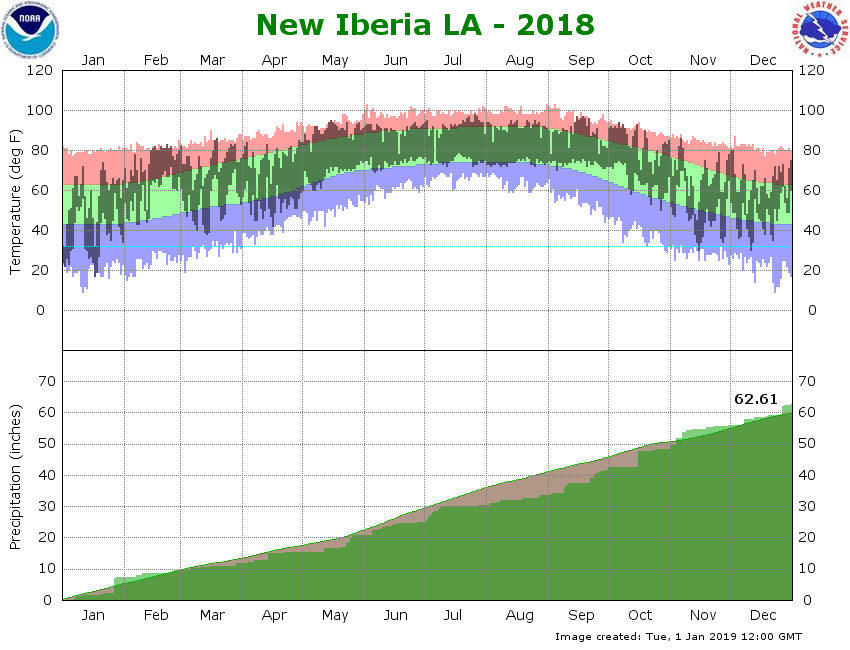
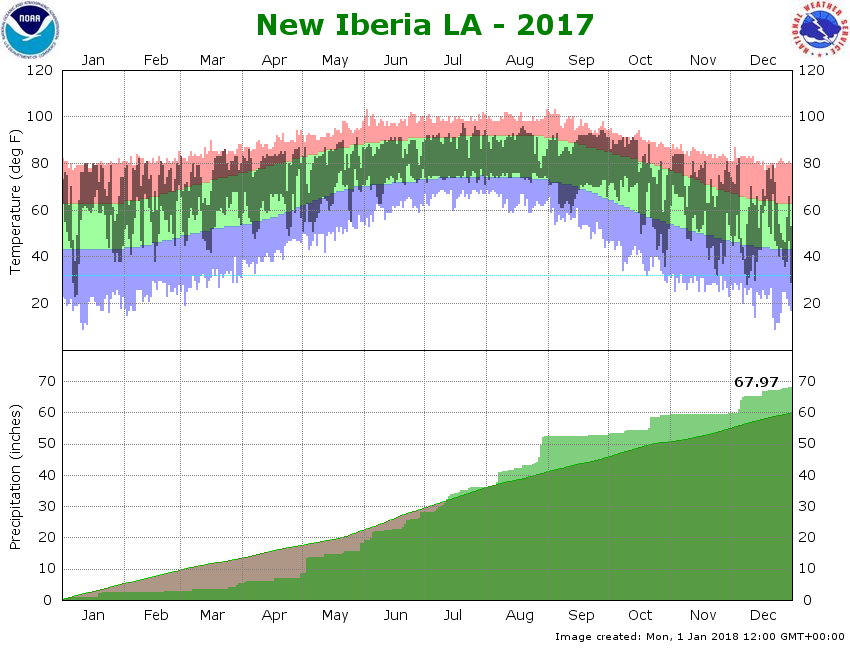
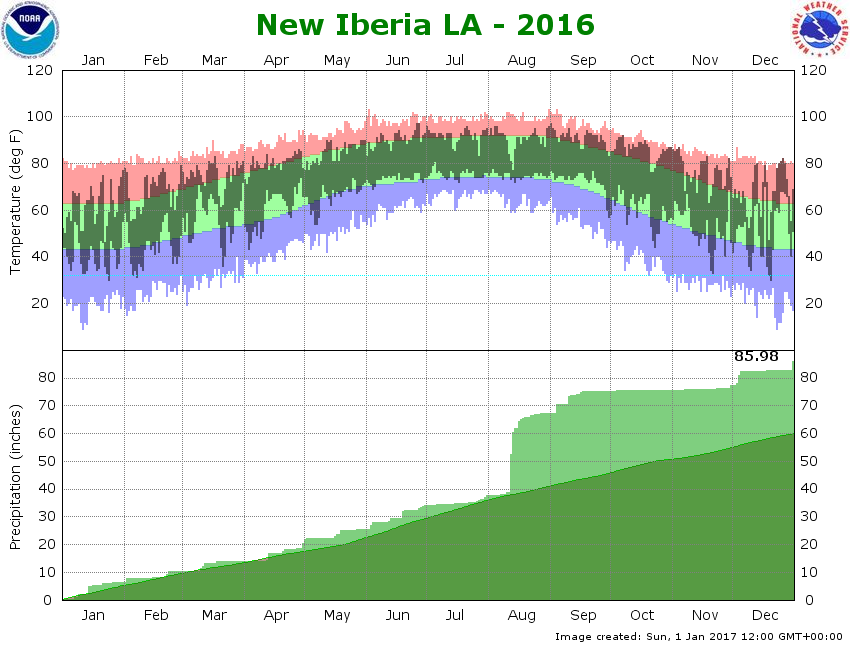
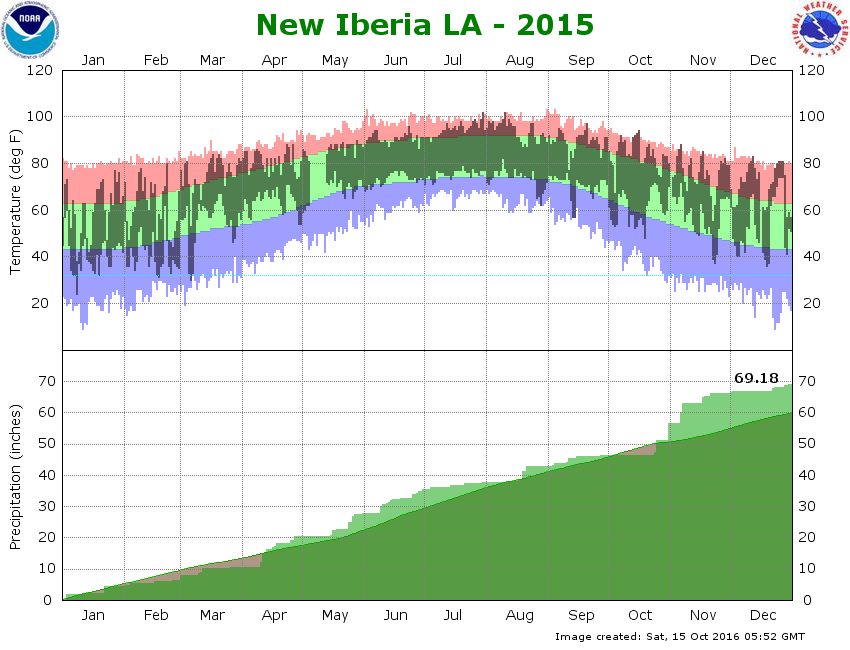
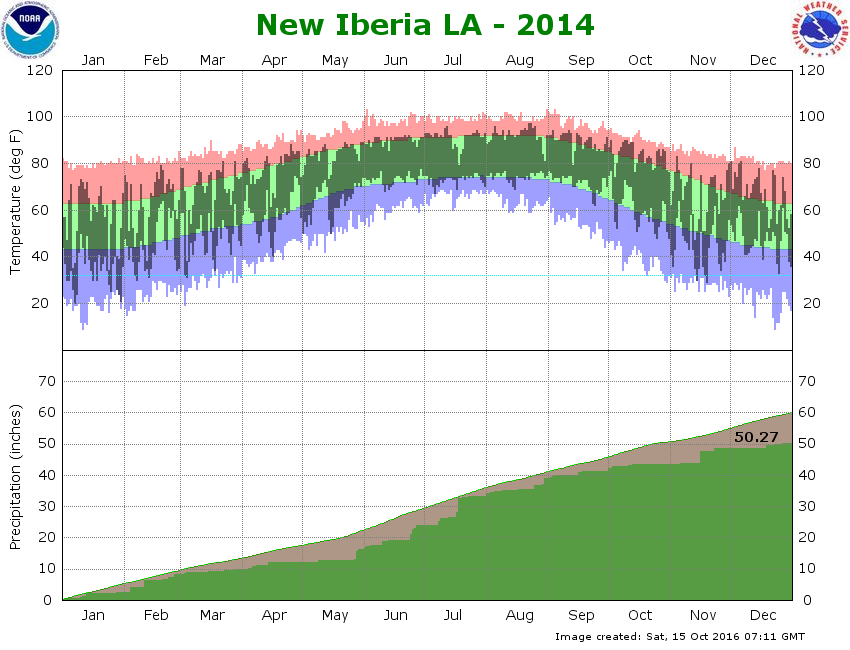
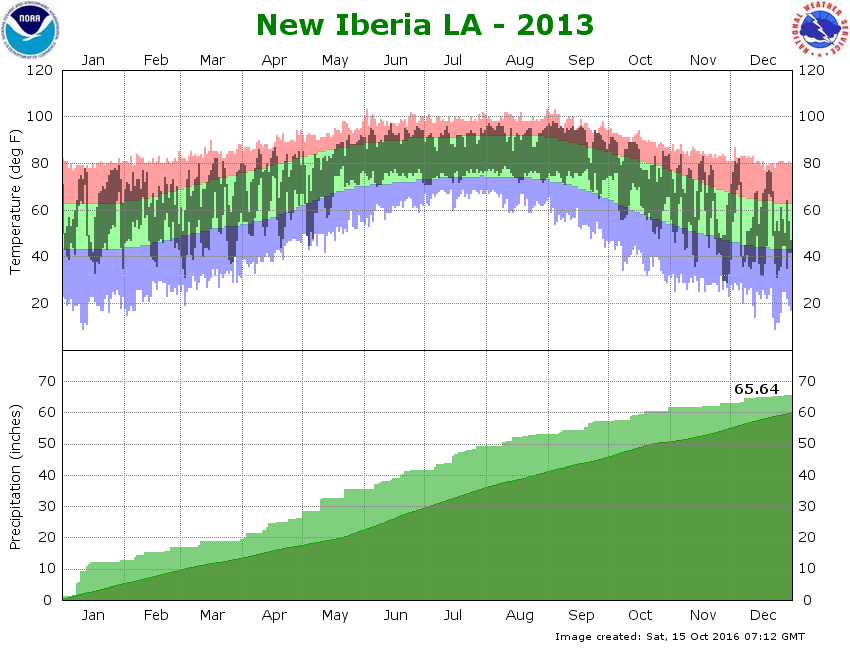
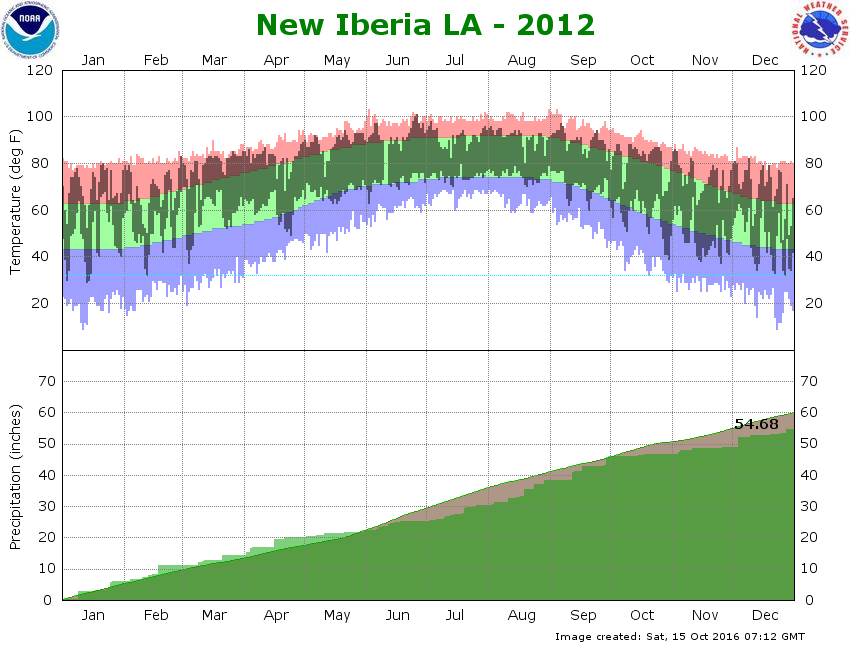
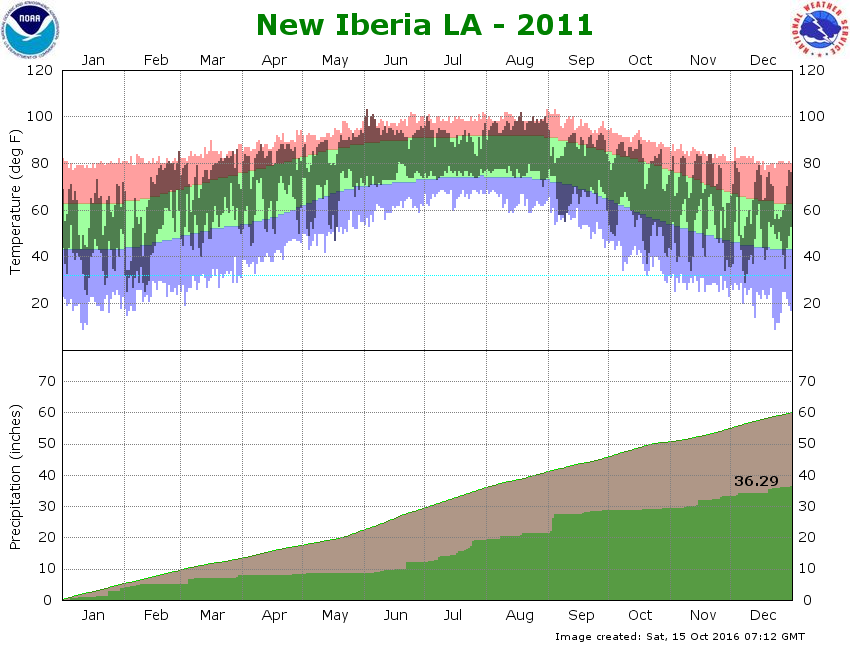
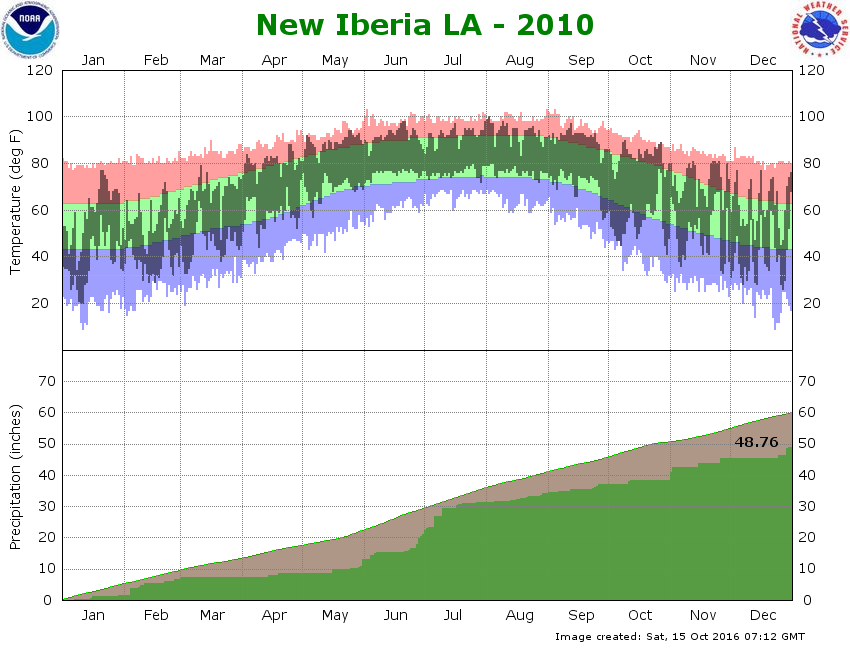
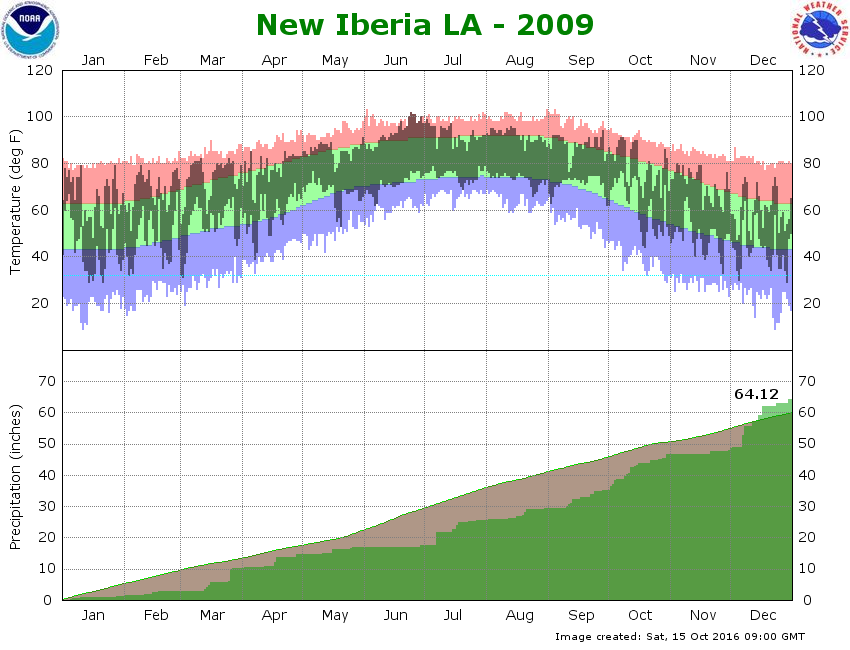
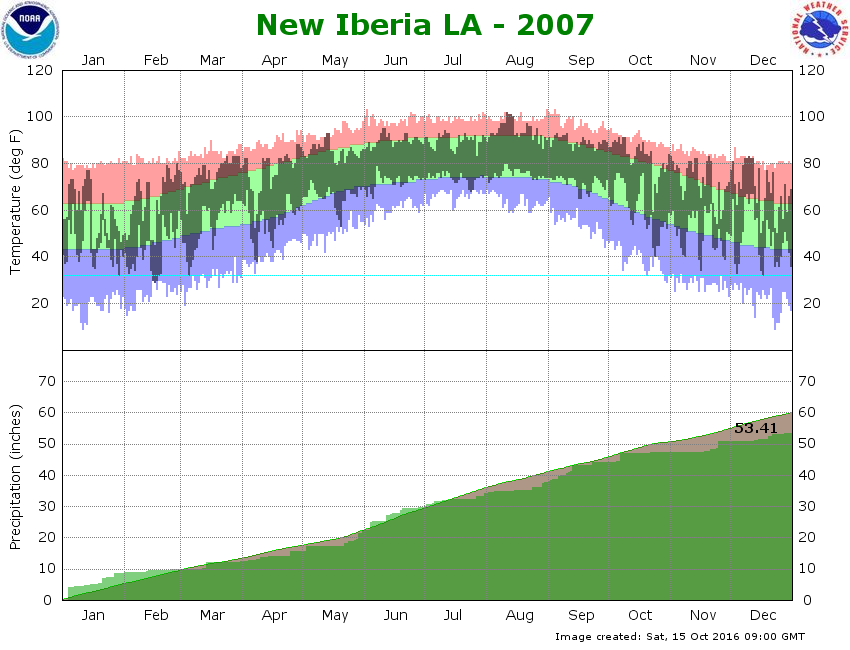
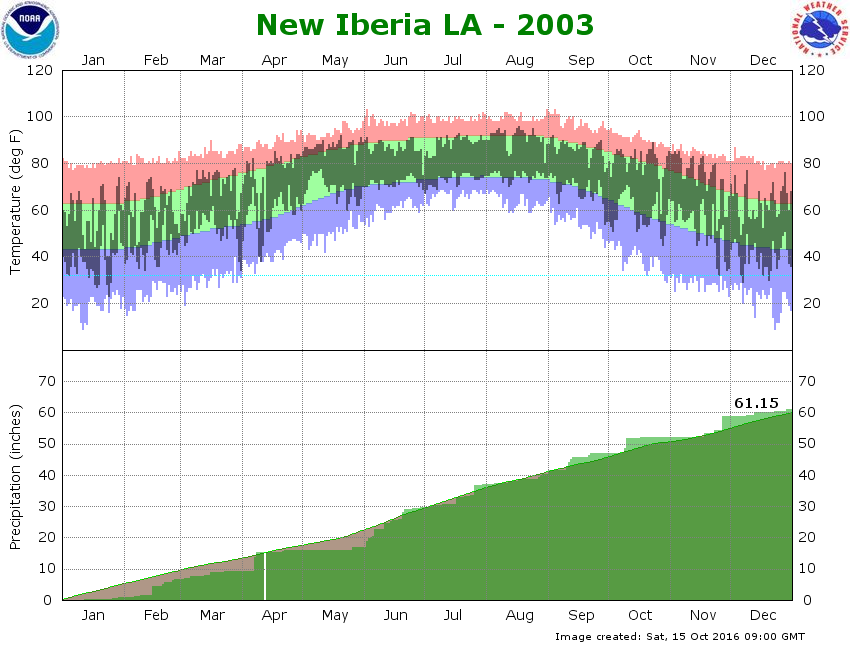
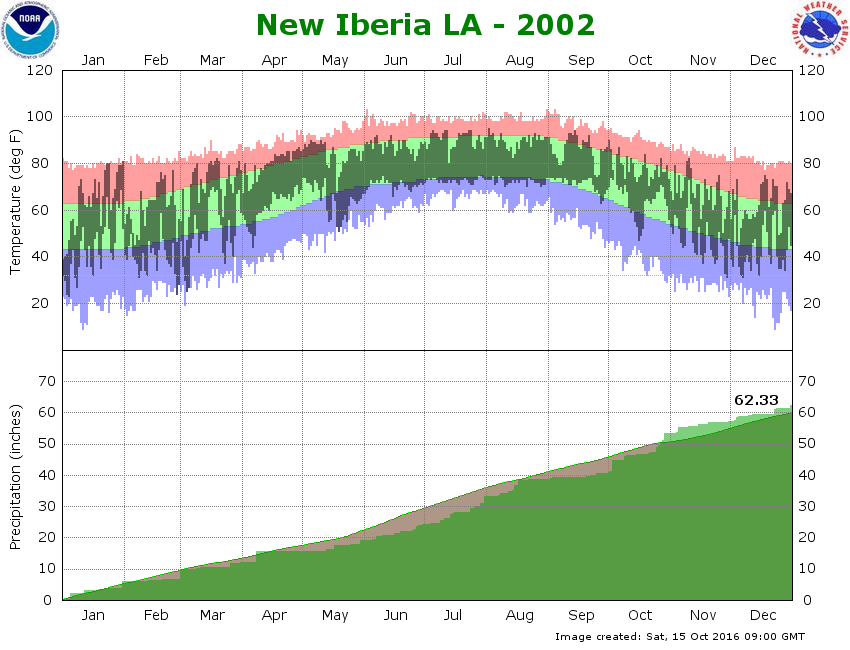
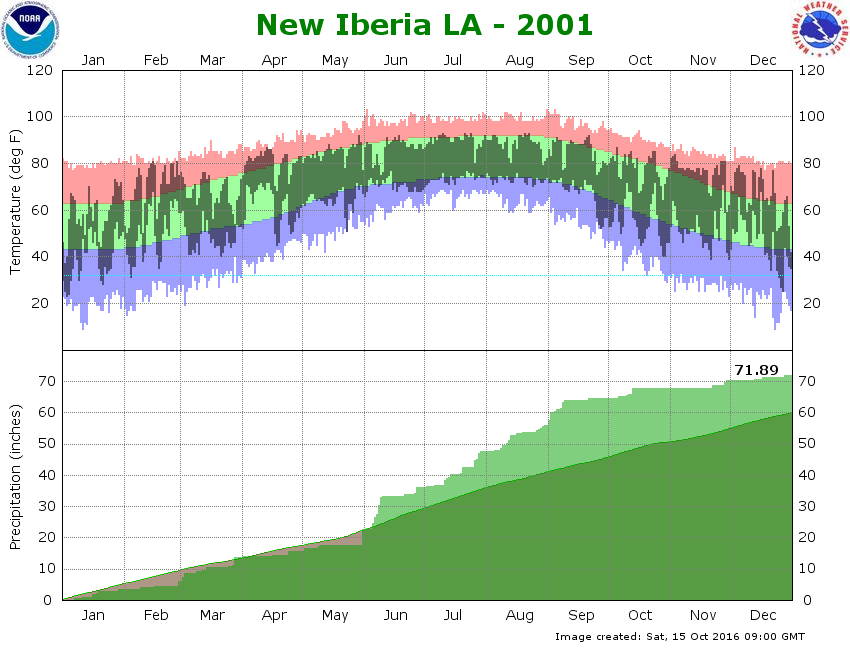
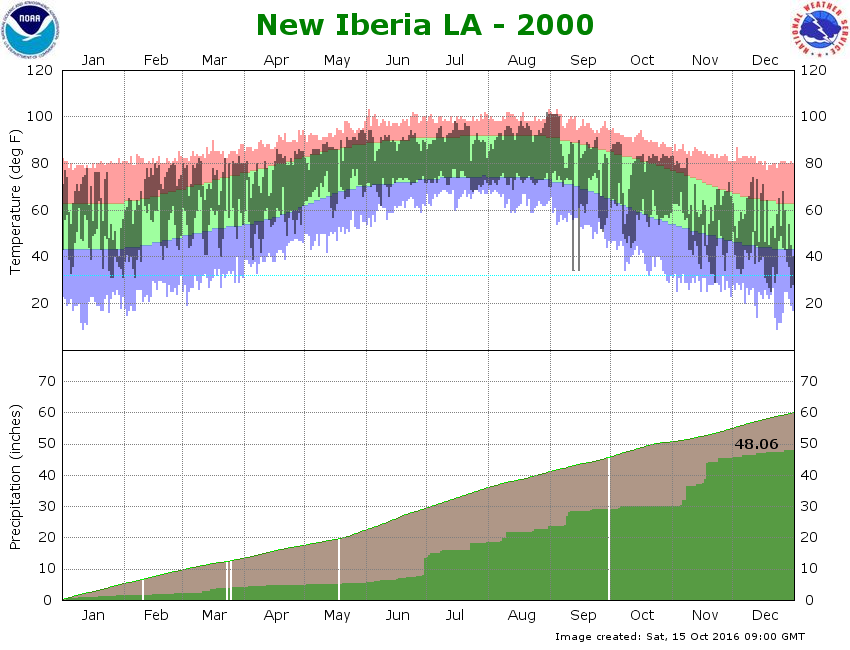
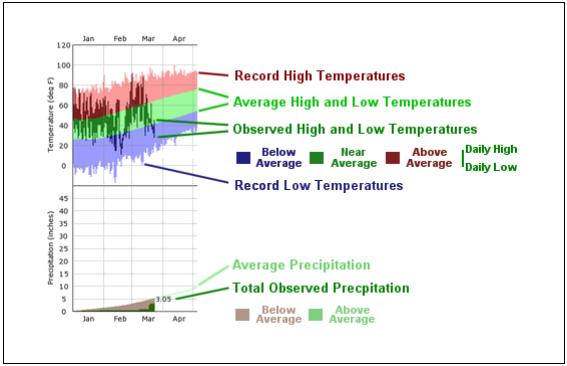
Current Climate Graphs for New Iberia
 

Temperature plot for current month
Precipitation plot for current month

Temperature and precipitation plots for current year
 
Temperature and precipitation plot for current year


Temperature and precipitation plots for previous months
 
Temperature plot for previous month
Precipitation plot for previous month  
Temperature plot for previous month
Precipitation plot for previous month
Temperature plot for previous month
Precipitation plot for previous month
Snowfall plot for previous month
 
Temperature plot for previous month
Precipitation plot for previous month
 
Temperature plot for previous month
Precipitation plot for previous month
 
Temperature plot for previous month
Precipitation plot for previous month
 
Temperature plot for previous month
Precipitation plot for previous month
 
Temperature plot for previous month
Precipitation plot for previous month
 
Temperature plot for previous month
Precipitation plot for previous month
 
Temperature plot for previous month
Precipitation plot for previous month
 
Temperature plot for previous month
Precipitation plot for previous month
 
Temperature plot for previous month
Precipitation plot for previous month
 
Temperature plot for previous monthPrecipitation plot for previous month

Temperature plot for previous month
Precipitation plot for previous month
 
Temperature plot for previous month
Precipitation plot for previous month

Temperature and precipitation plots for previous years
 
Temperature and precipitation plot for 2024
 
Temperature and precipitation plot for 2023
 
Temperature and precipitation plot for 2019
 
Temperature and precipitation plot for 2018
 
Temperature and precipitation plot for 2017
 
Temperature and precipitation plot for 2016
 
Temperature and precipitation plot for 2015
 
Temperature and precipitation plot for 2014
 
Temperature and precipitation plot for 2013
 
Temperature and precipitation plot for 2012
 
Temperature and precipitation plot for 2011
 
Temperature and precipitation plot for 2010
 
Temperature and precipitation plot for 2009
 
Temperature and precipitation plot for 2008
 
Temperature and precipitation plot for 2007
 
Temperature and precipitation plot for 2006
 
Temperature and precipitation plot for 2005
 
Temperature and precipitation plot for 2004
 
Temperature and precipitation plot for 2003
 
Temperature and precipitation plot for 2002
 
Temperature and precipitation plot for 2001
 
Temperature and precipitation plot for 2000
Climate Graph Legend