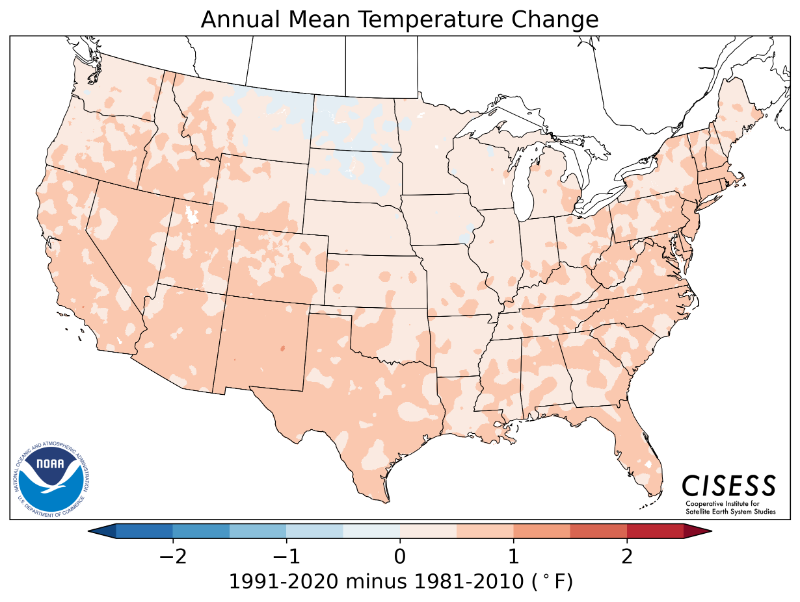
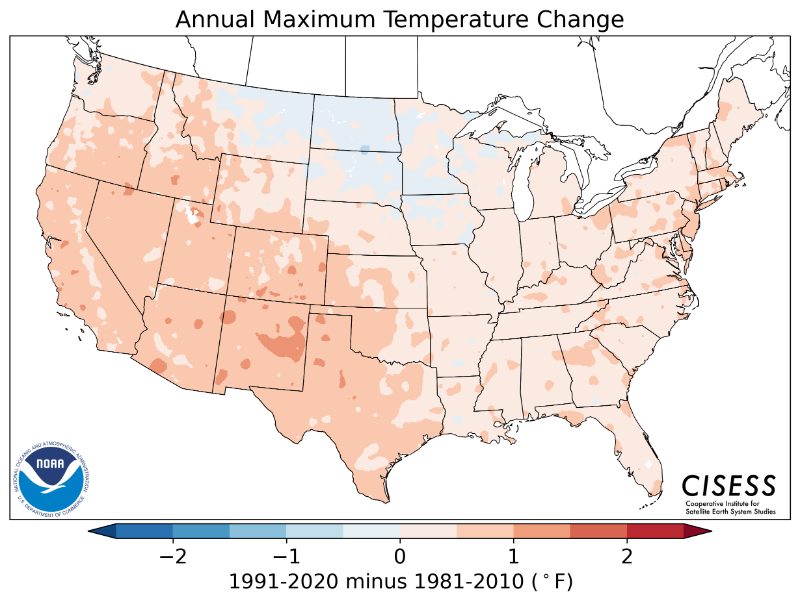
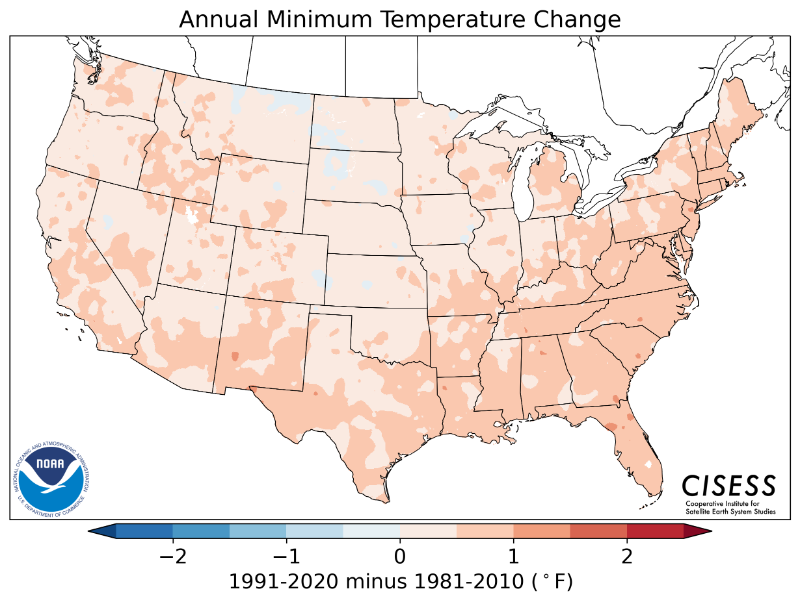
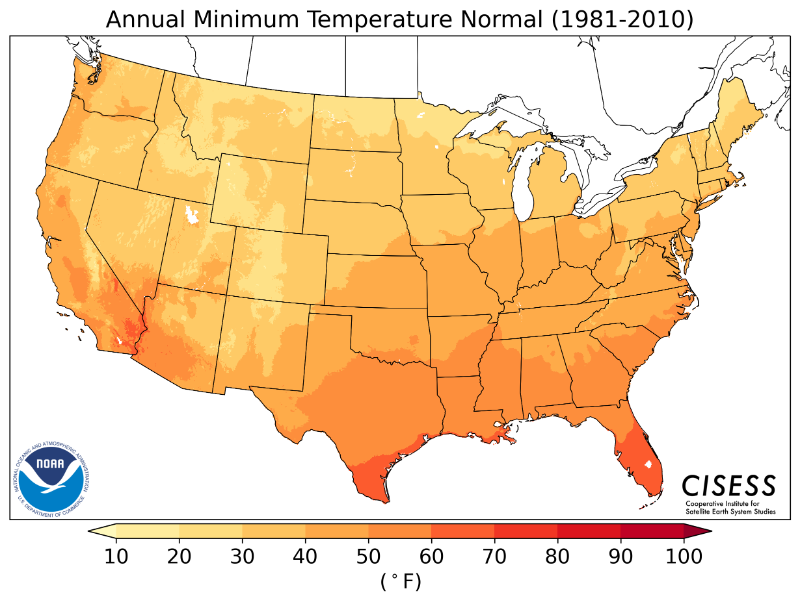
In the United States new 30-year normals are calculated every ten years. The most recent normals (using 1991-2020 data) are listed below, along with the previous set of normals (from 1981-2010), and the difference between the two normals packages. Click on the images to see larger versions.
Or, click here to see comparisons between the new normals and the previous (1981-2010) set of normals in graphical format for local cities (BWG, FFT, LEX, SDF, LOU).
TEMPERATURE
| ANNUAL | ||||||||
| 1991-2020 | Difference Between Old and New | 1981-2010 | ||||||
| Mean | Maximum | Minimum | Mean | Maximum | Minimum | Mean | Maximum | Minimum |
 |
 |
 |
 |
 |
 |
 |
 |
 |
| SEASONAL | |||||||||
| 1991-2020 | Difference Between Old and New | 1981-2010 | |||||||
| Mean | Maximum | Minimum | Mean | Maximum | Minimum | Mean | Maximum | Minimum | |
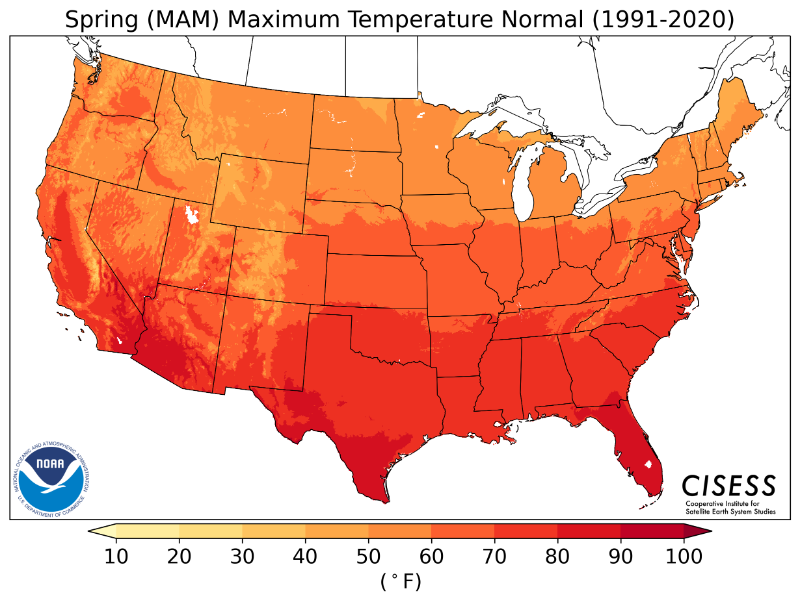
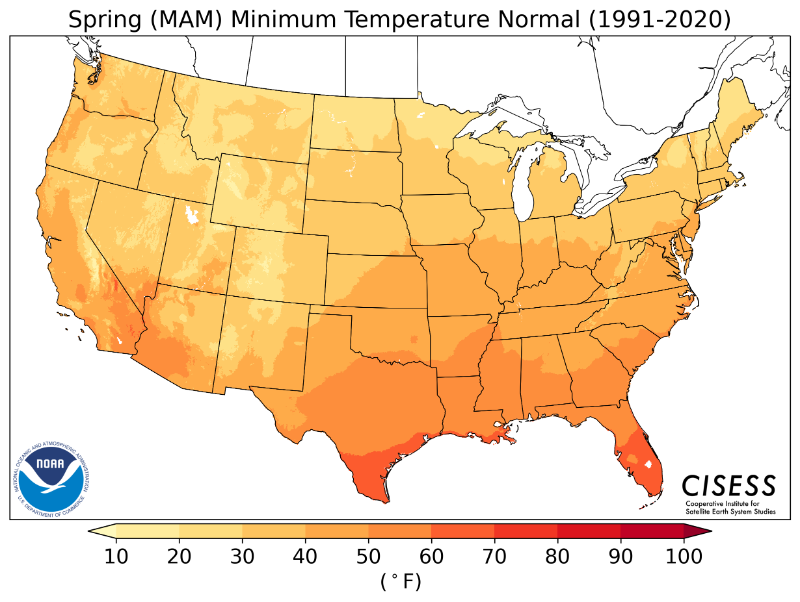
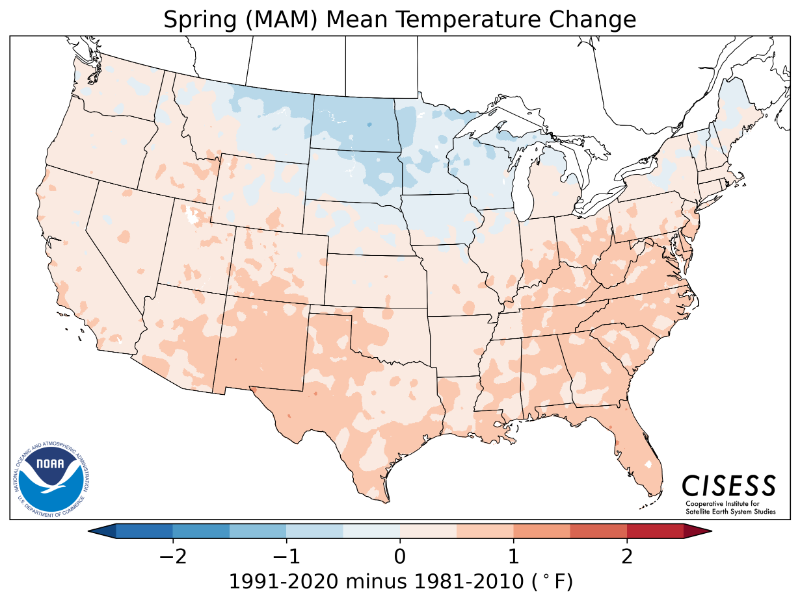
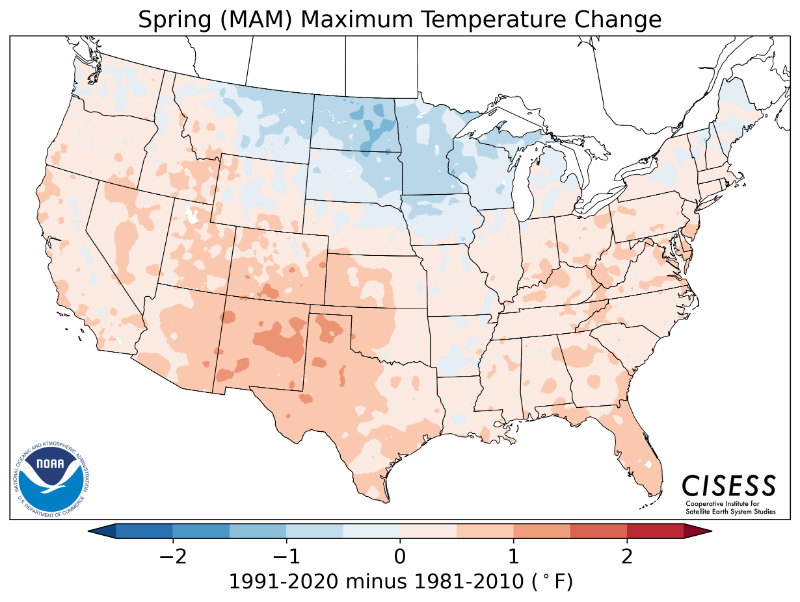
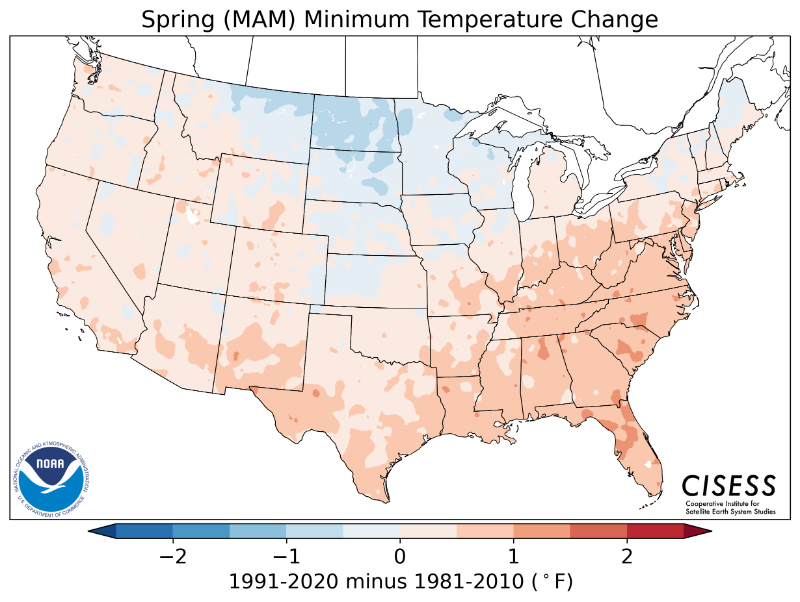
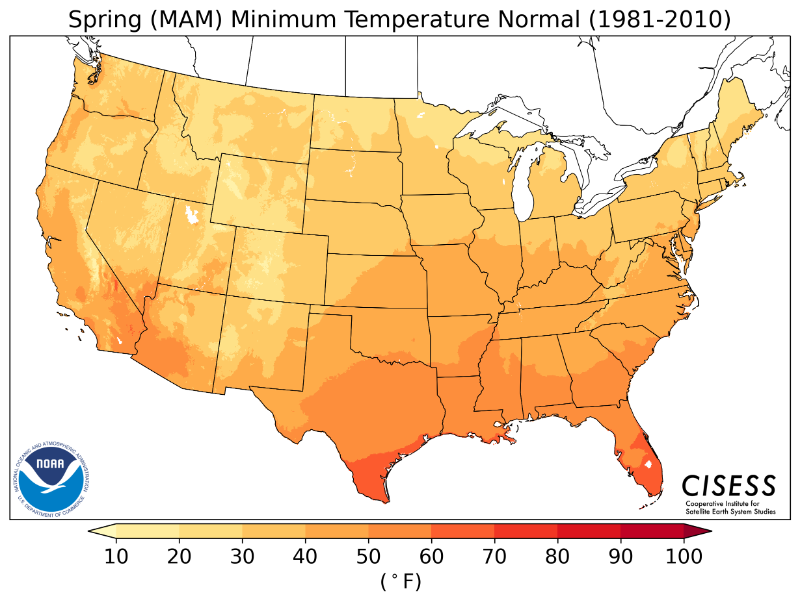
| Spring | 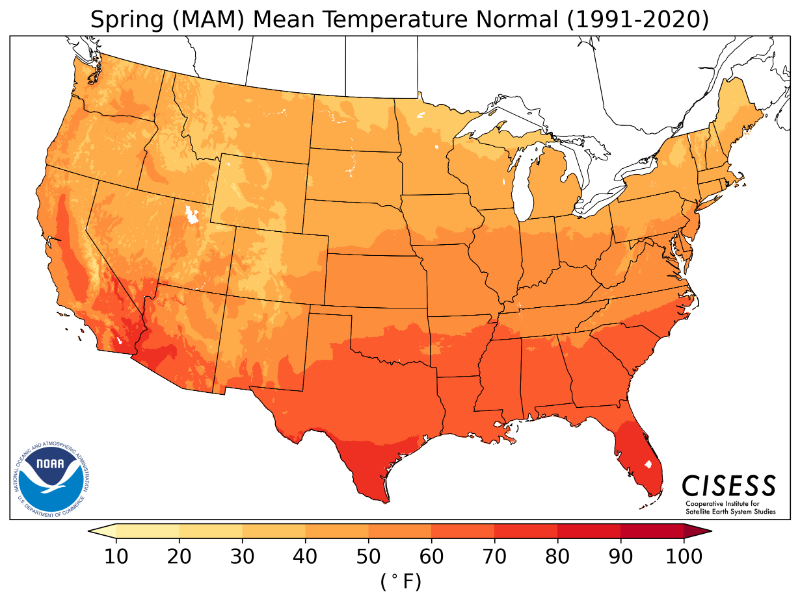 |
 |
 |
 |
 |
 |
 |
 |
 |
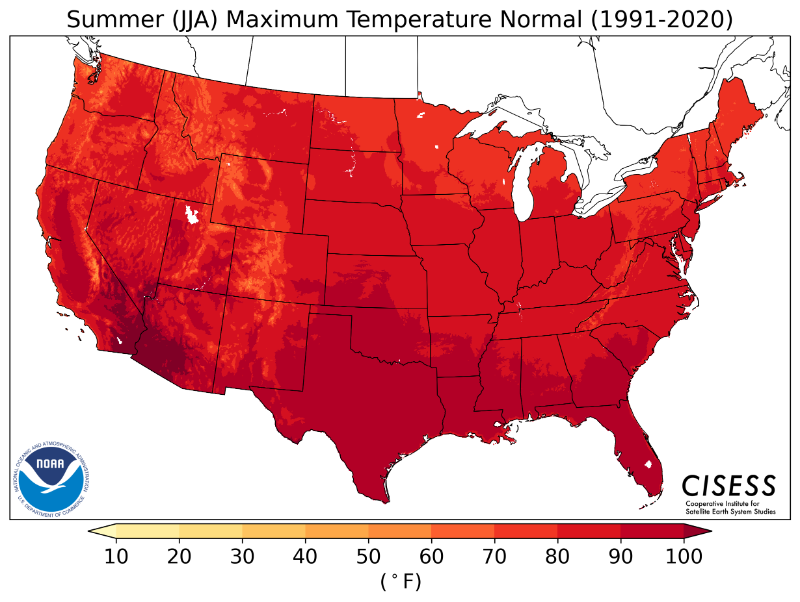
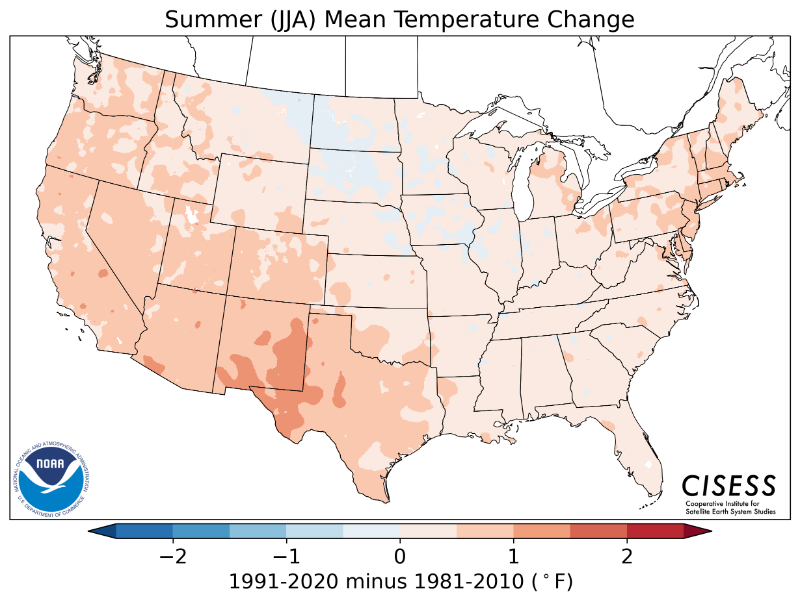
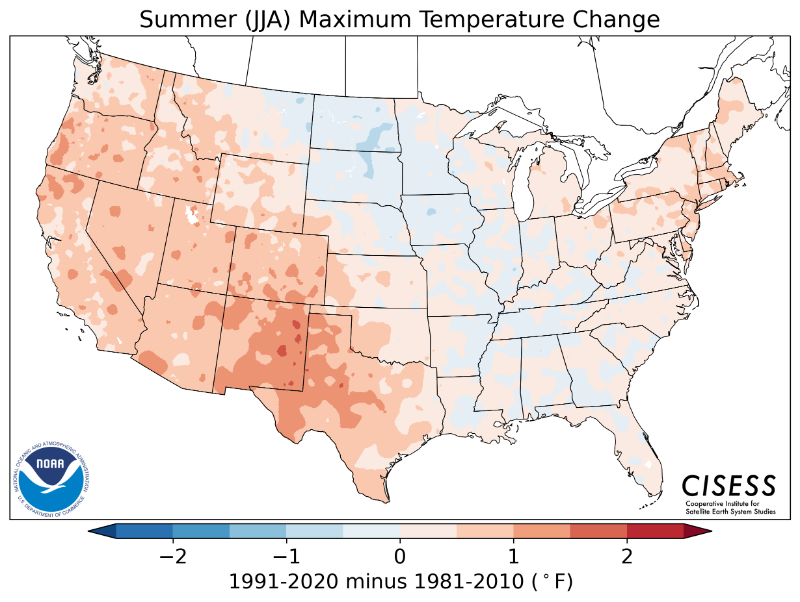
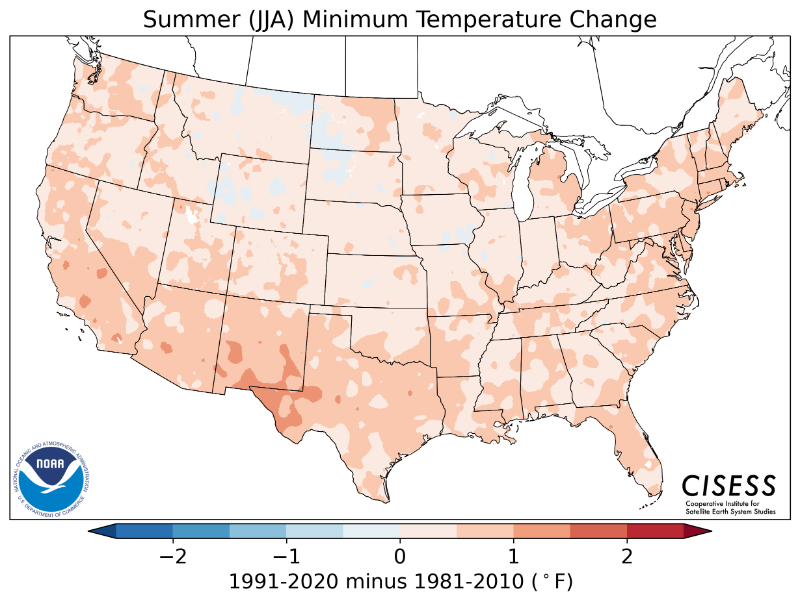
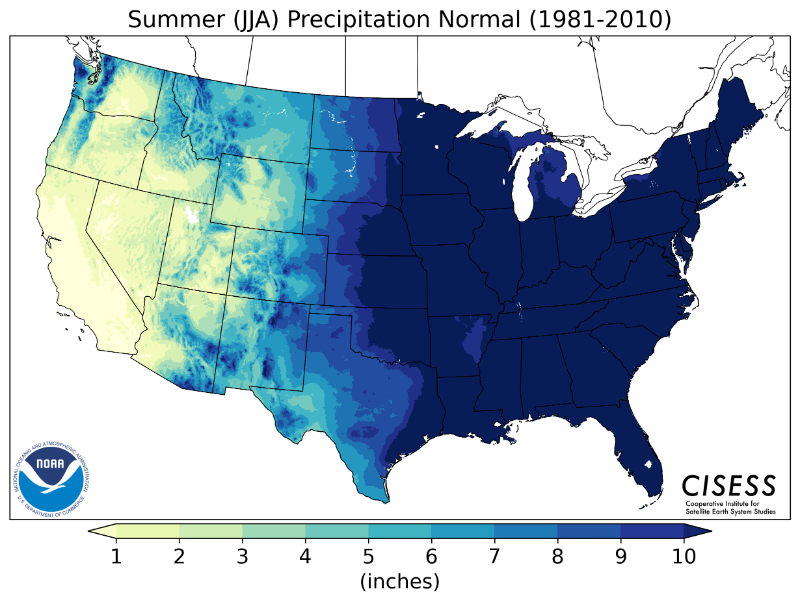
| Summer |  |
 |
 |
 |
 |
 |
 |
 |
 |
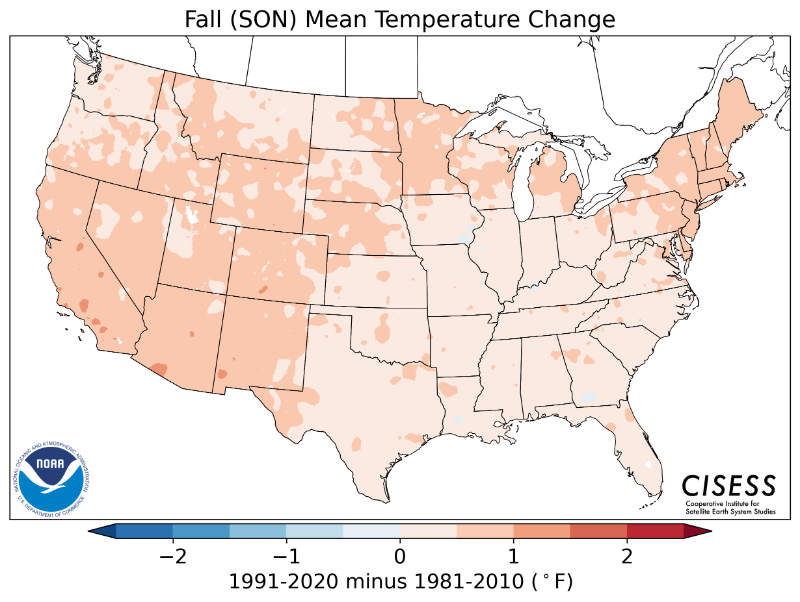
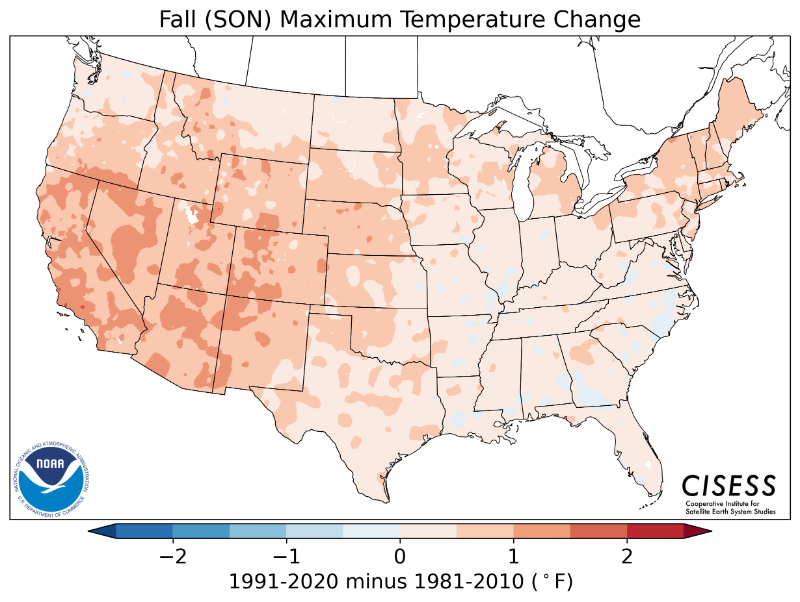
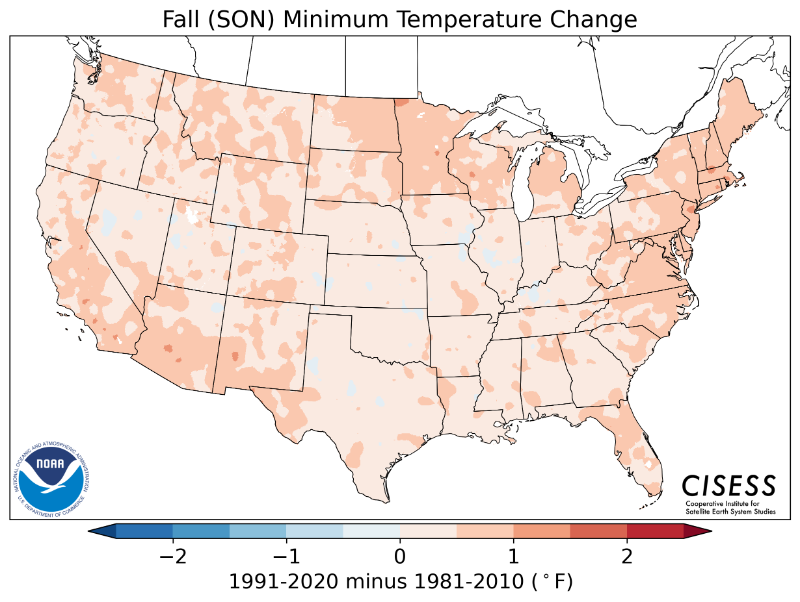
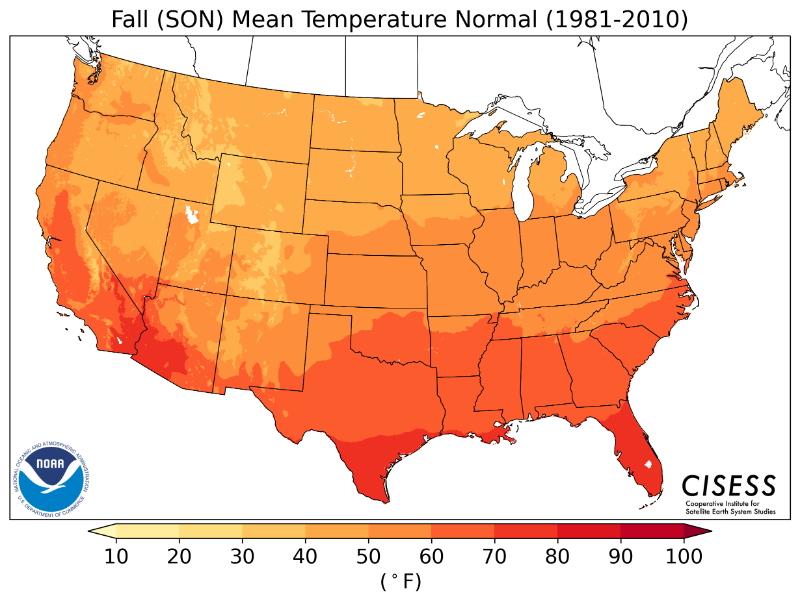
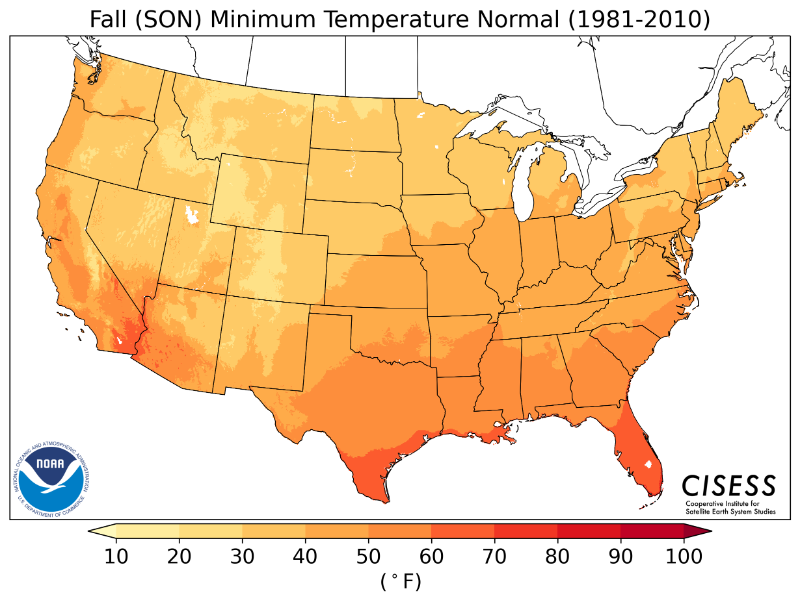
| Autumn |  |
 |
 |
 |
 |
 |
 |
 |
 |
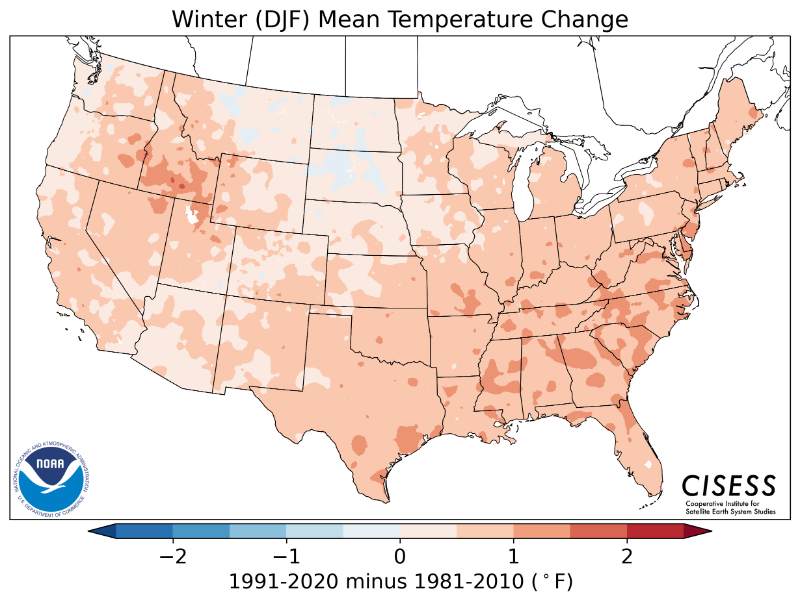
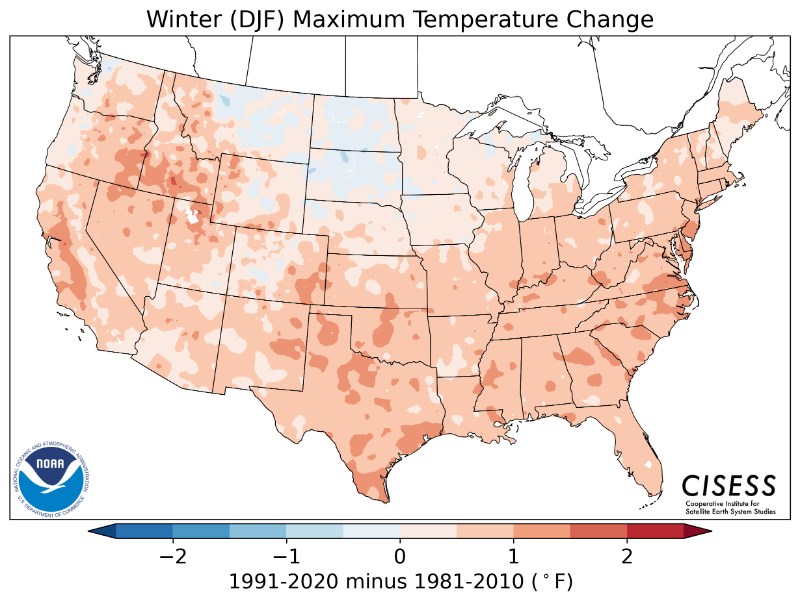
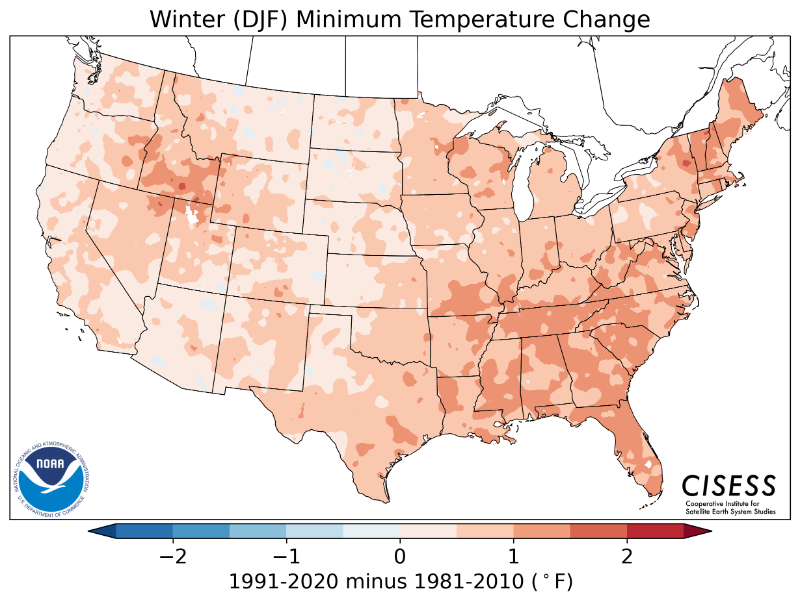
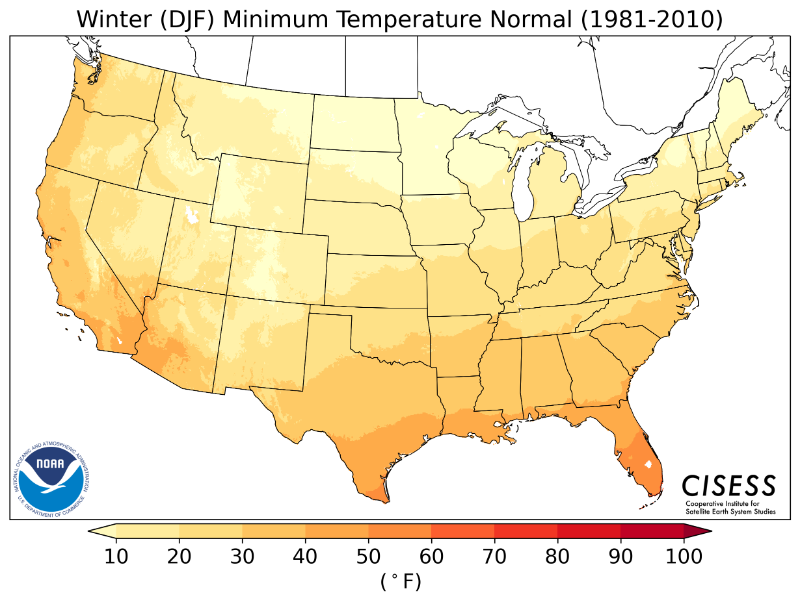
| Winter |  |
 |
 |
 |
 |
 |
 |
 |
 |
| MONTHLY | |||||||||
| 1991-2020 | Difference Between Old and New | 1981-2010 | |||||||
| Mean | Maximum | Minimum | Mean | Maximum | Minimum | Mean | Maximum | Minimum | |
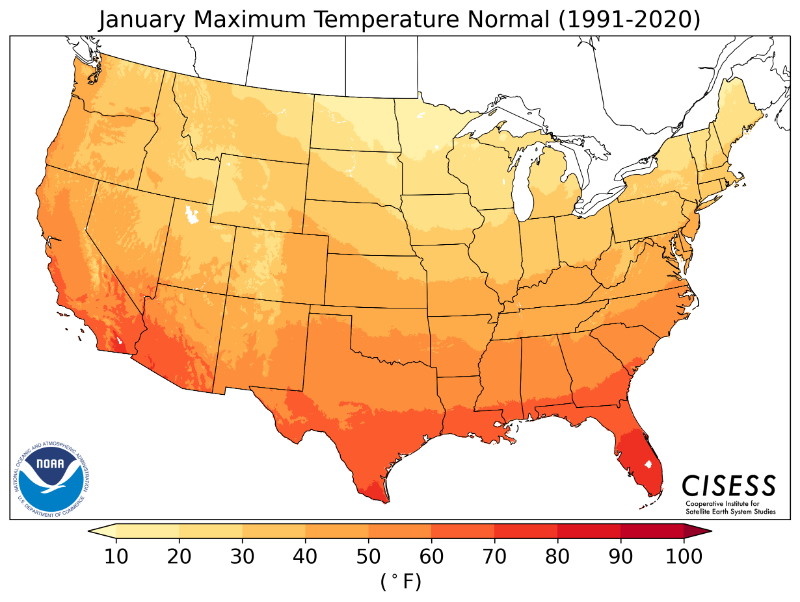
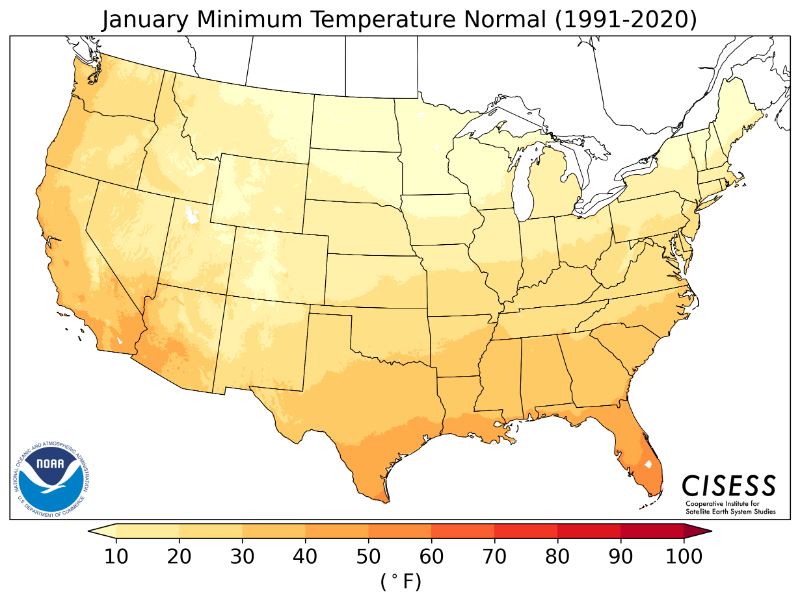
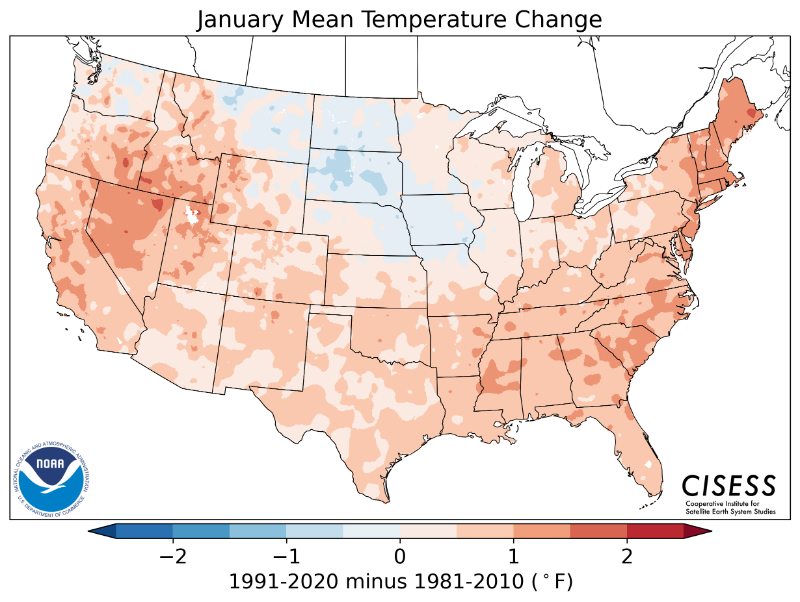
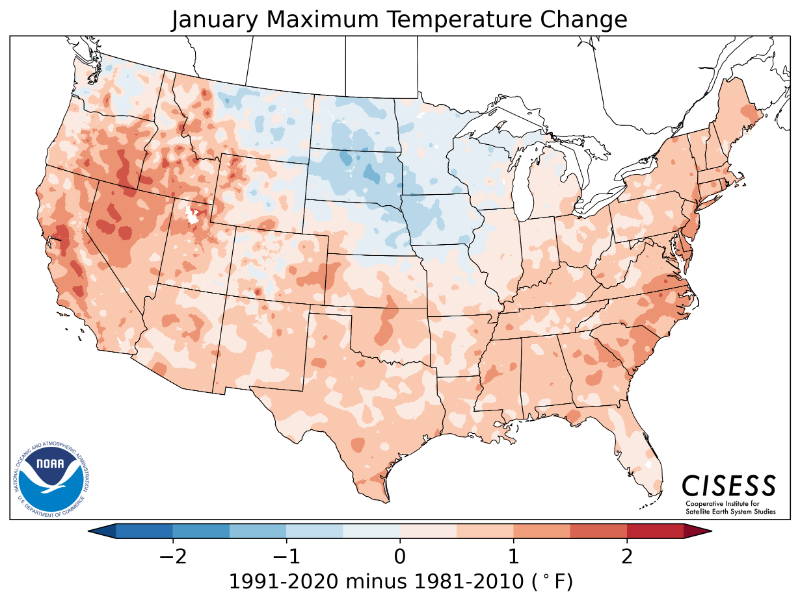
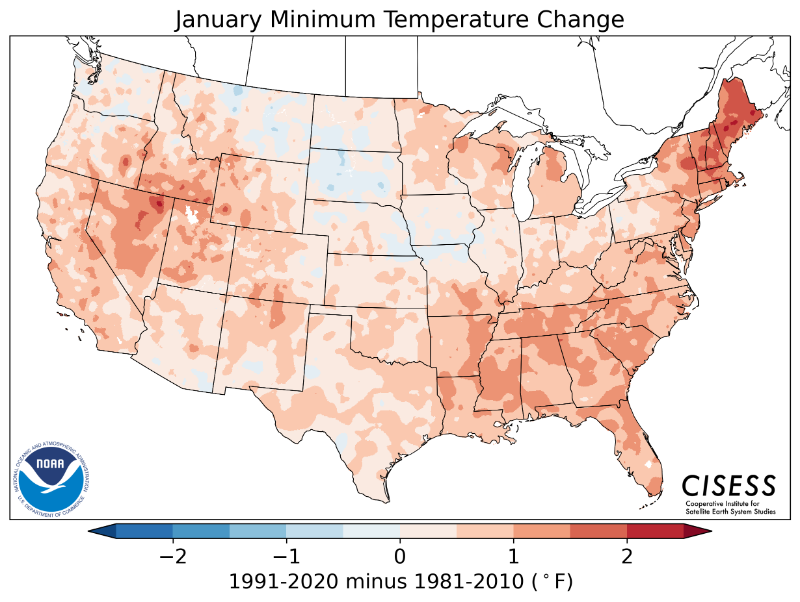
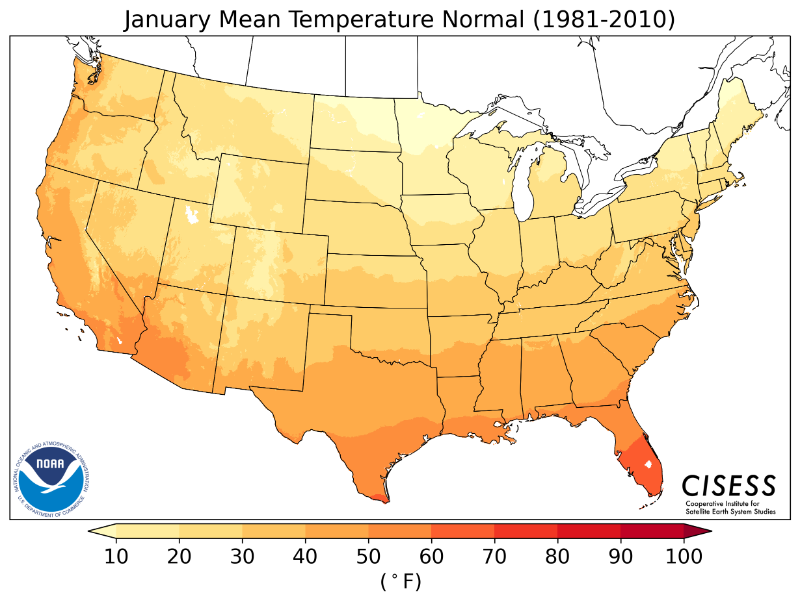
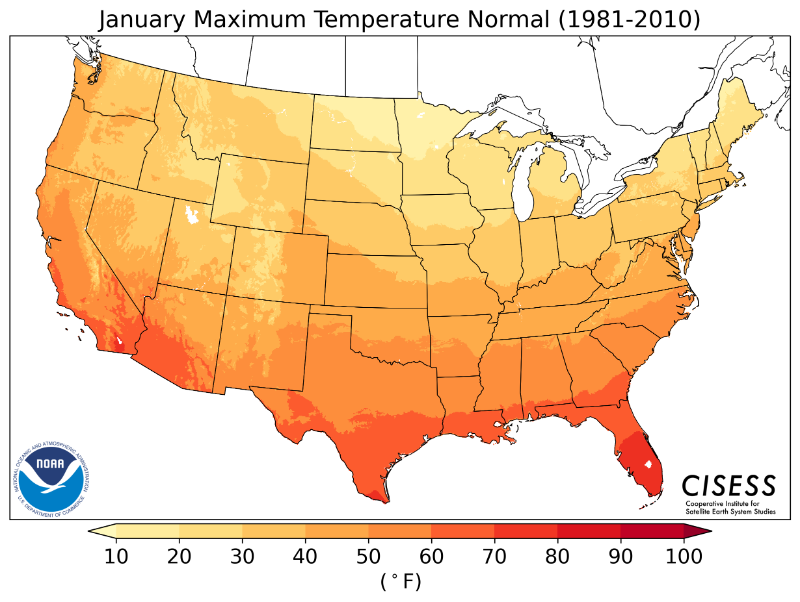
| January | 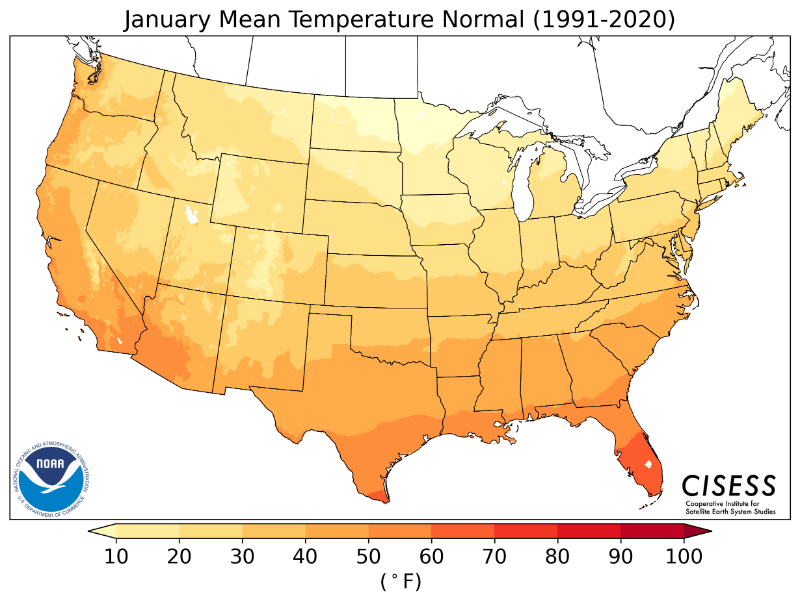 |
 |
 |
 |
 |
 |
 |
 |
 |
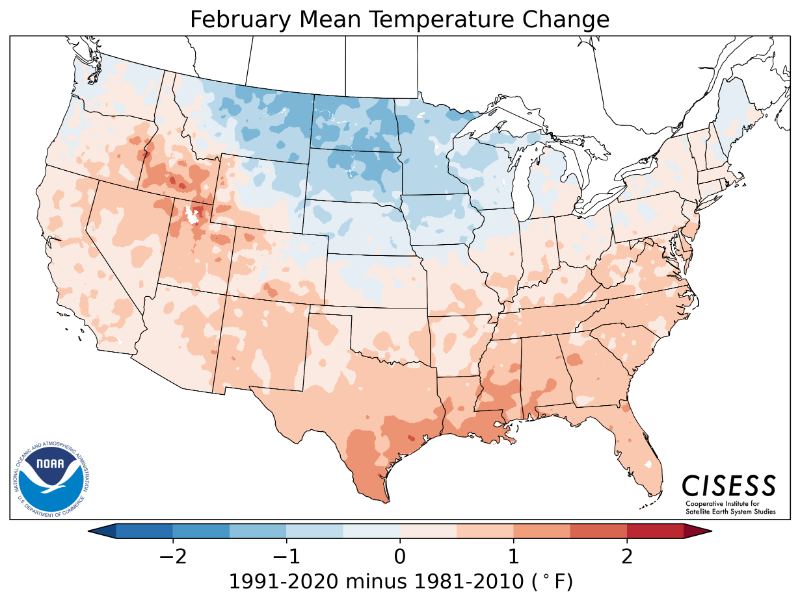
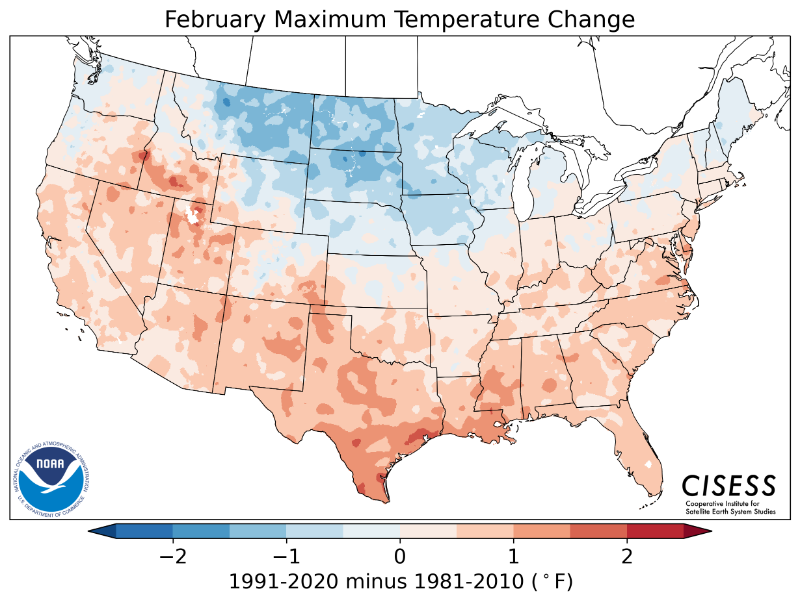
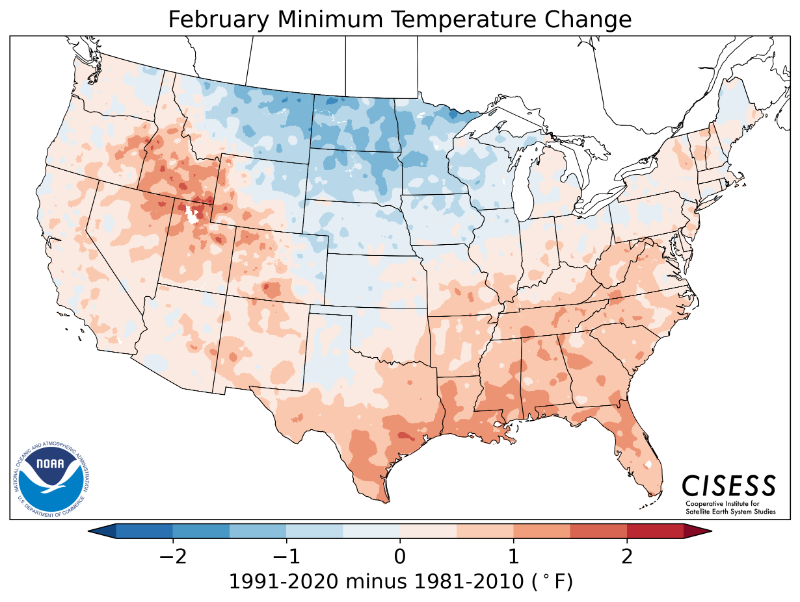
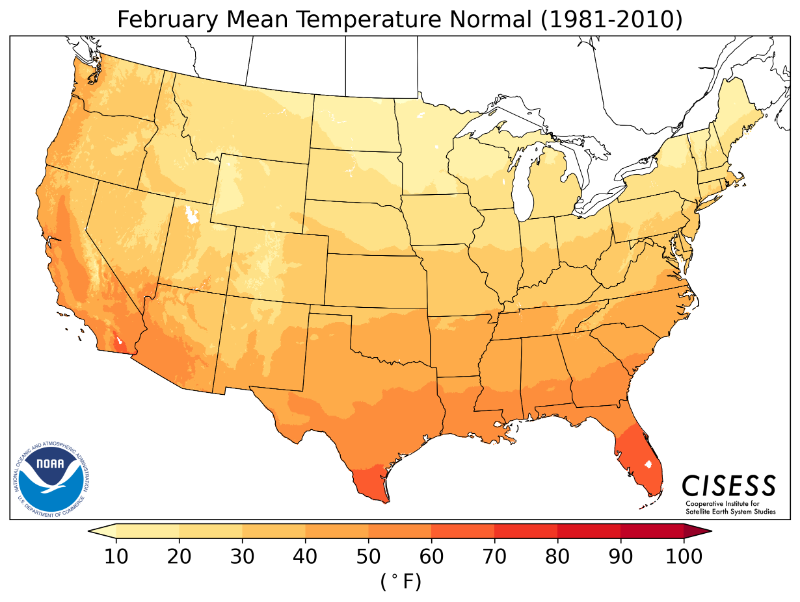
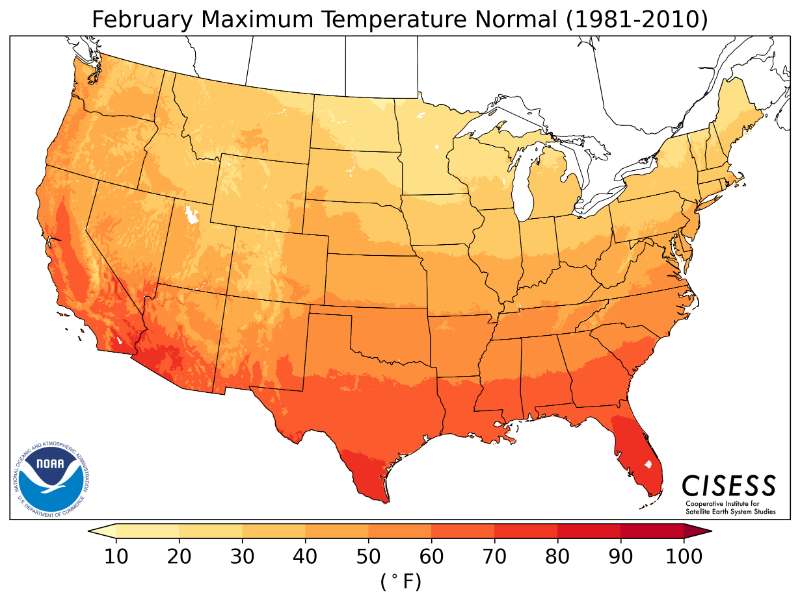
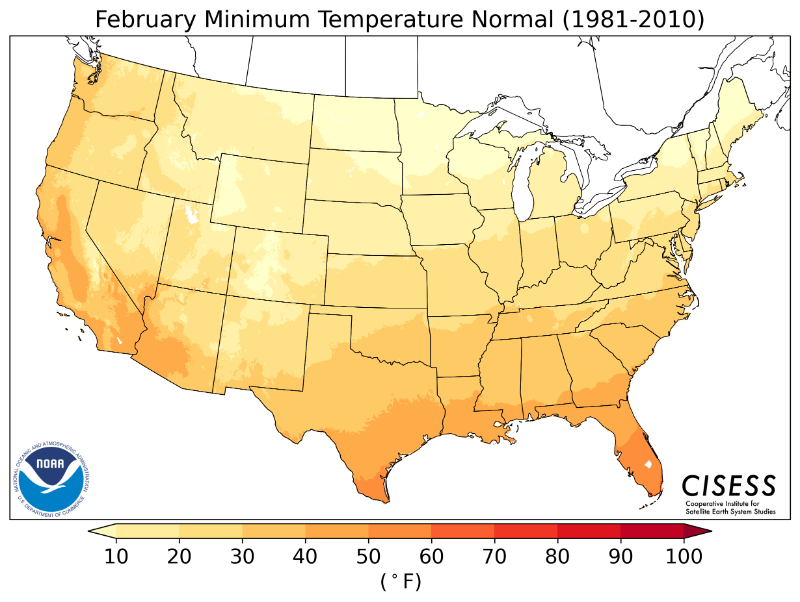
| February |  |
 |
 |
 |
 |
 |
 |
 |
 |
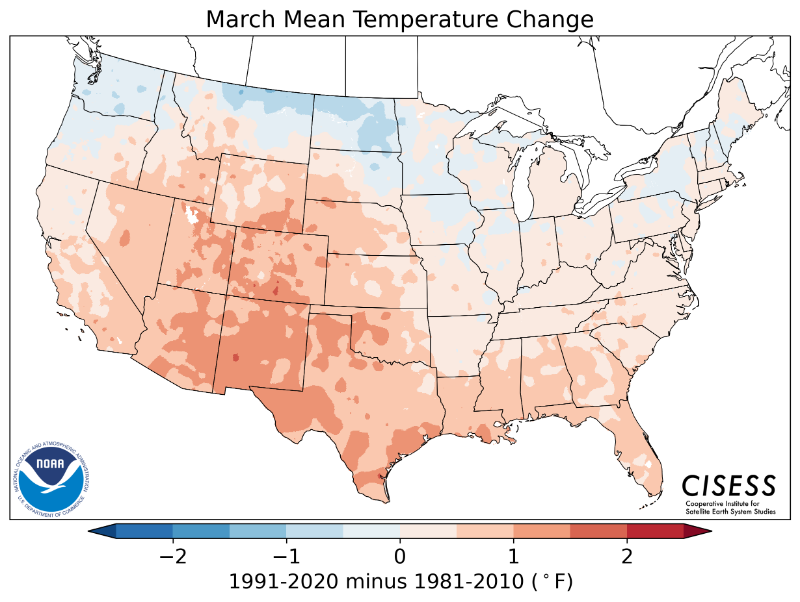
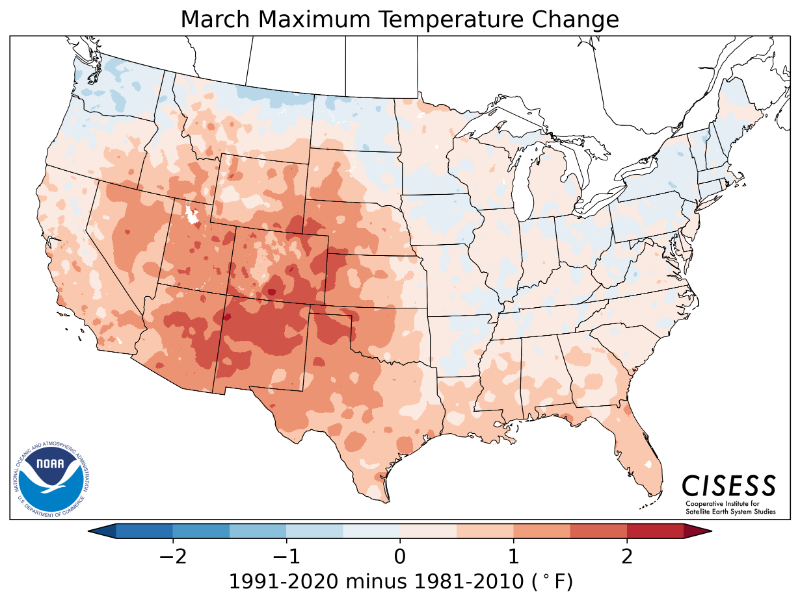
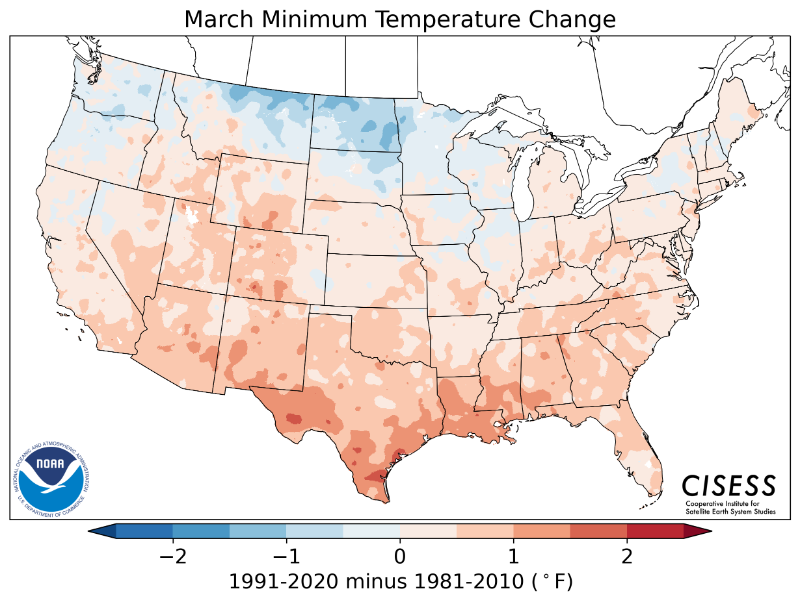
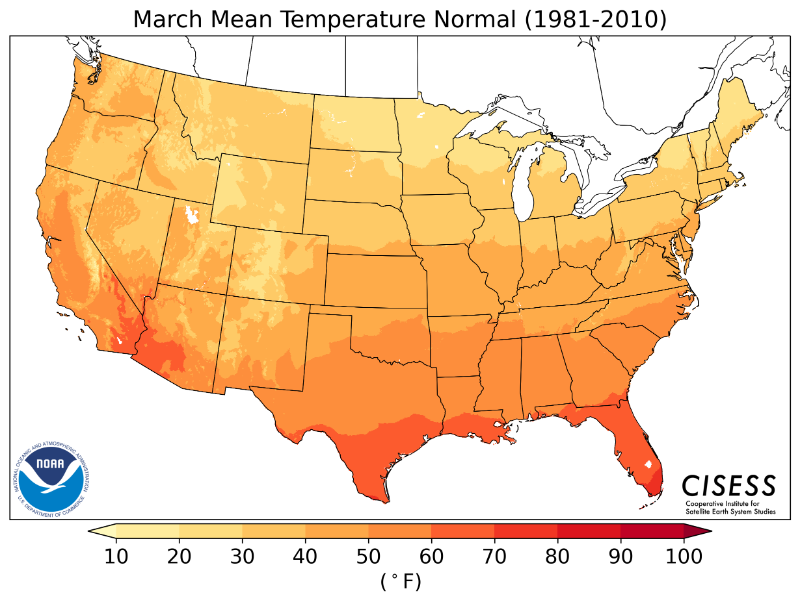
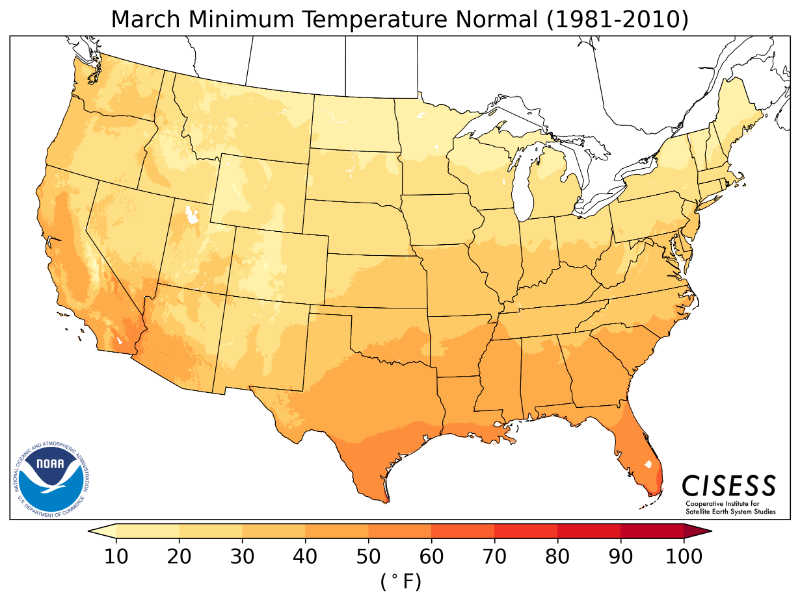
| March |  |
 |
 |
 |
 |
 |
 |
 |
 |
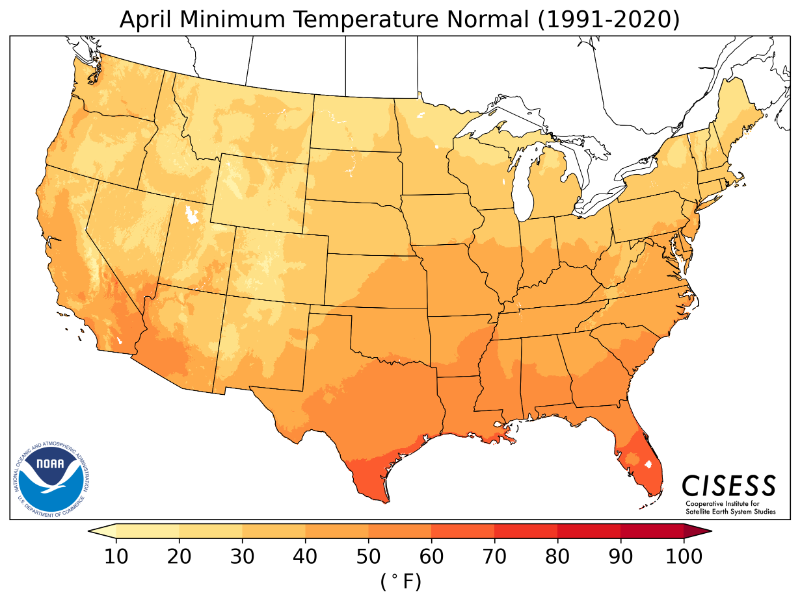
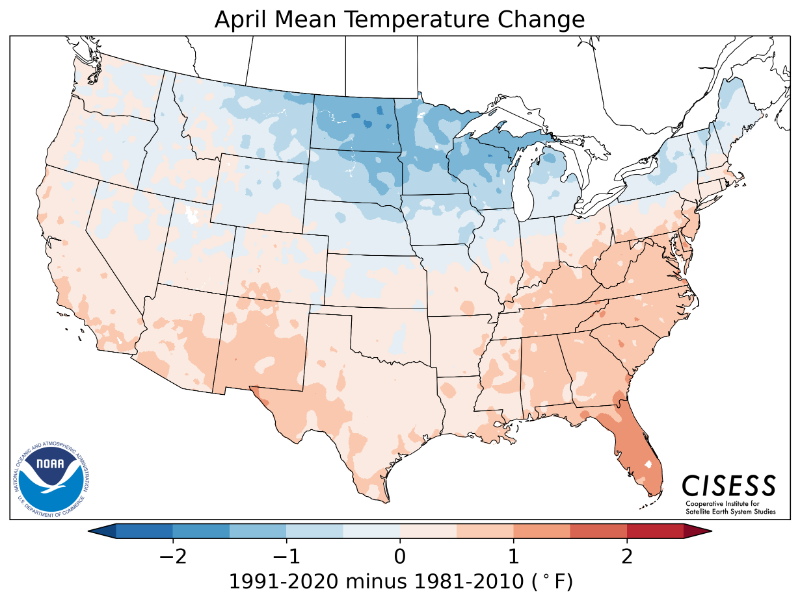
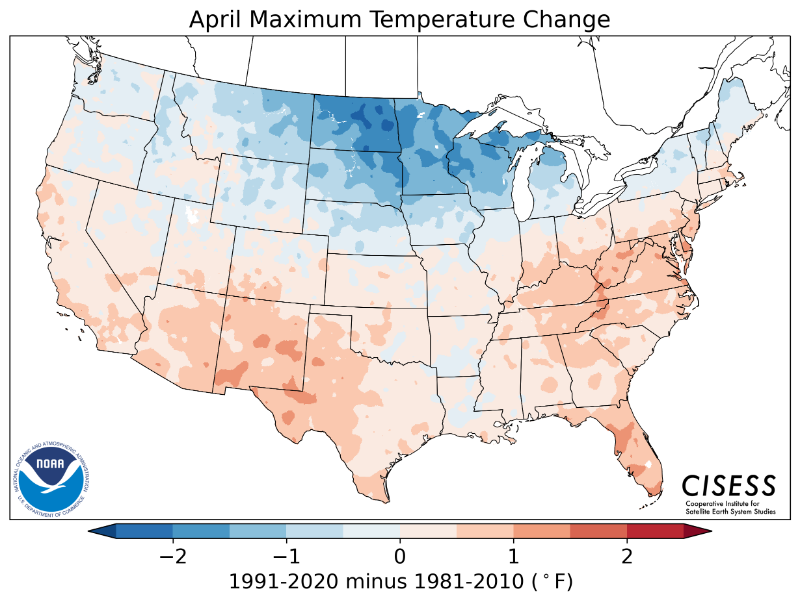
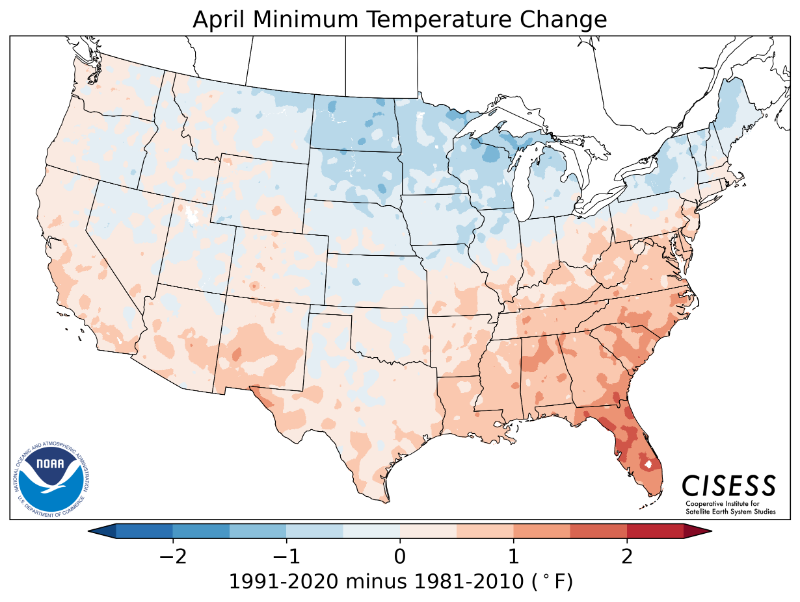
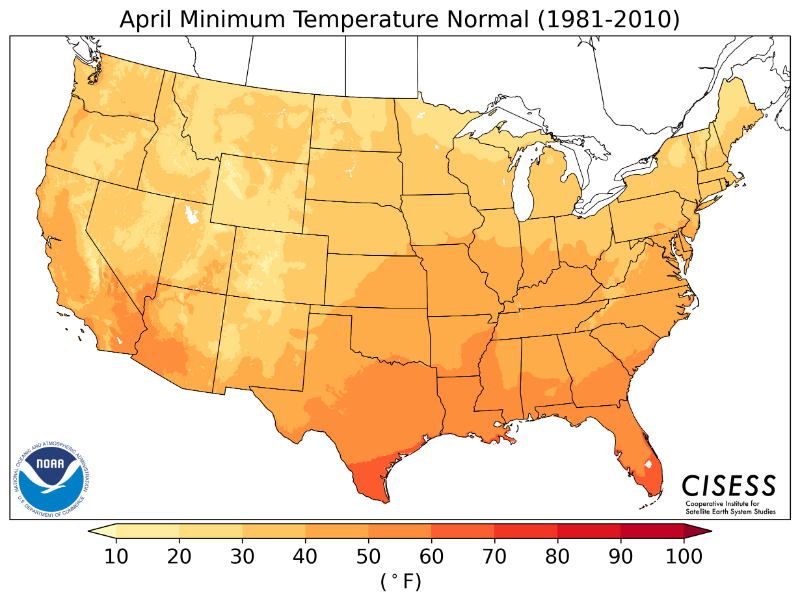
| April |  |
 |
 |
 |
 |
 |
 |
 |
 |
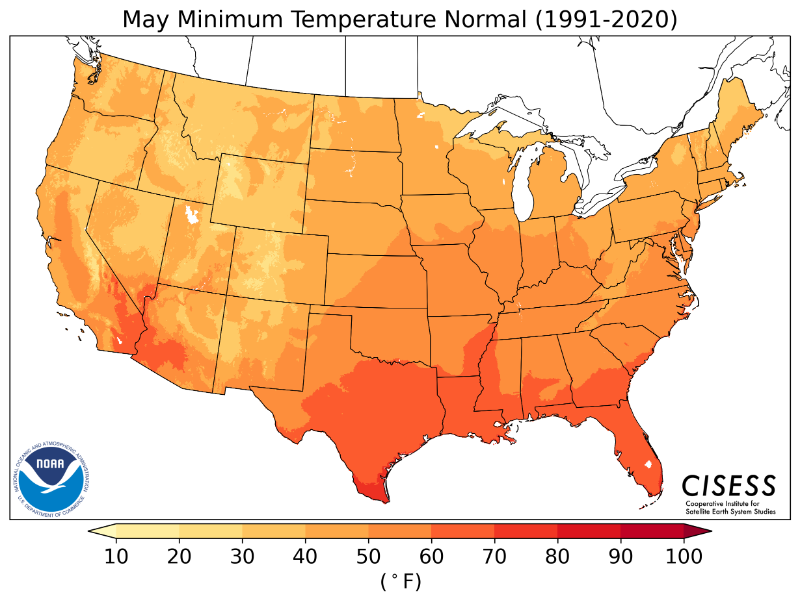
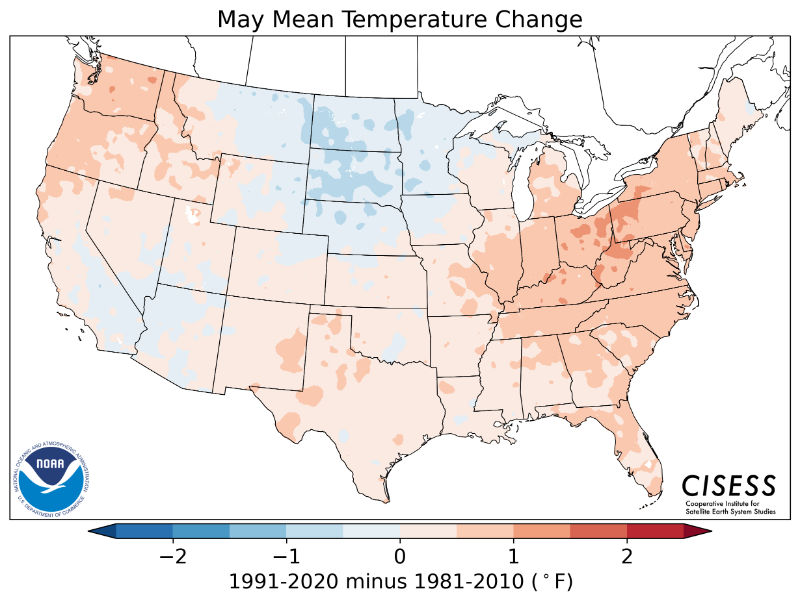
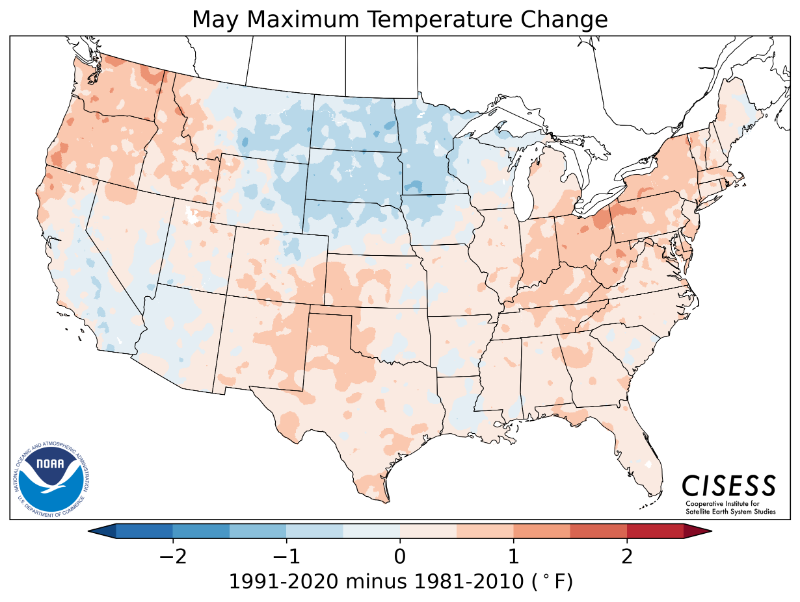
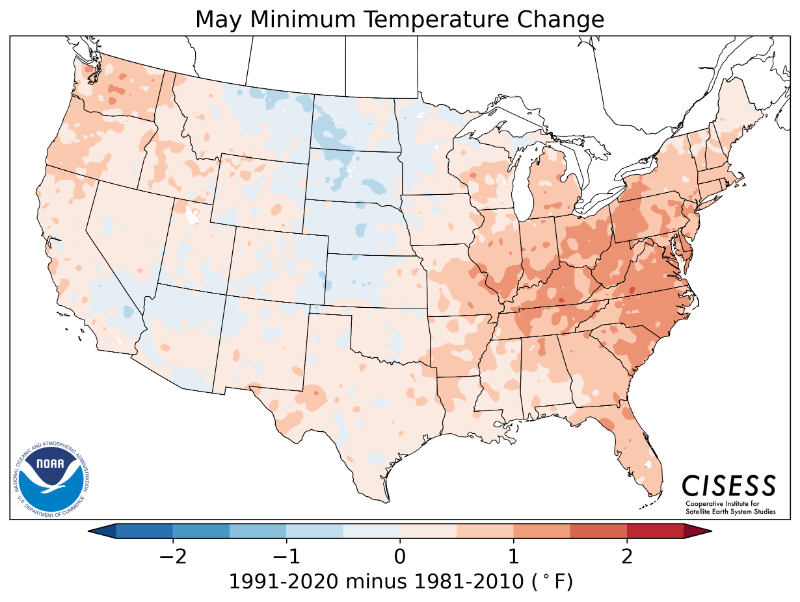
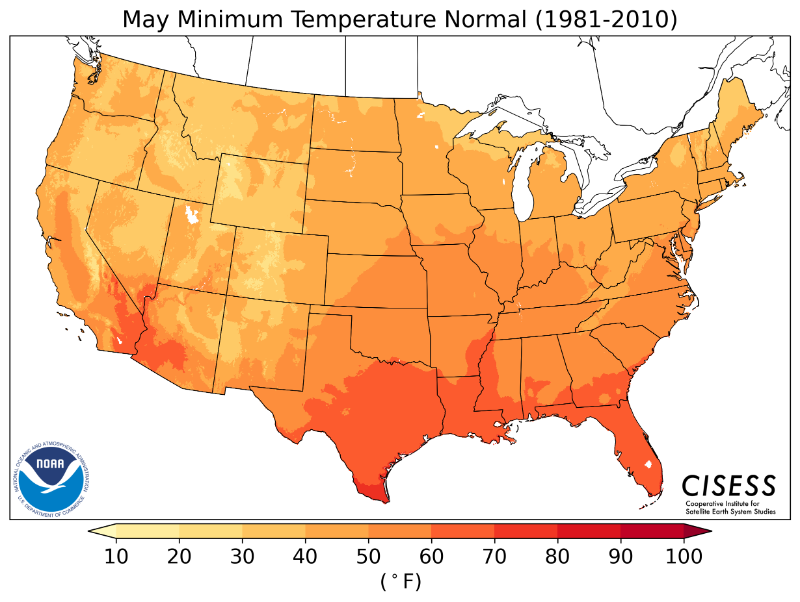
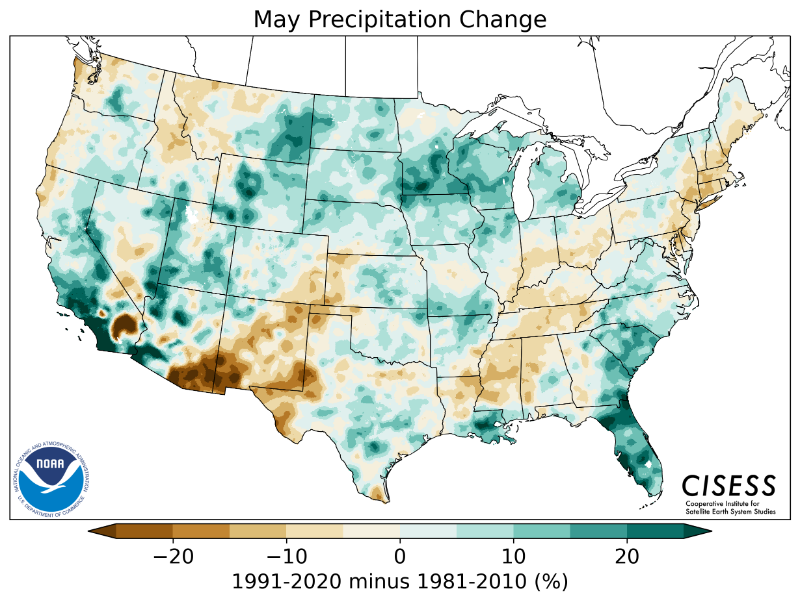
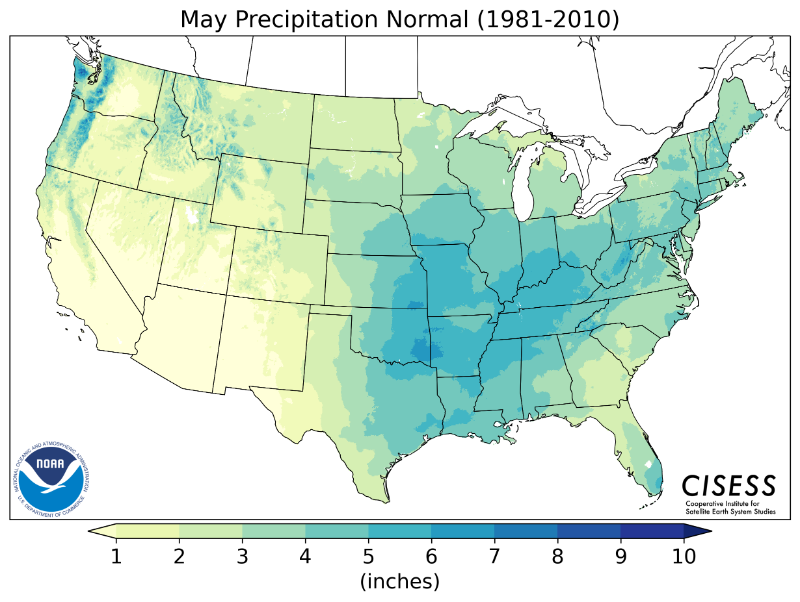
| May |  |
 |
 |
 |
 |
 |
 |
 |
 |
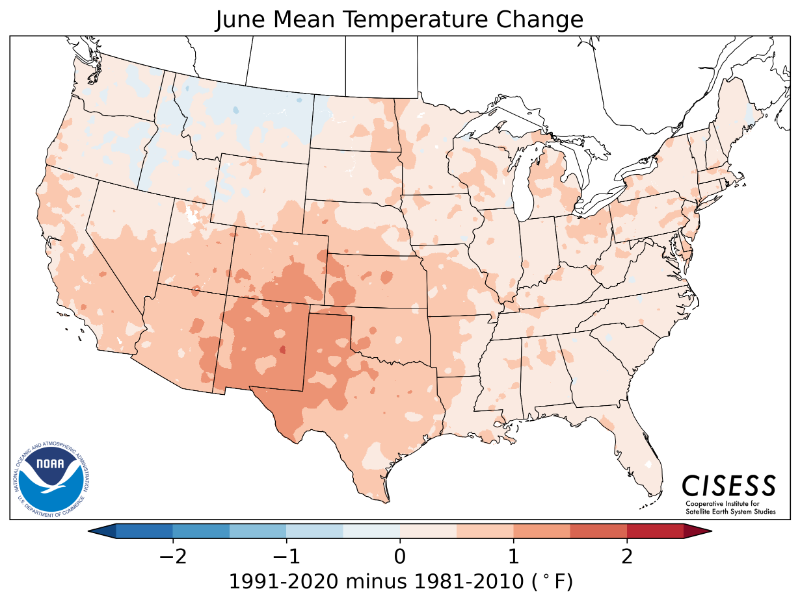
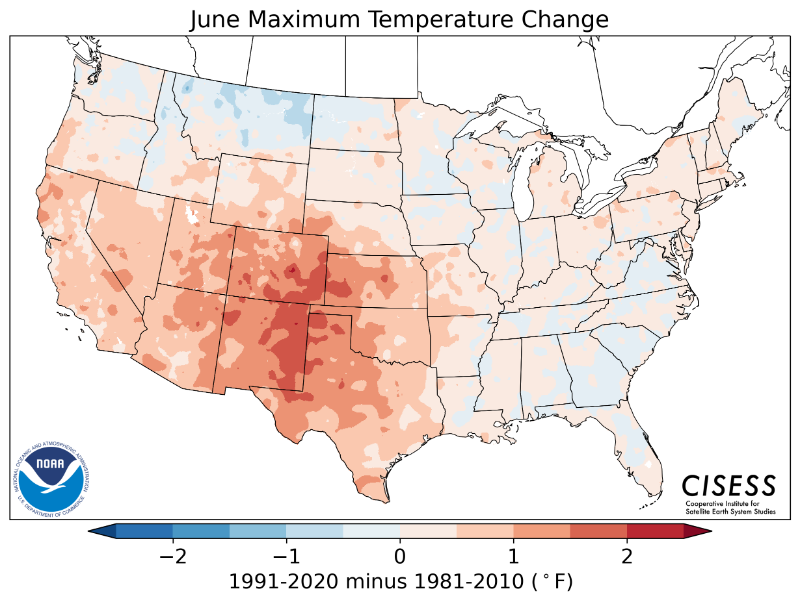
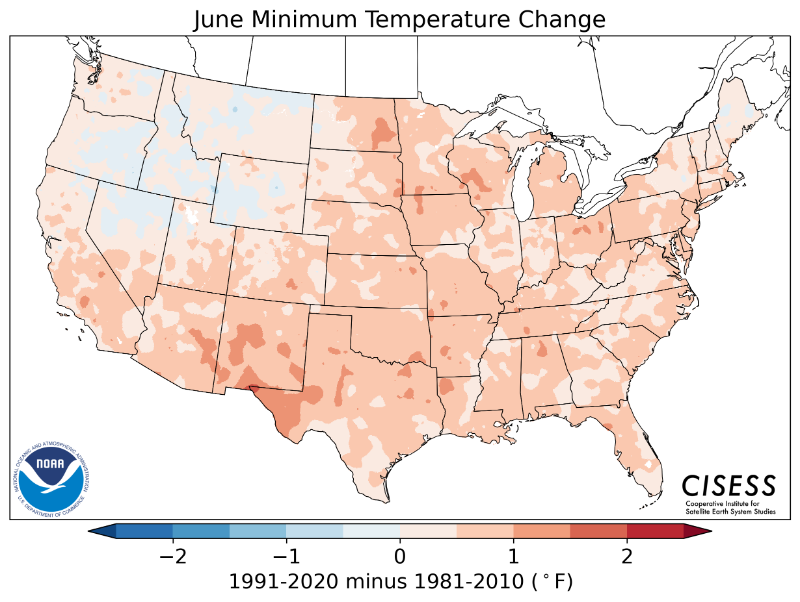
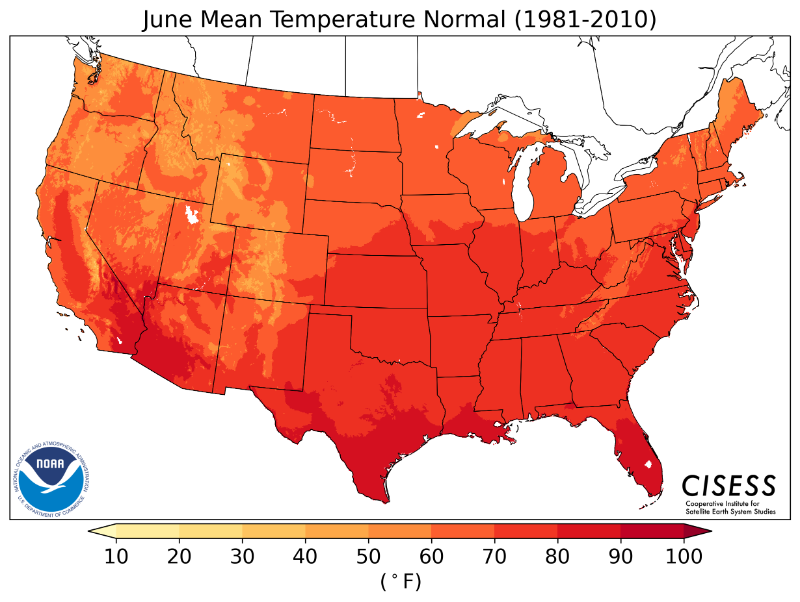
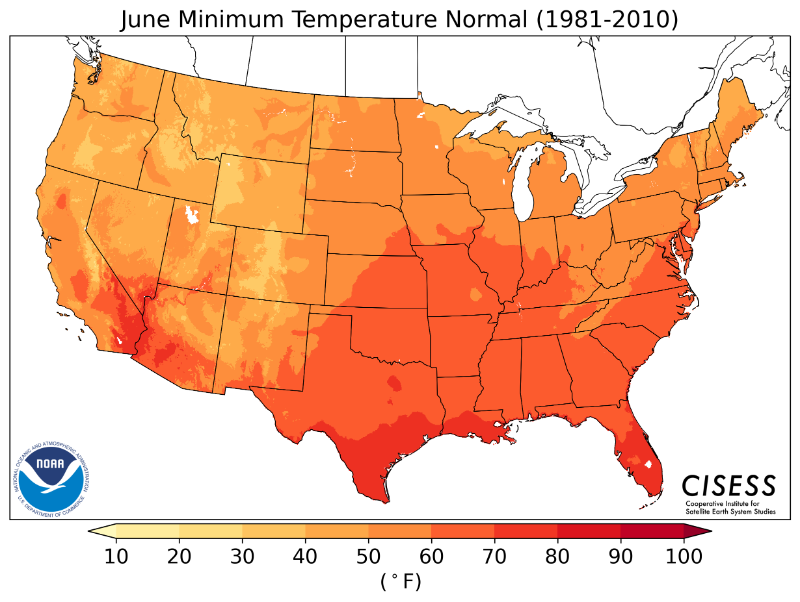
| June |  |
 |
 |
 |
 |
 |
 |
 |
 |
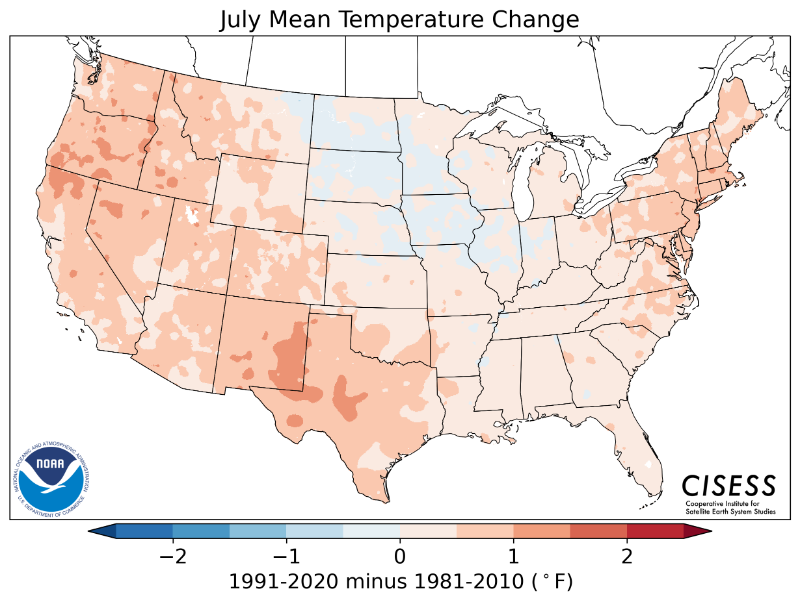
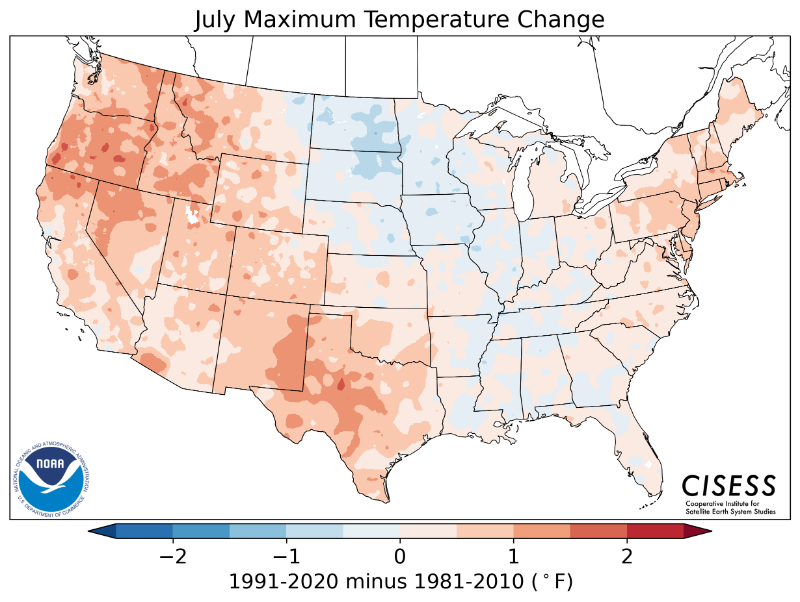
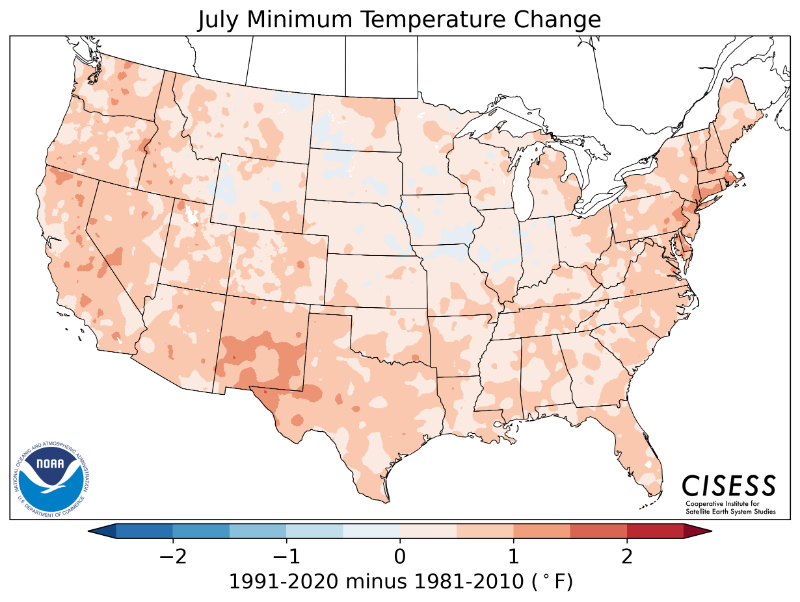
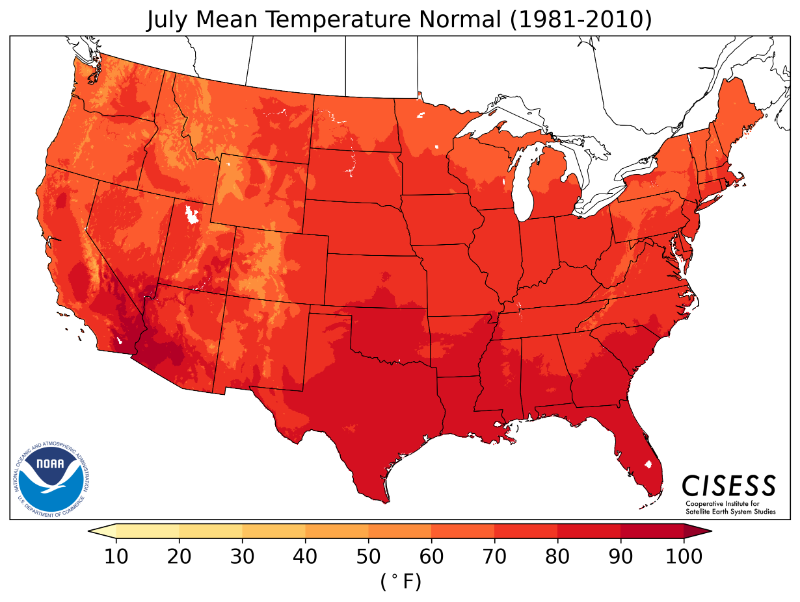
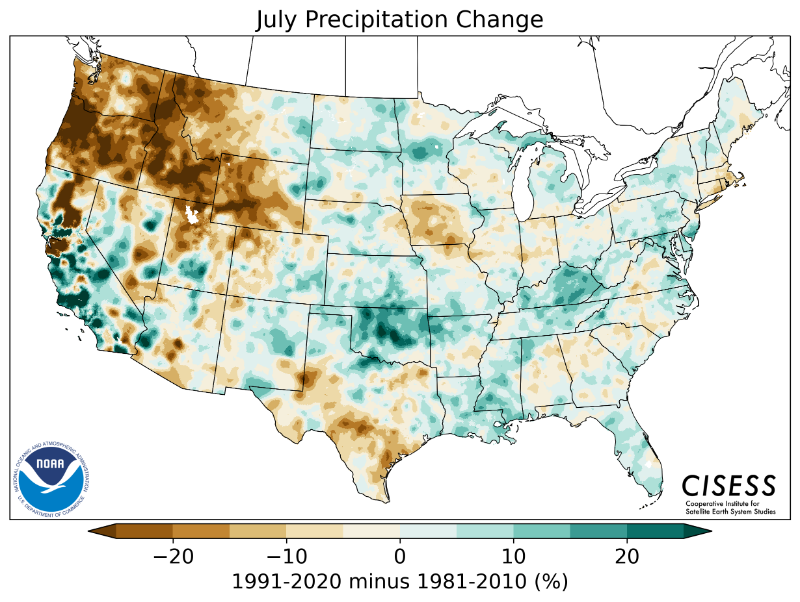
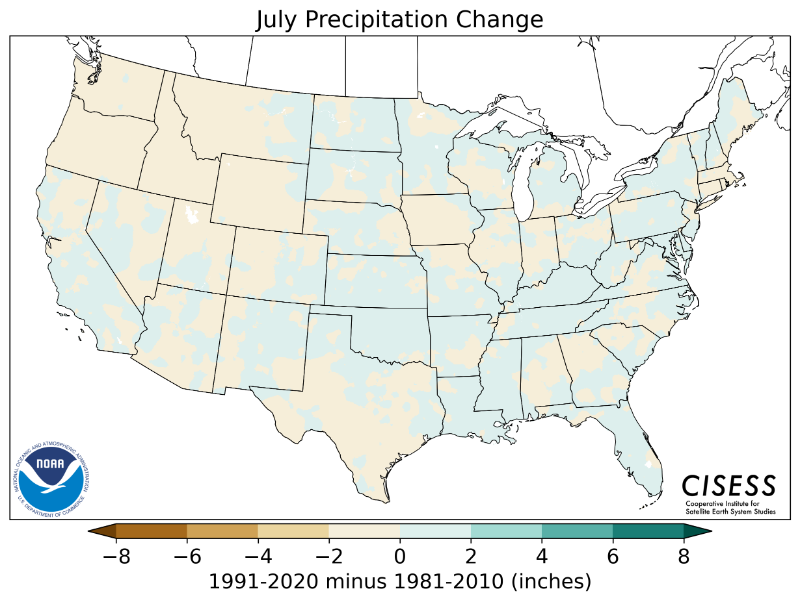
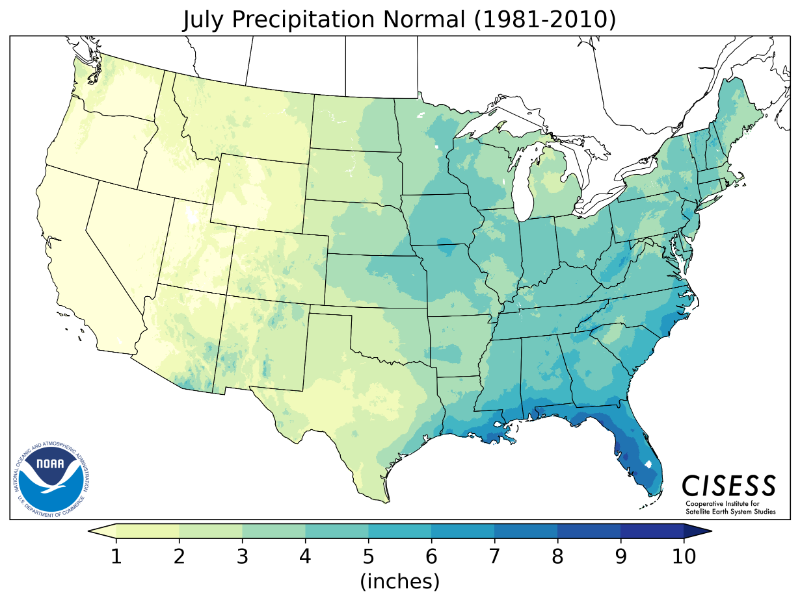
| July |  |
 |
 |
 |
 |
 |
 |
 |
 |
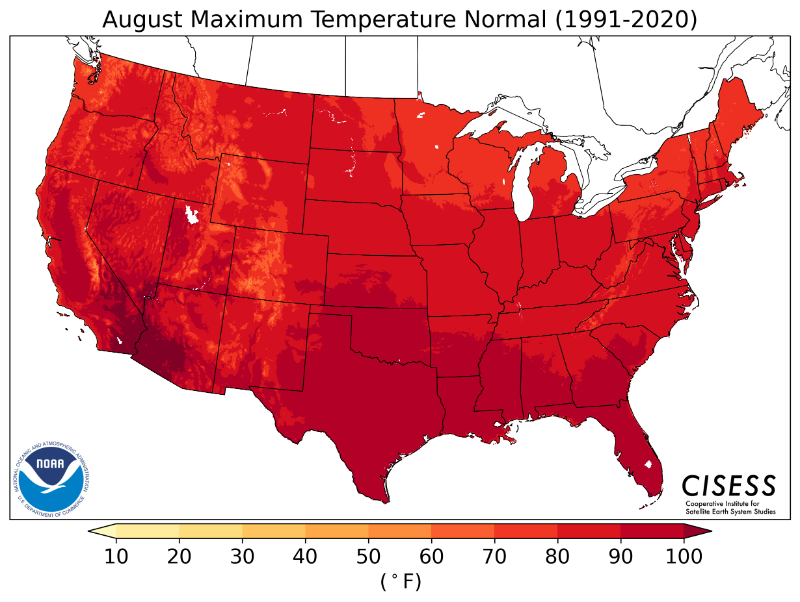
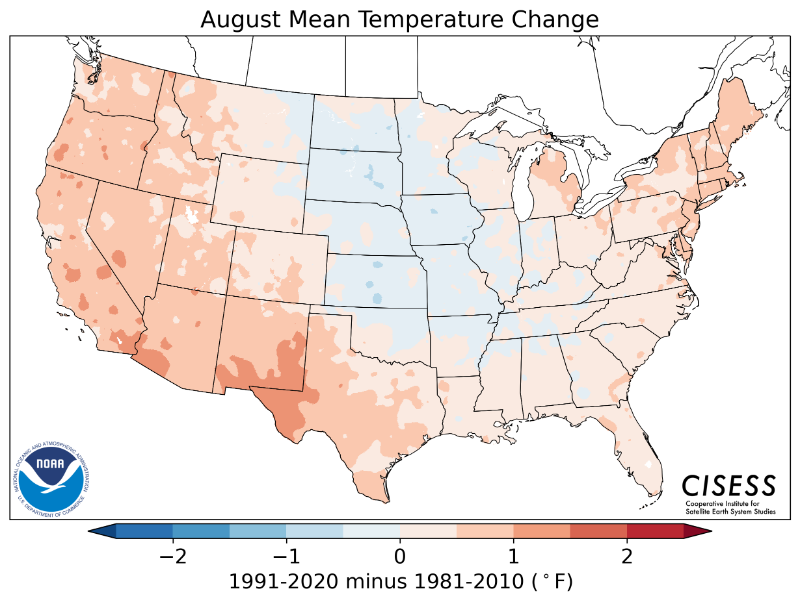
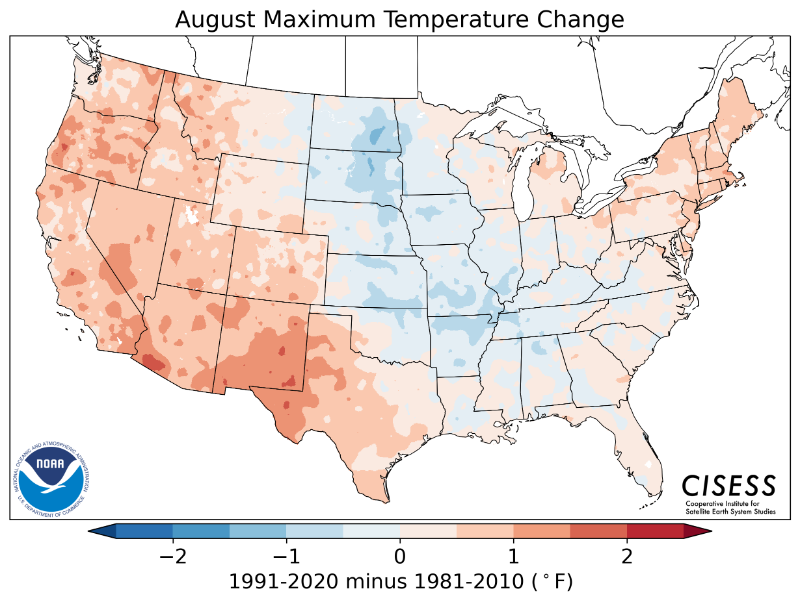
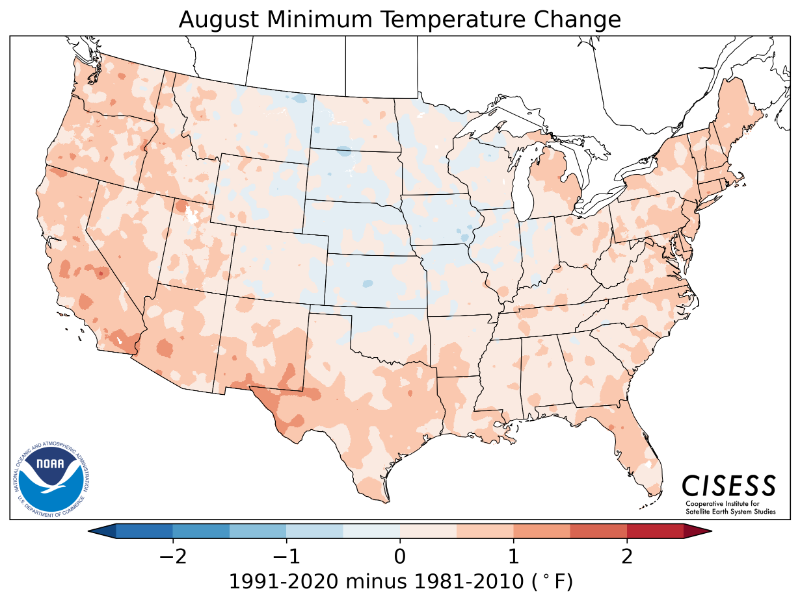
| August |  |
 |
 |
 |
 |
 |
 |
 |
 |
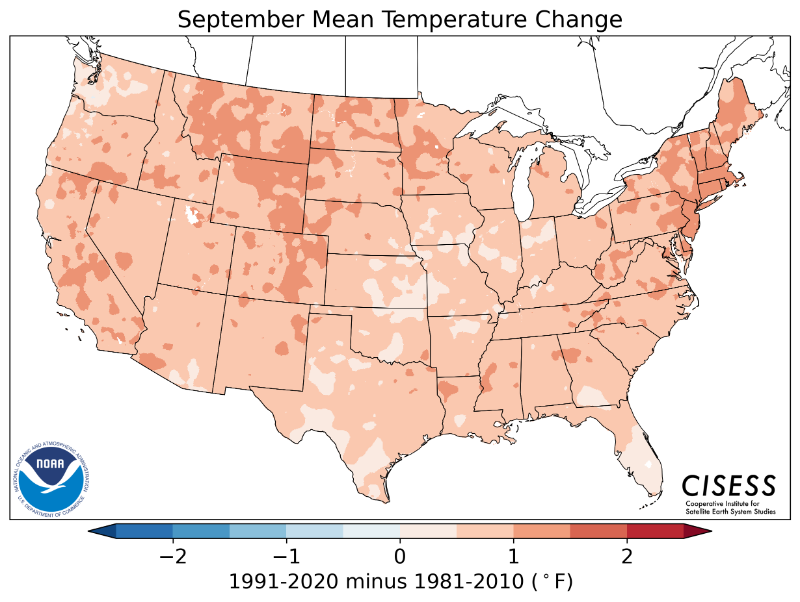
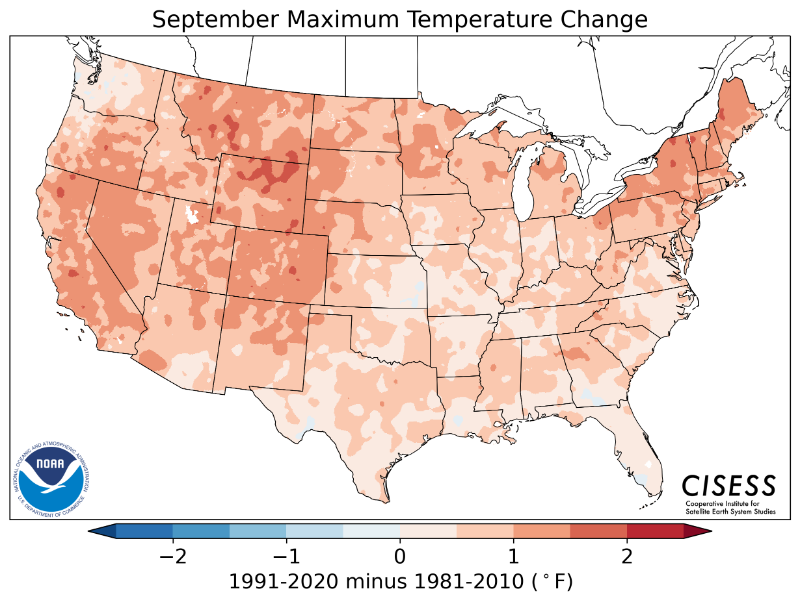
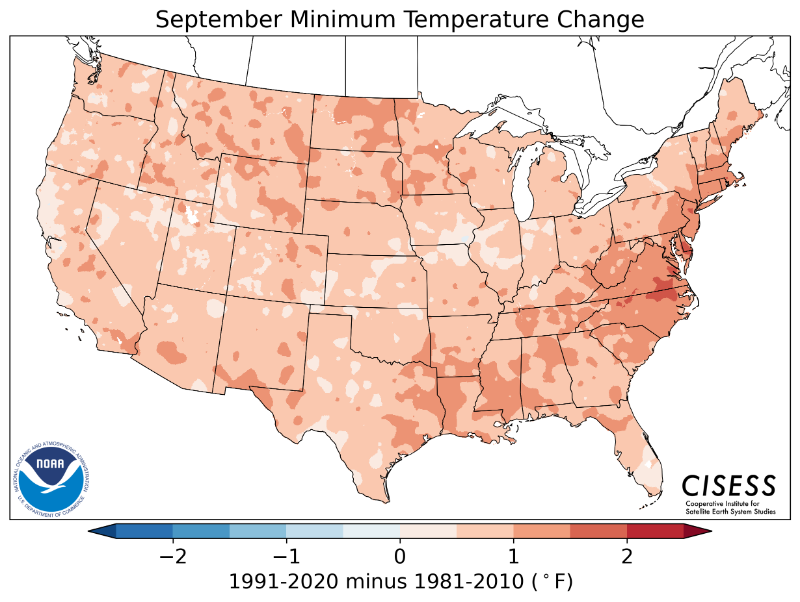
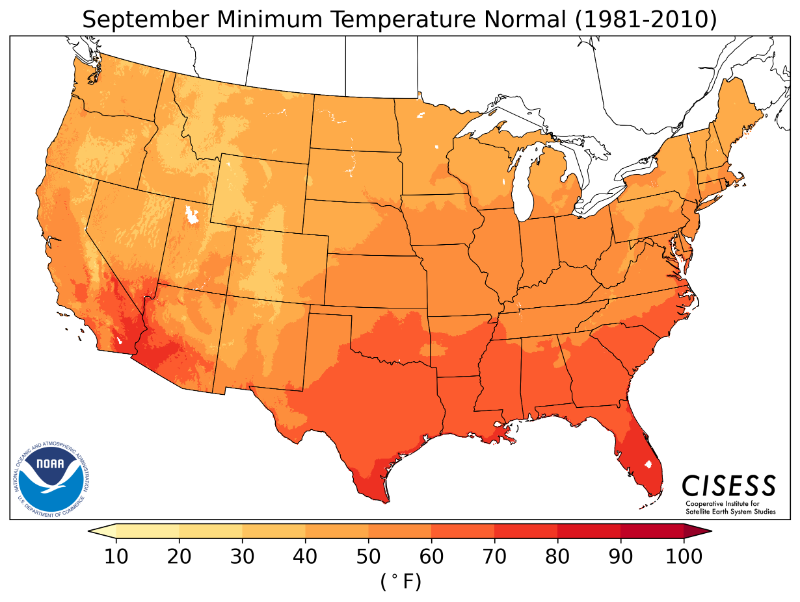
| September |  |
 |
 |
 |
 |
 |
 |
 |
 |
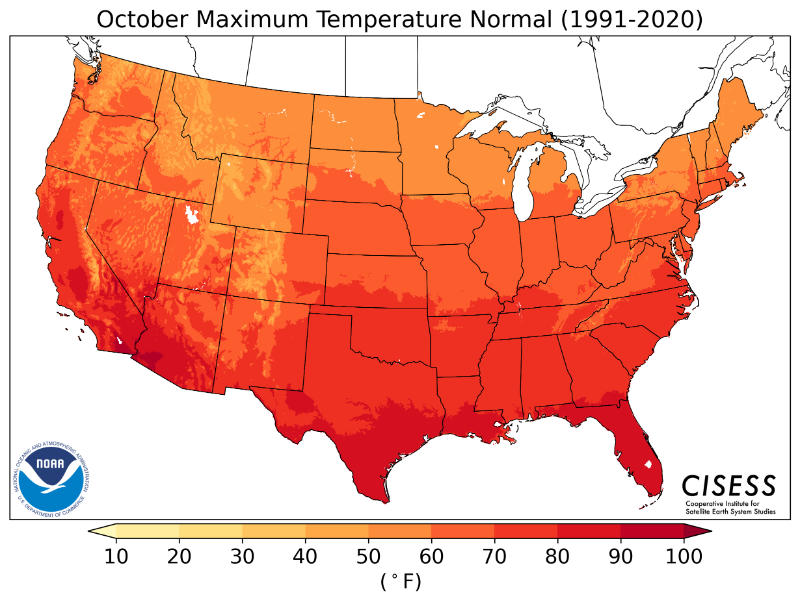
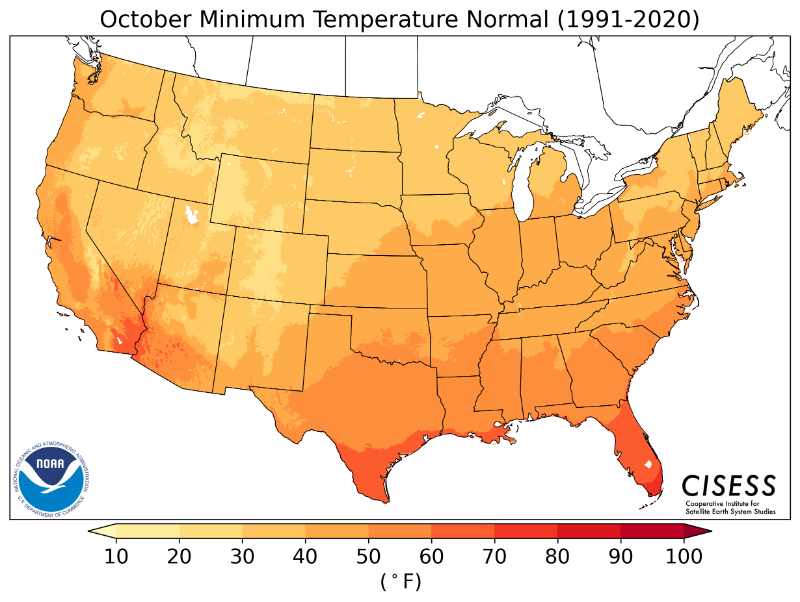
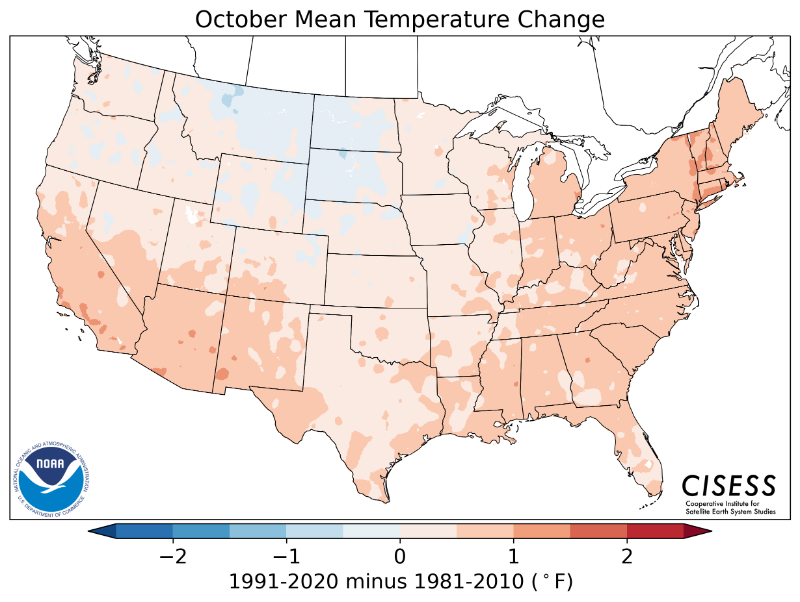
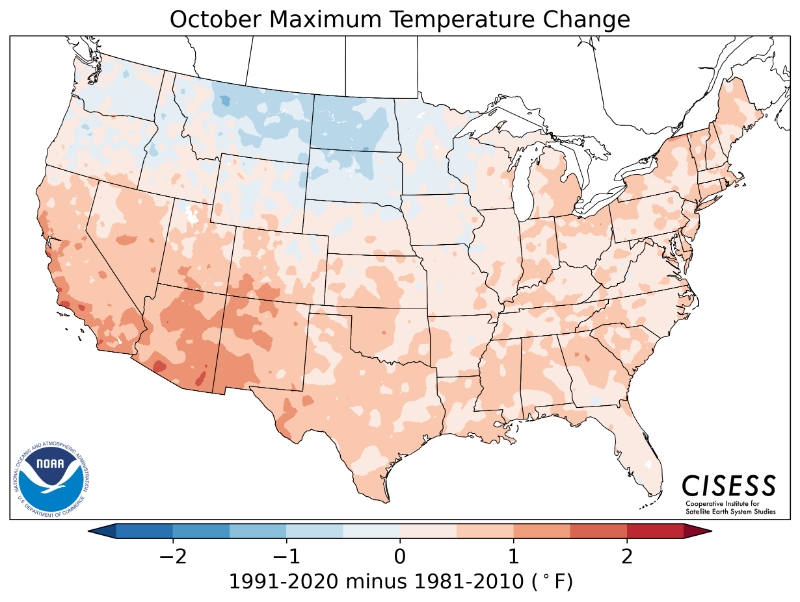
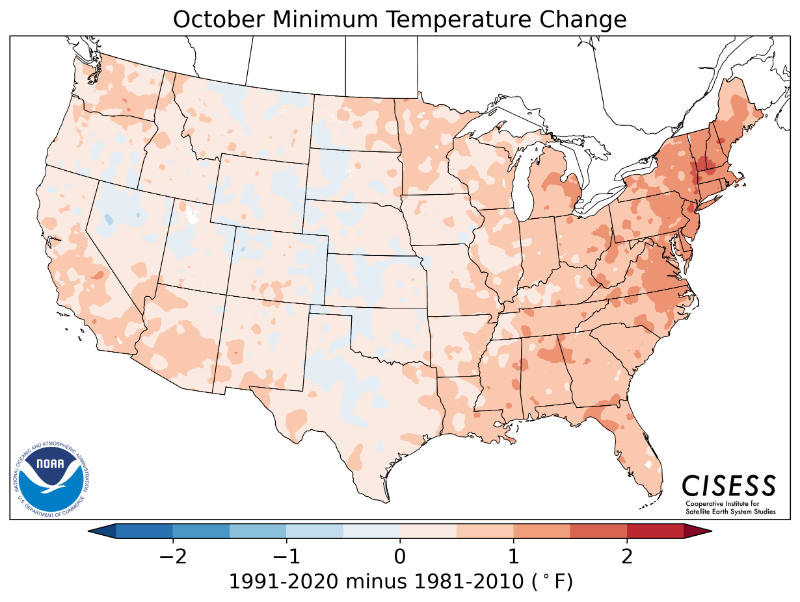
| October |  |
 |
 |
 |
 |
 |
 |
 |
 |
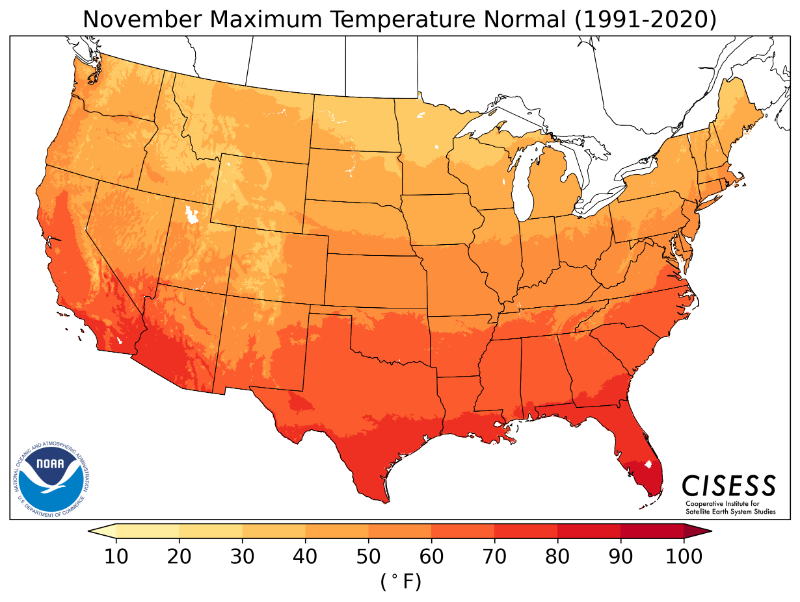
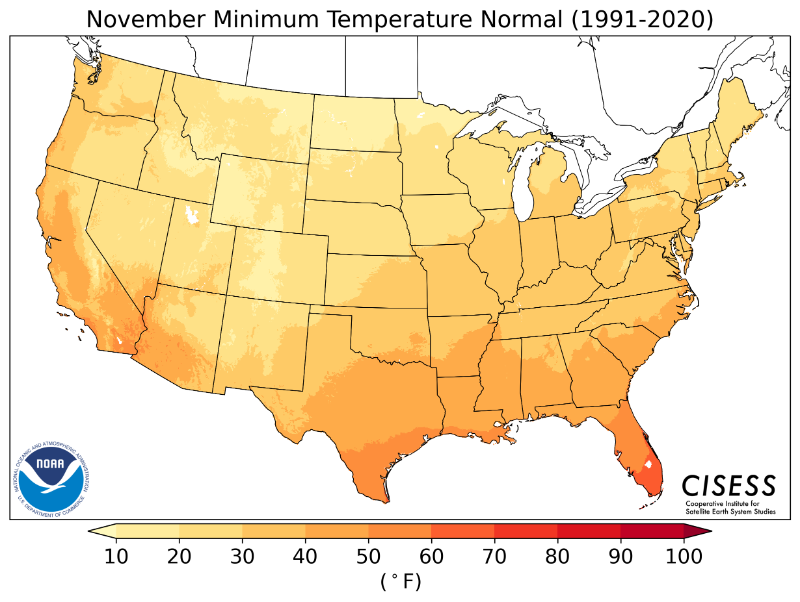
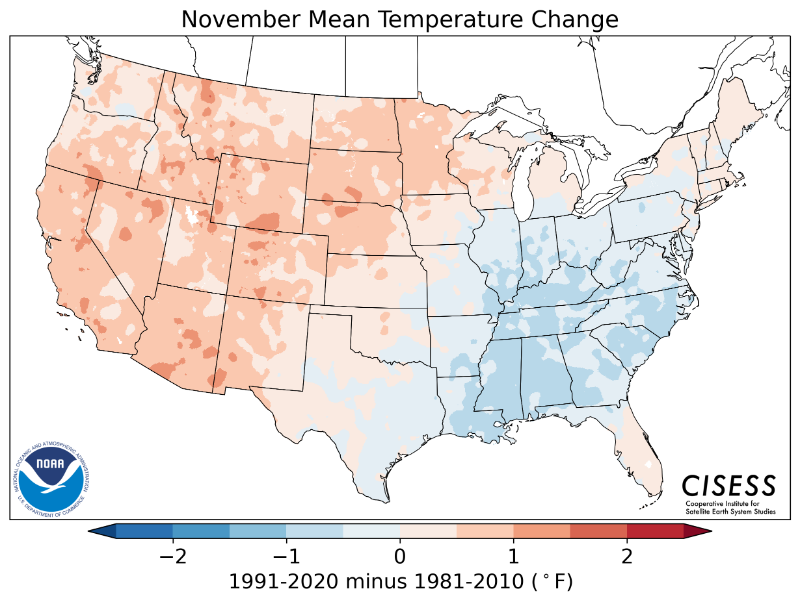
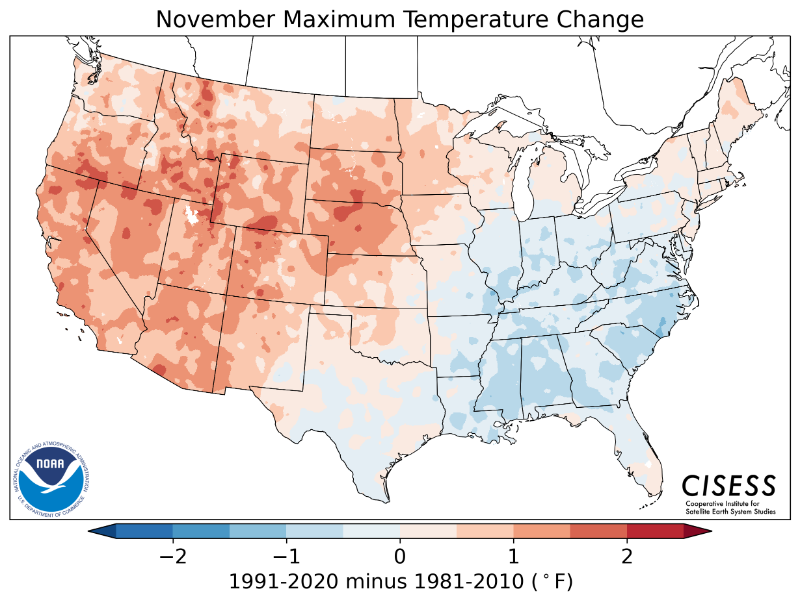
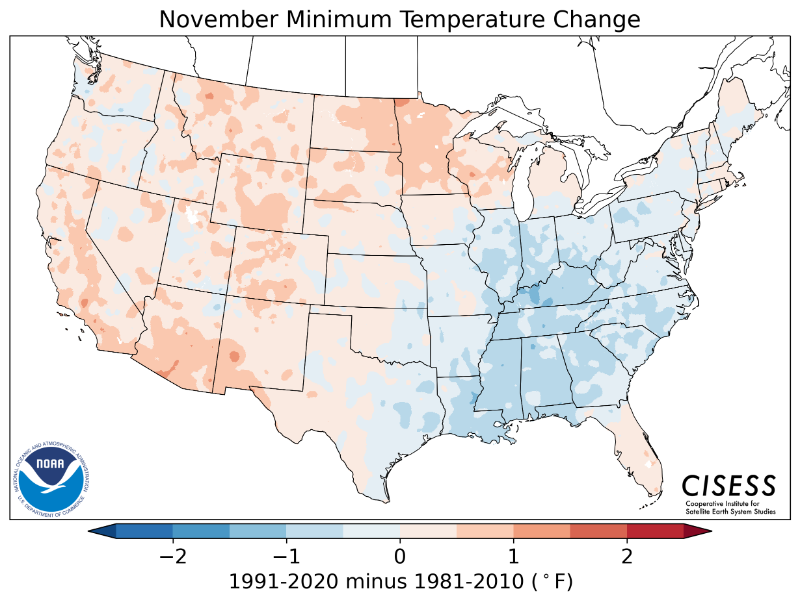
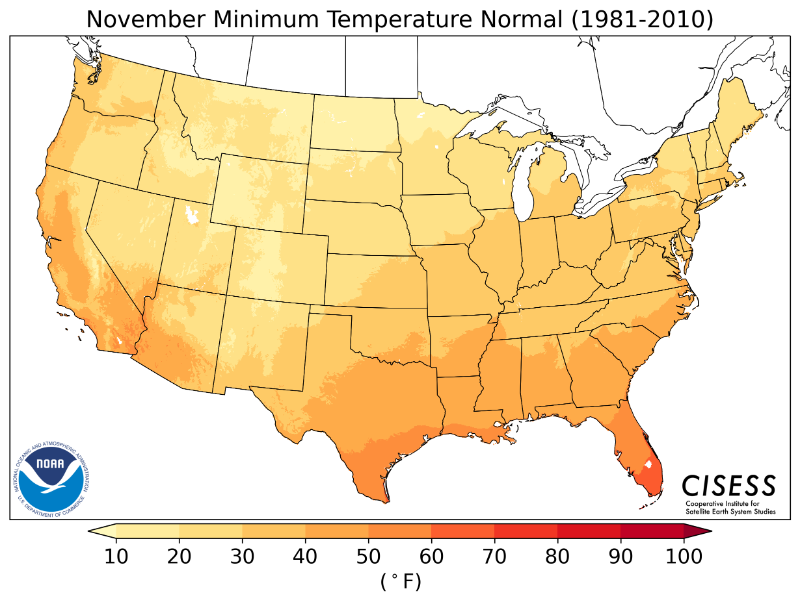
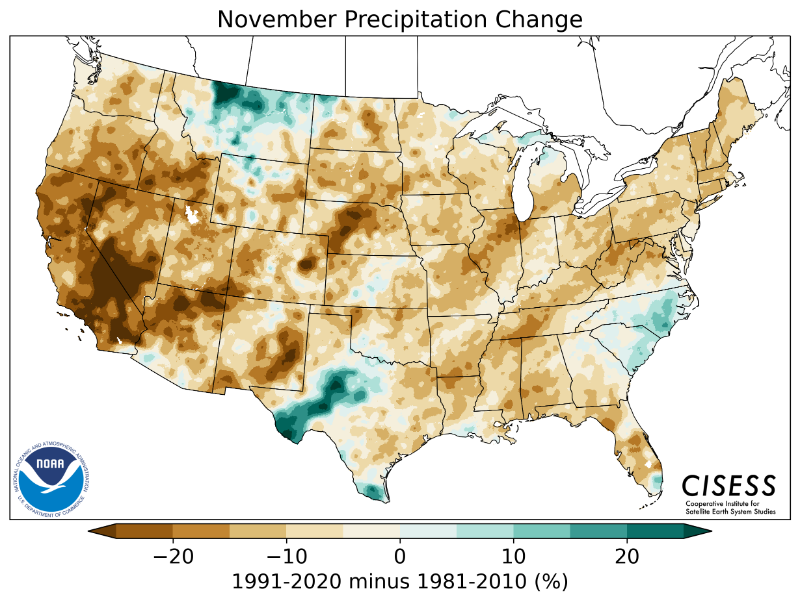
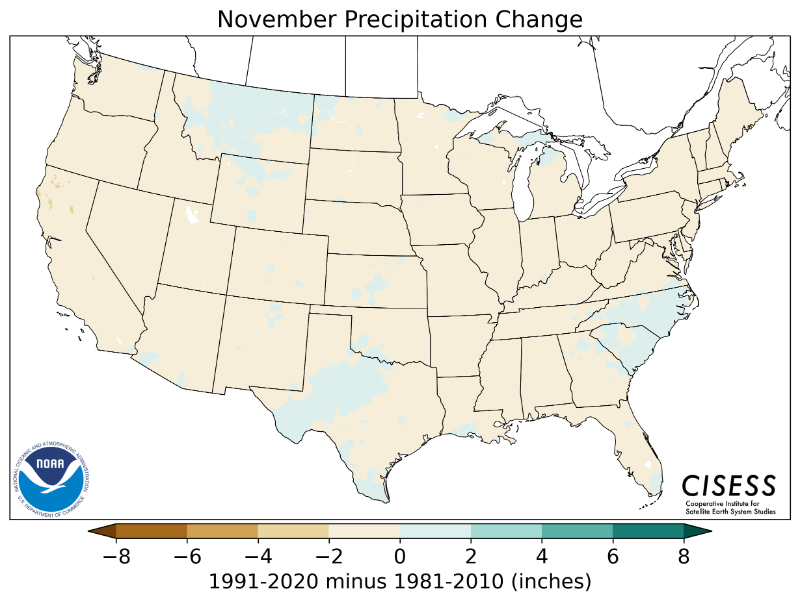
| November | 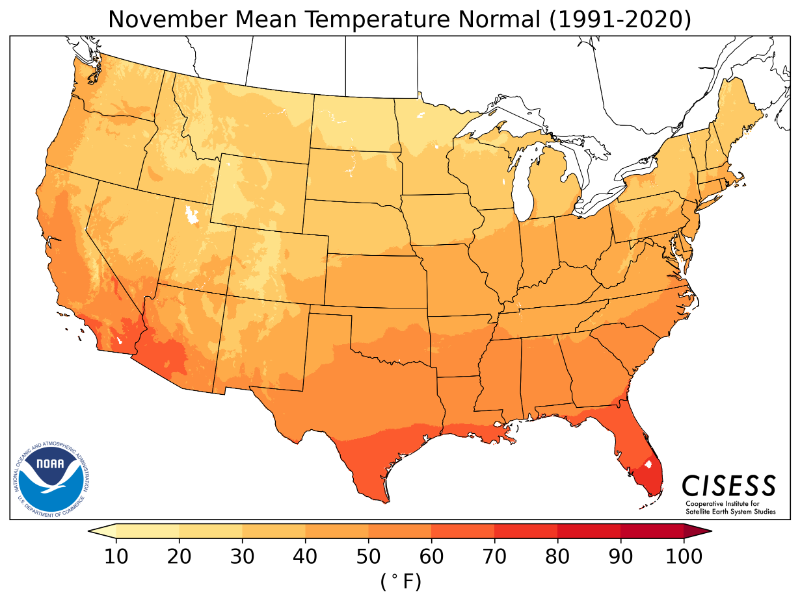 |
 |
 |
 |
 |
 |
 |
 |
 |
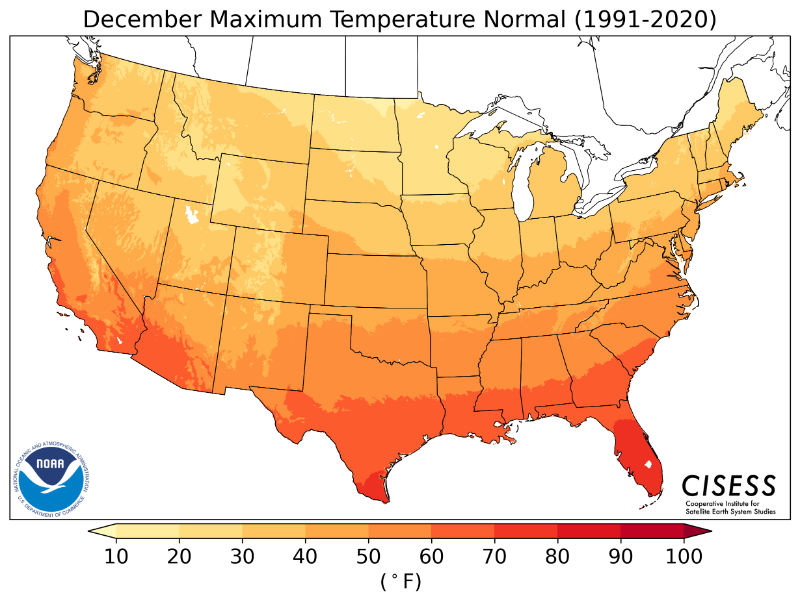
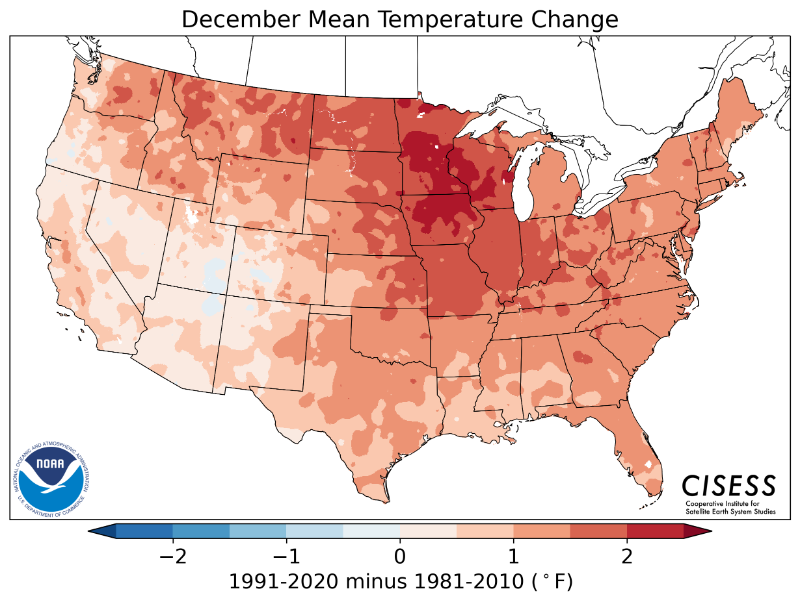
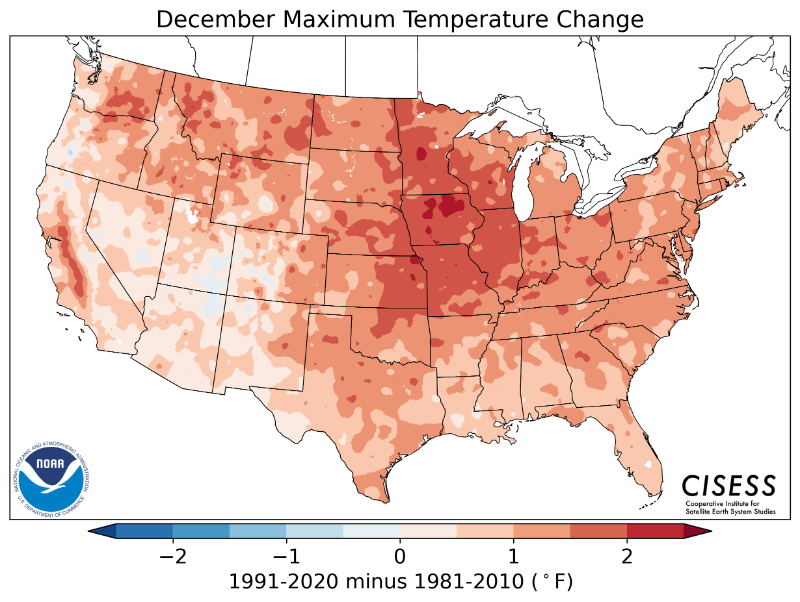
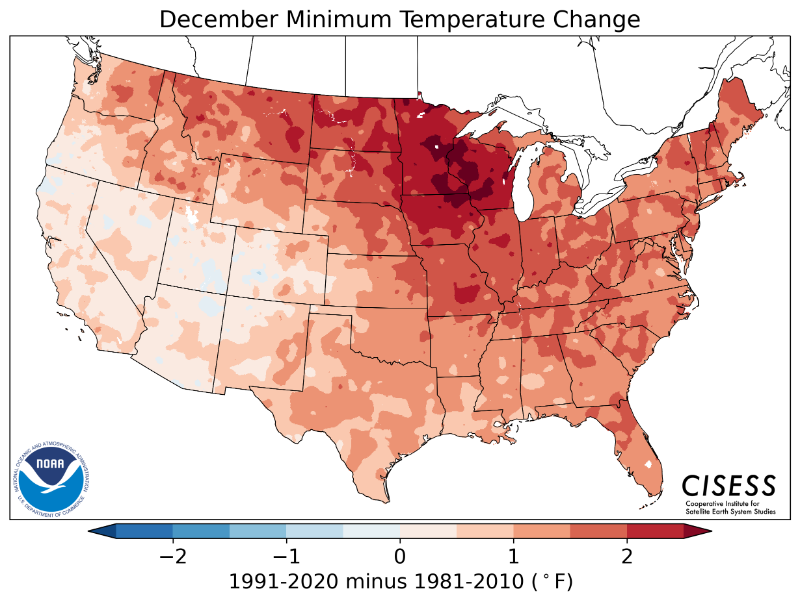
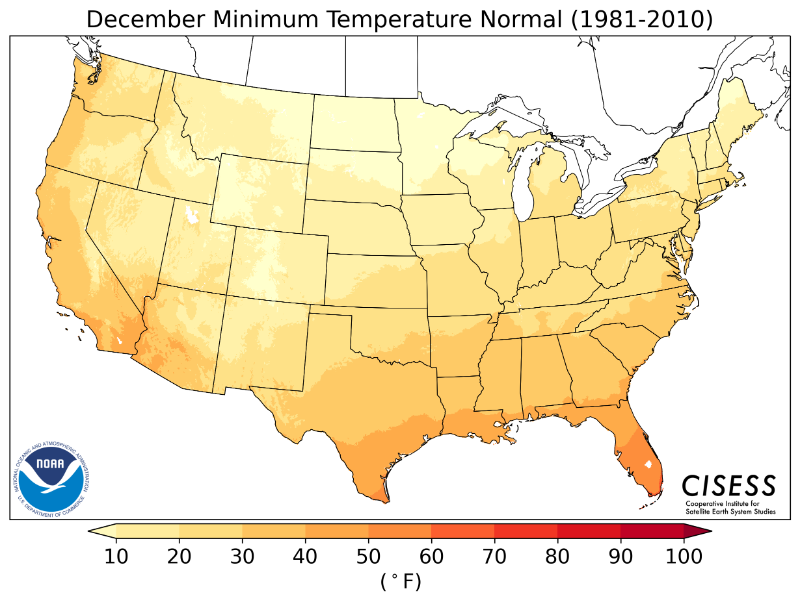
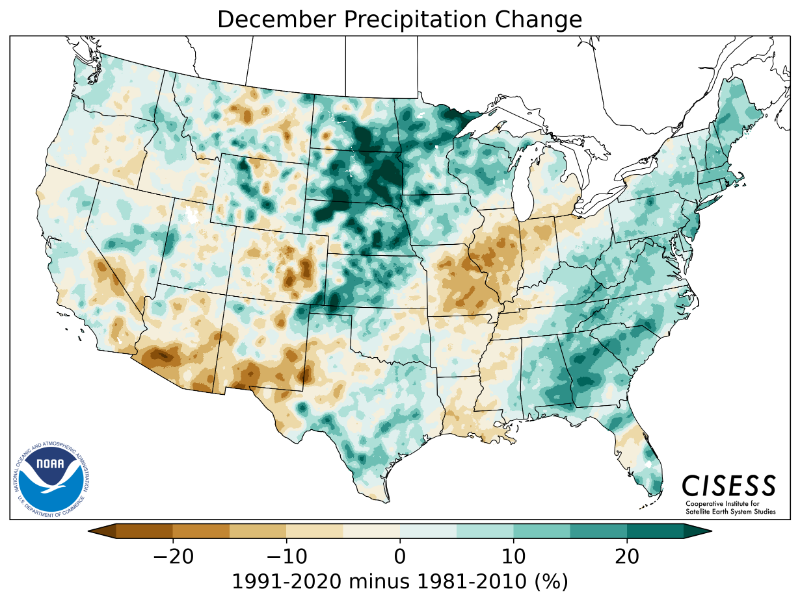
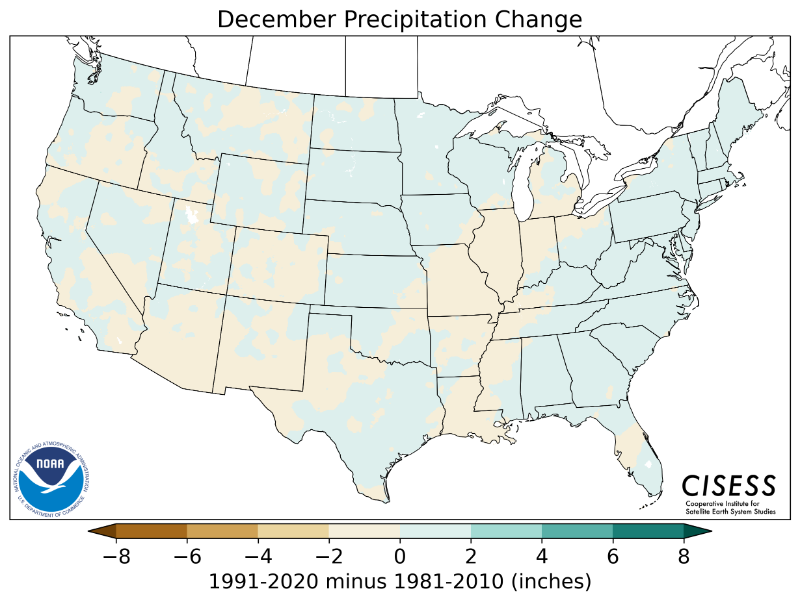
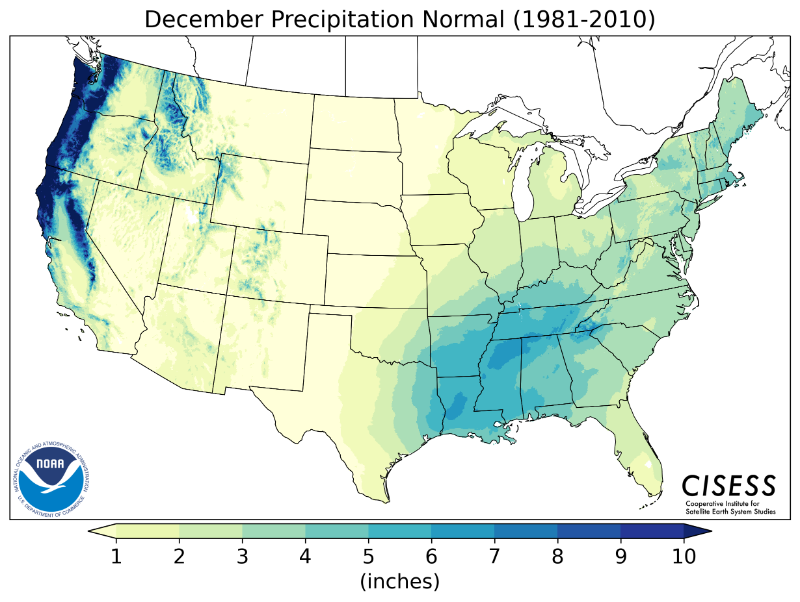
| December | 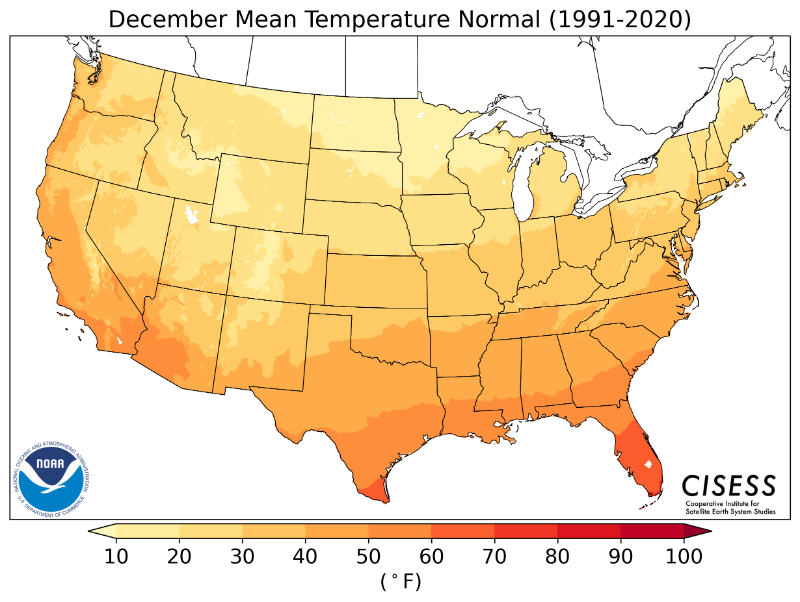 |
 |
 |
 |
 |
 |
 |
 |
 |
PRECIPITATION
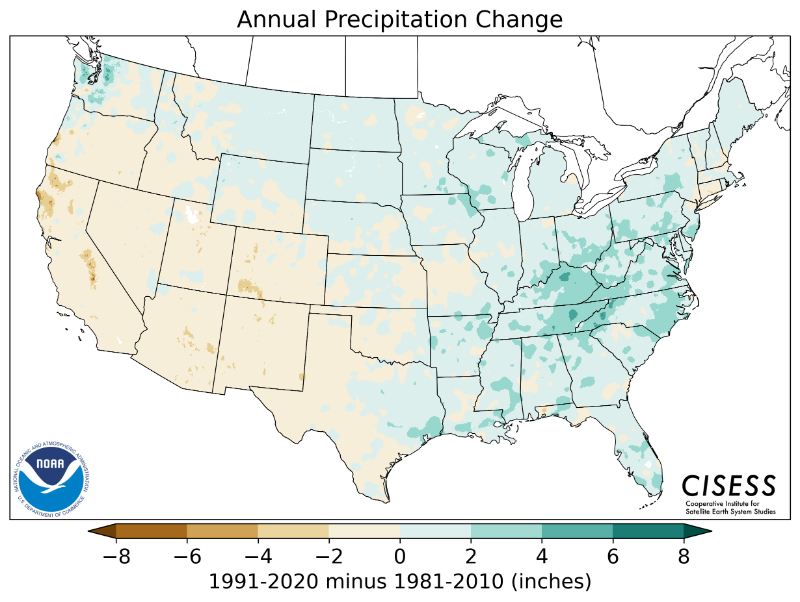
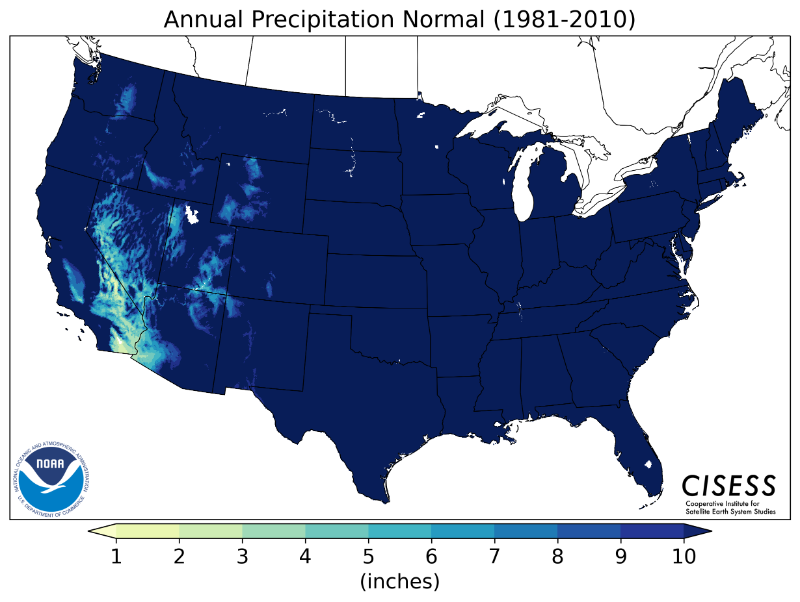
| ANNUAL | |||
| Difference Between Old and New | |||
| 1991-2020 | Percentage Change | Value Difference | 1981-2010 |
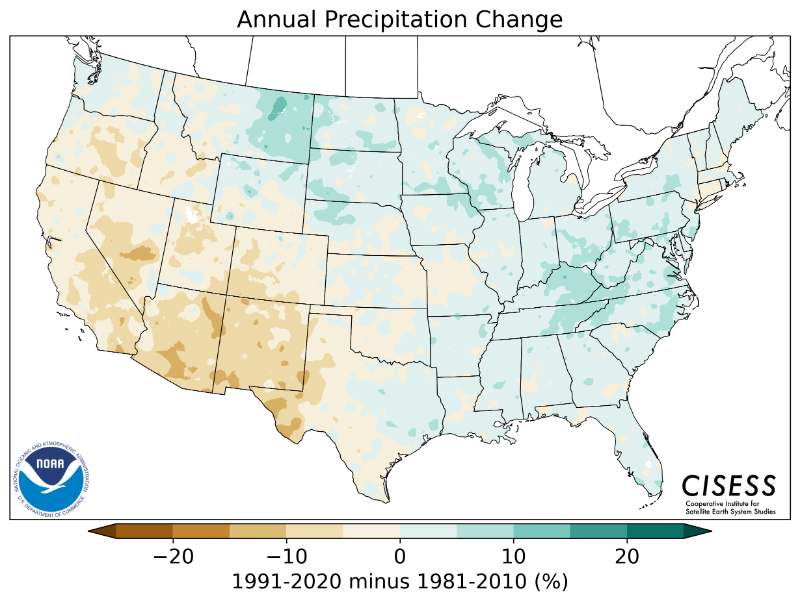
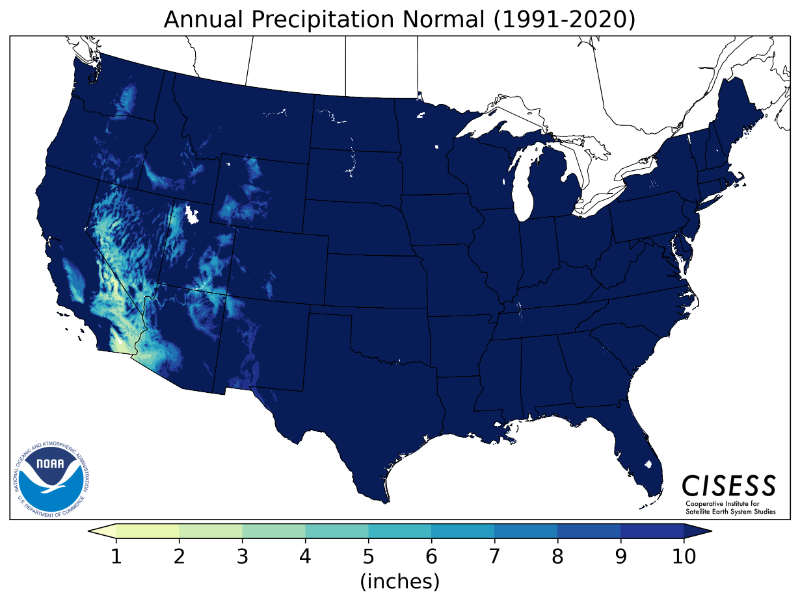 |
 |
 |
 |
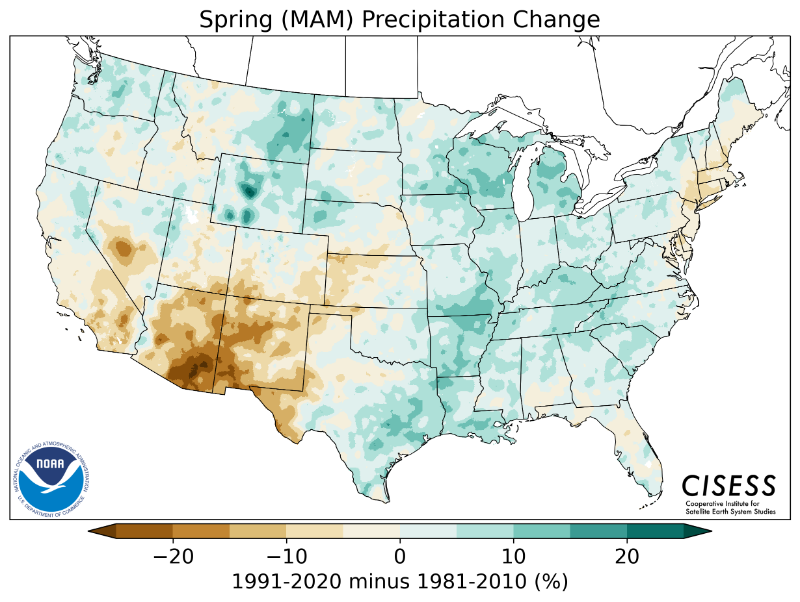
| SEASONAL | ||||
| Difference Between Old and New | ||||
| 1991-2020 | Percentage Change | Value Difference | 1981-2010 | |
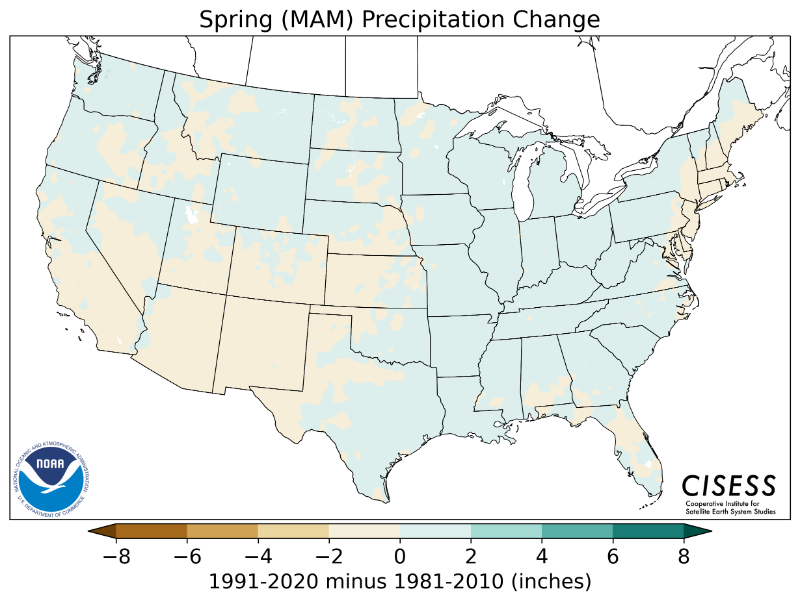
| Spring | 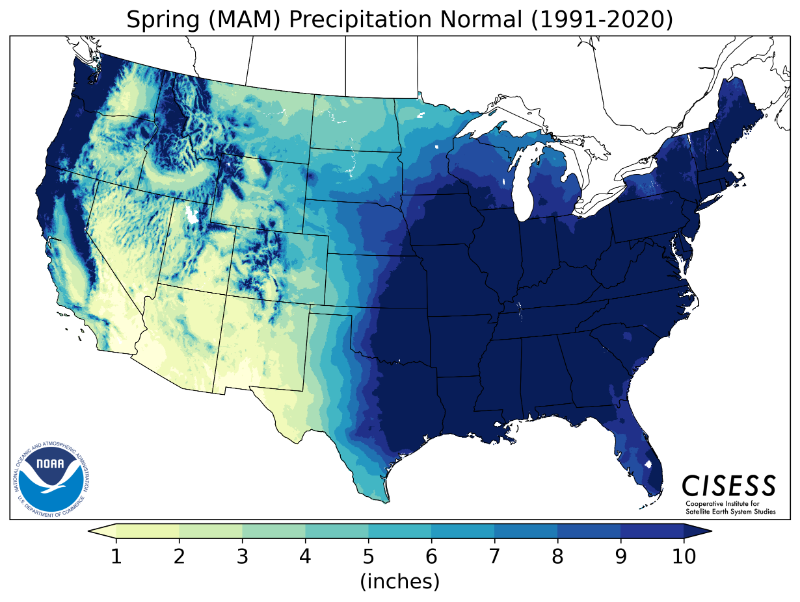 |
 |
 |
 |
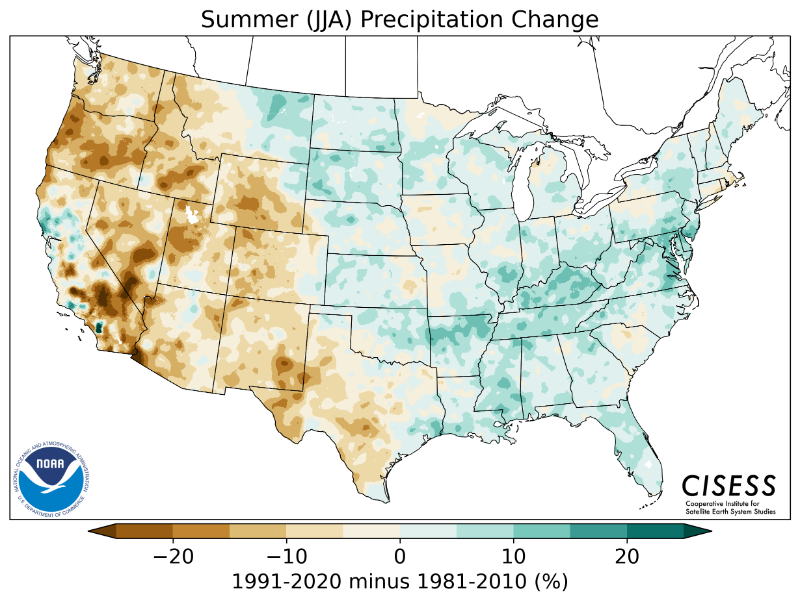
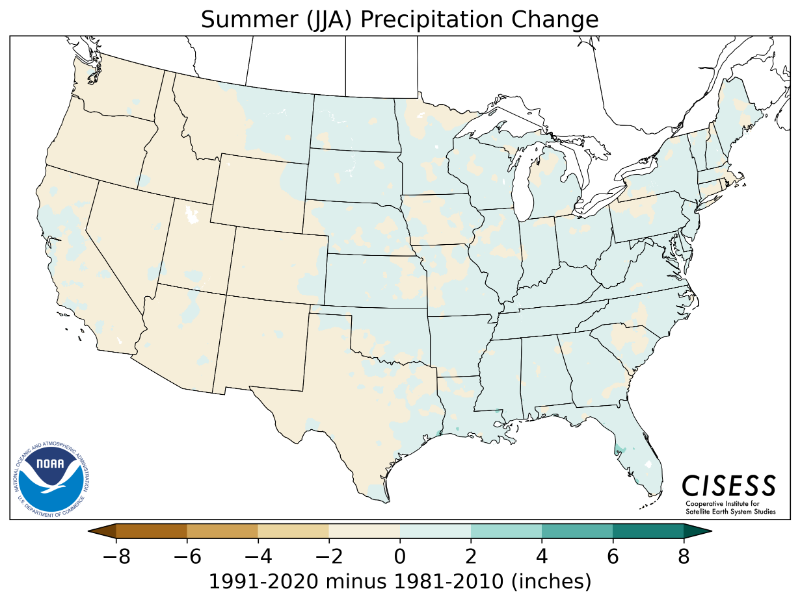
| Summer | 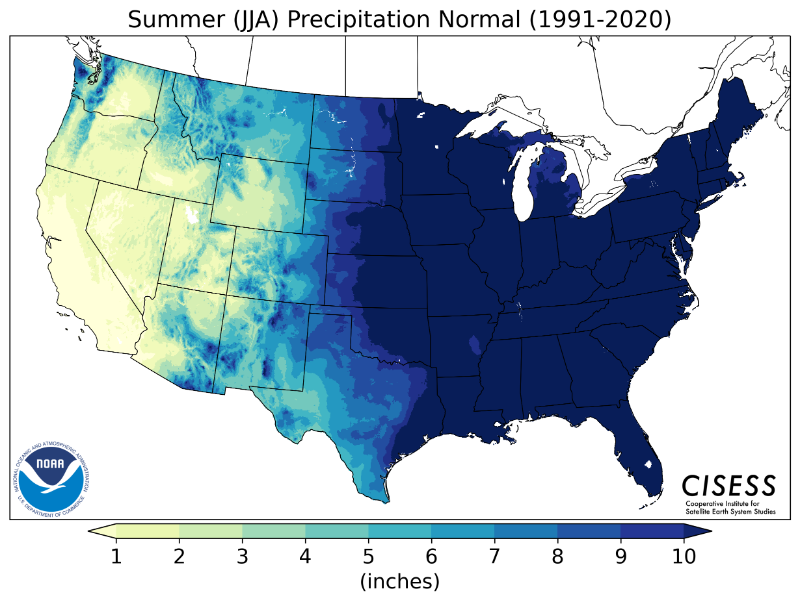 |
 |
 |
 |
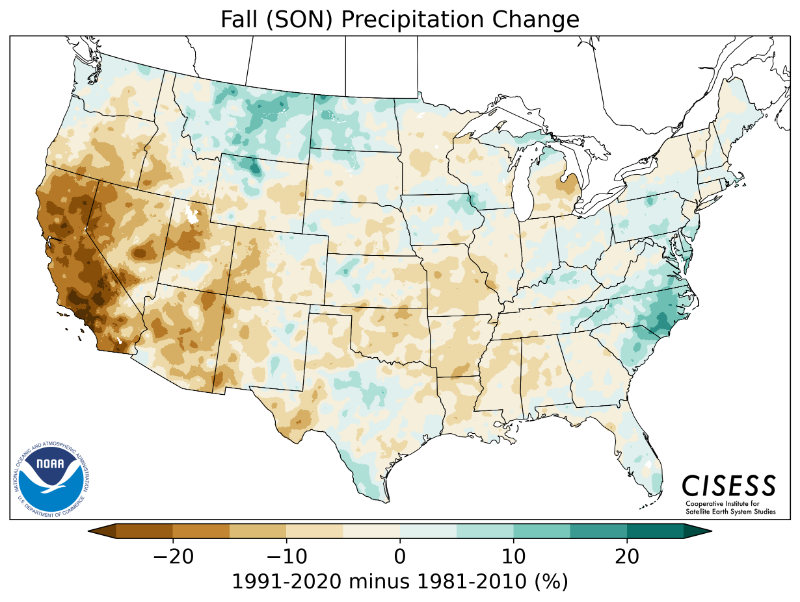
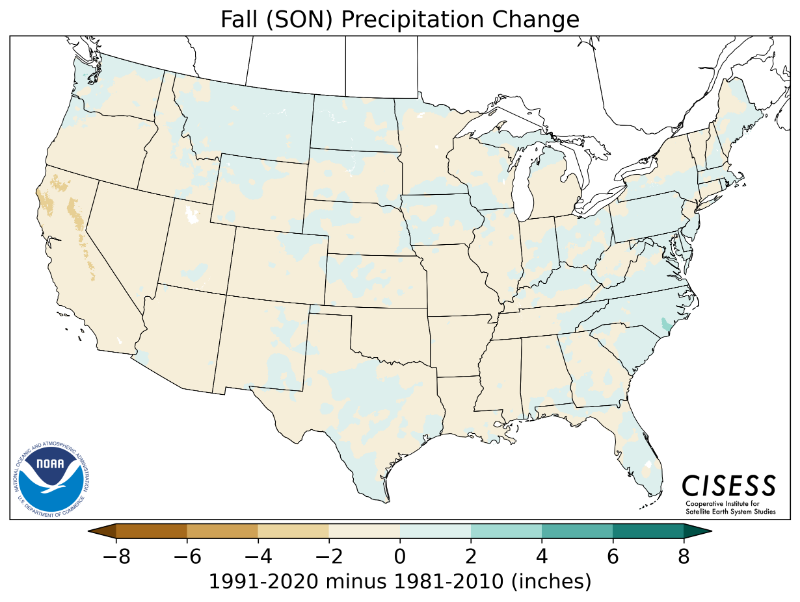
| Autumn | 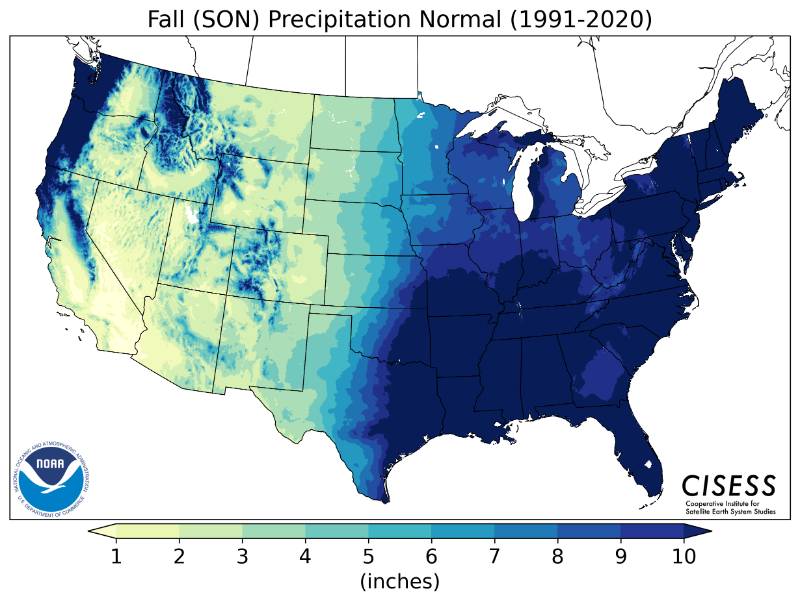 |
 |
 |
 |
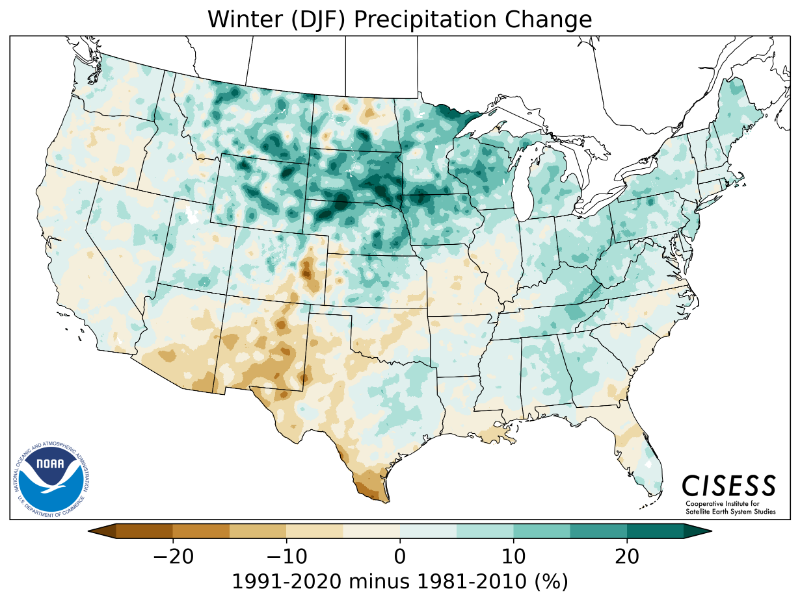
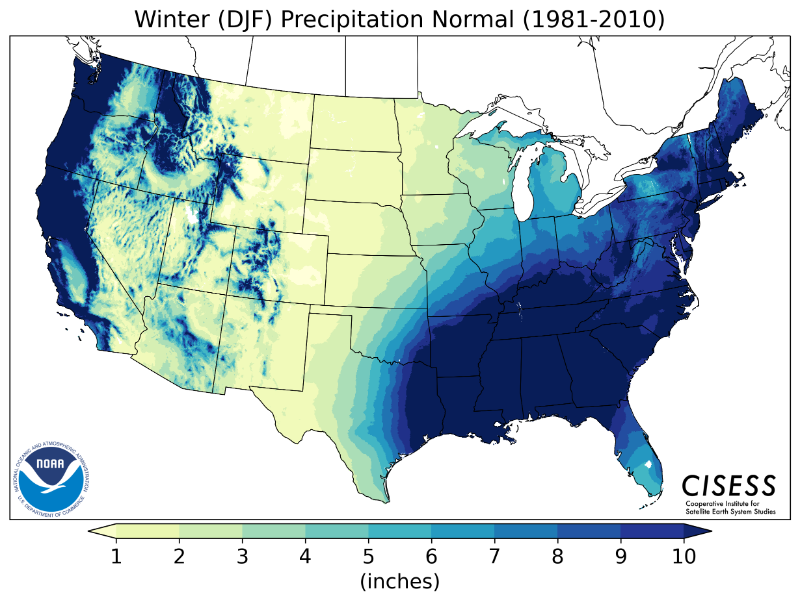
| Winter | 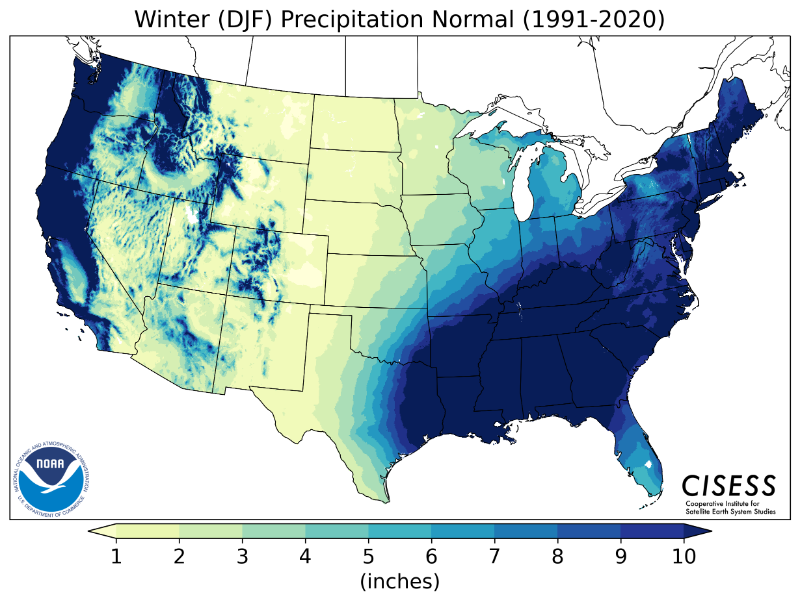 |
 |
 |
 |
| MONTHLY | ||||
| Difference Between Old and New | ||||
| 1991-2020 | Percentage Change | Value Difference | 1981-2010 | |
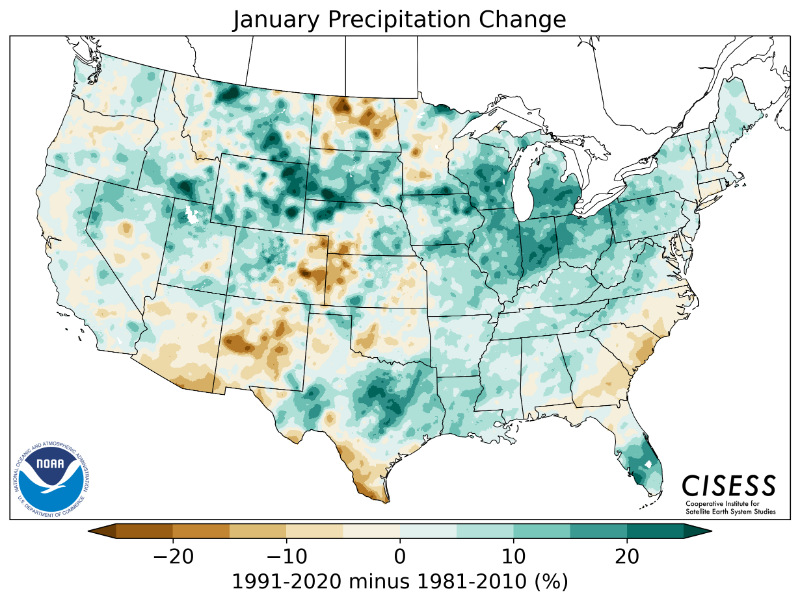
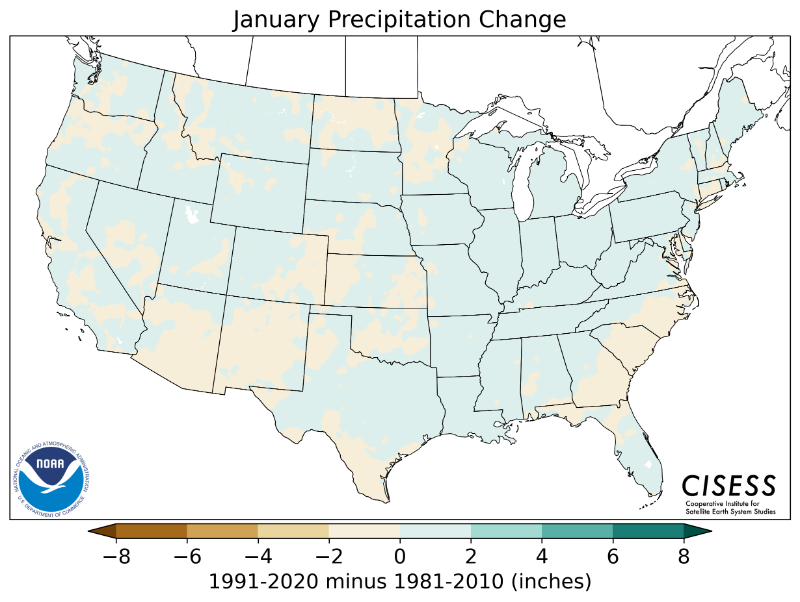
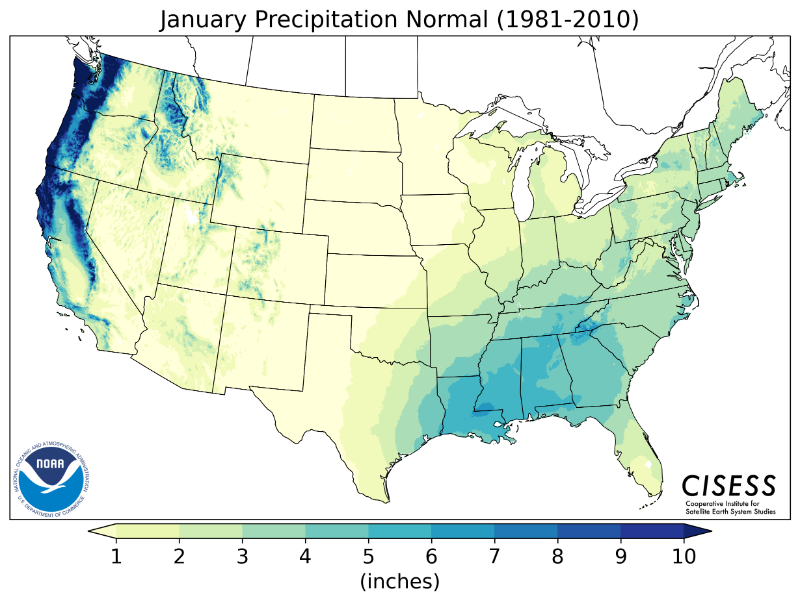
| January | 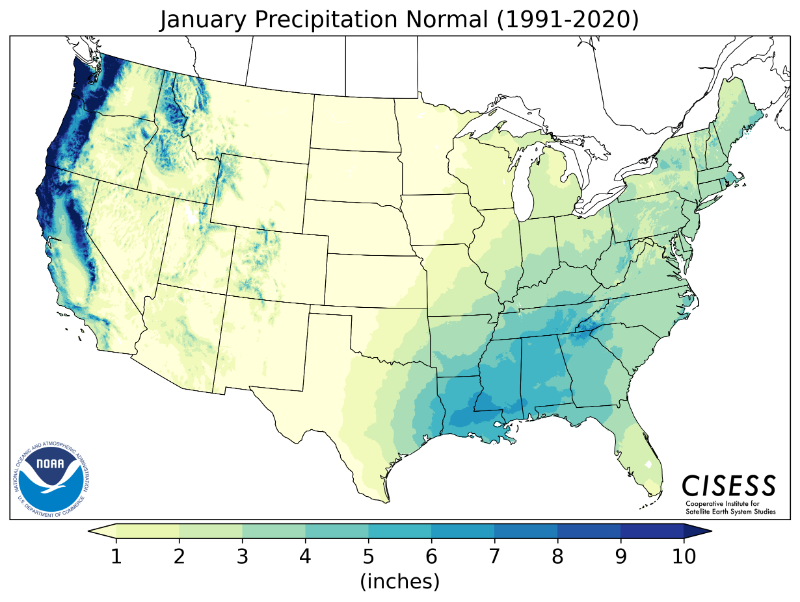 |
 |
 |
 |
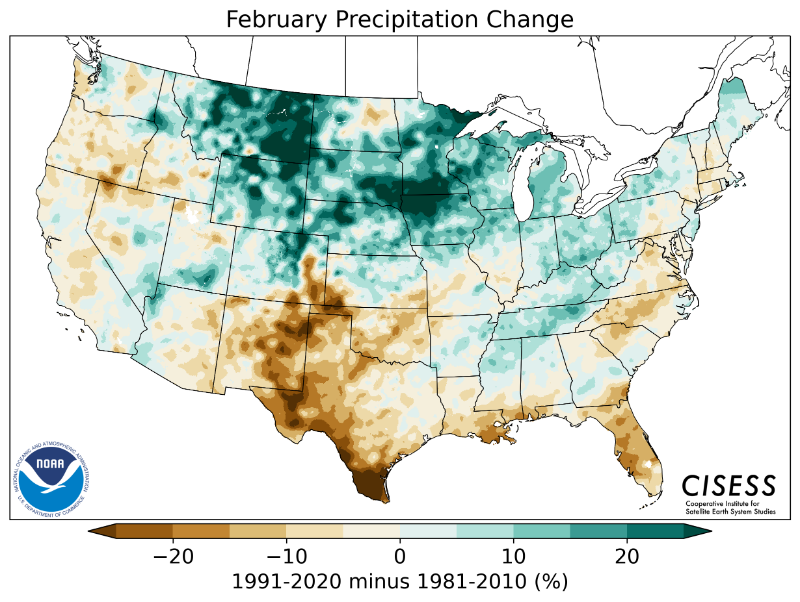
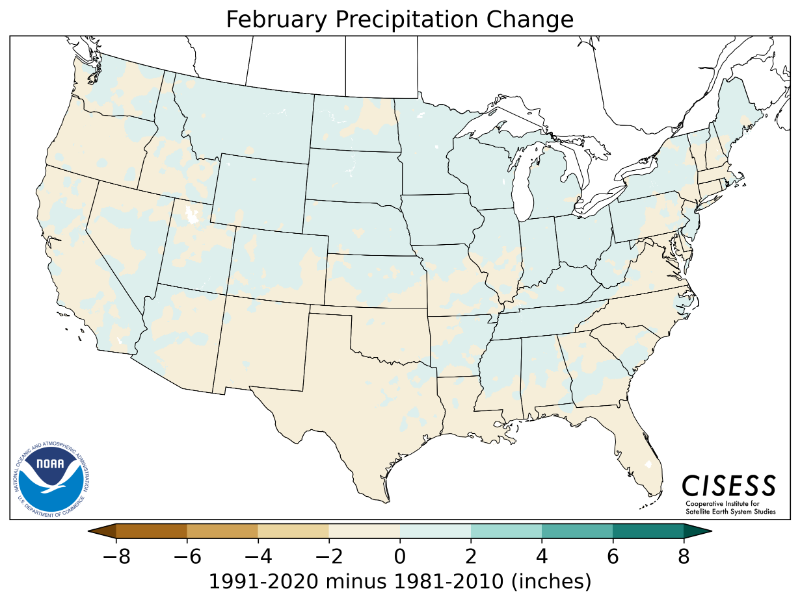
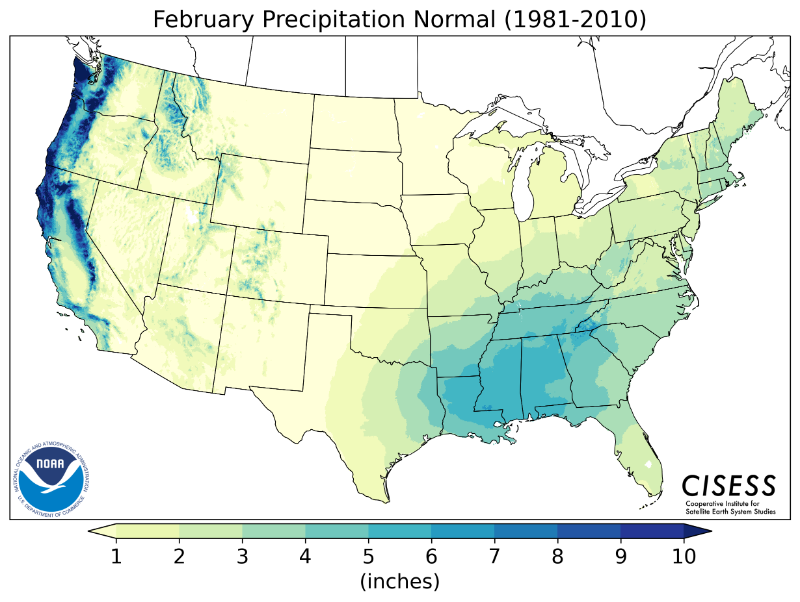
| February | 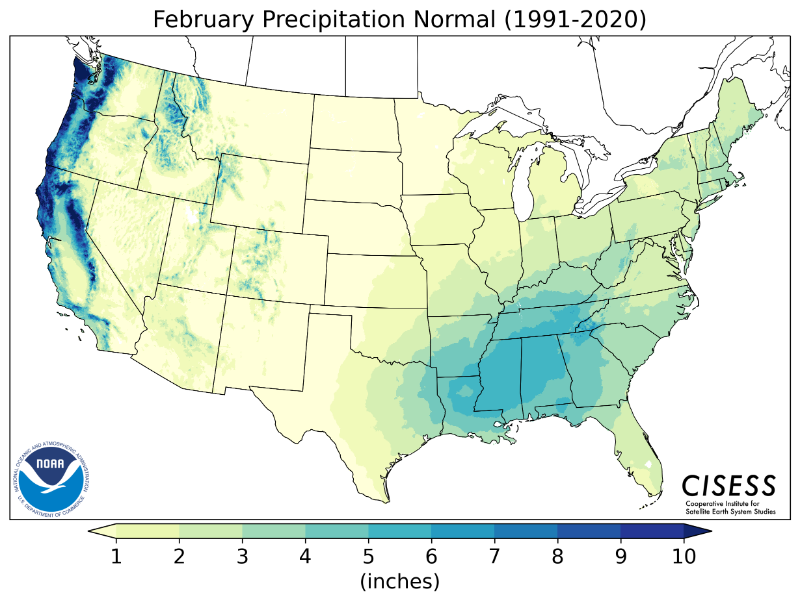 |
 |
 |
 |
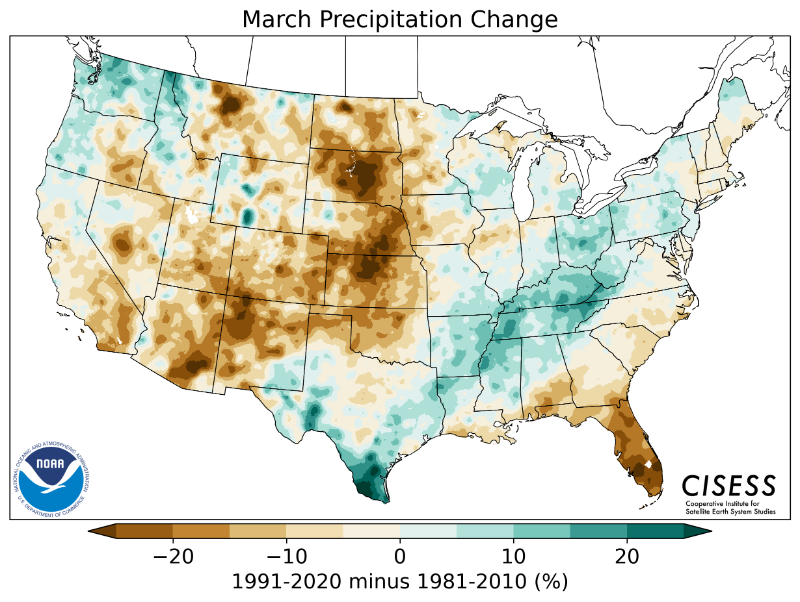
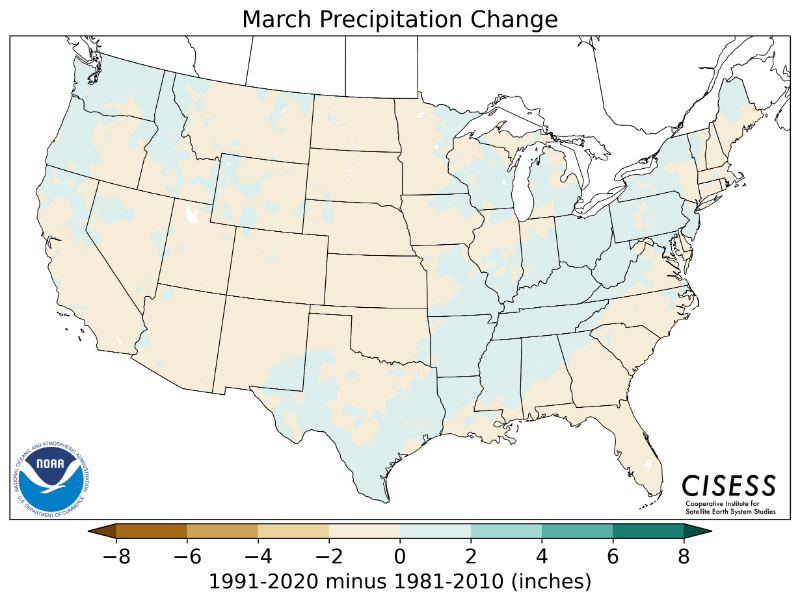
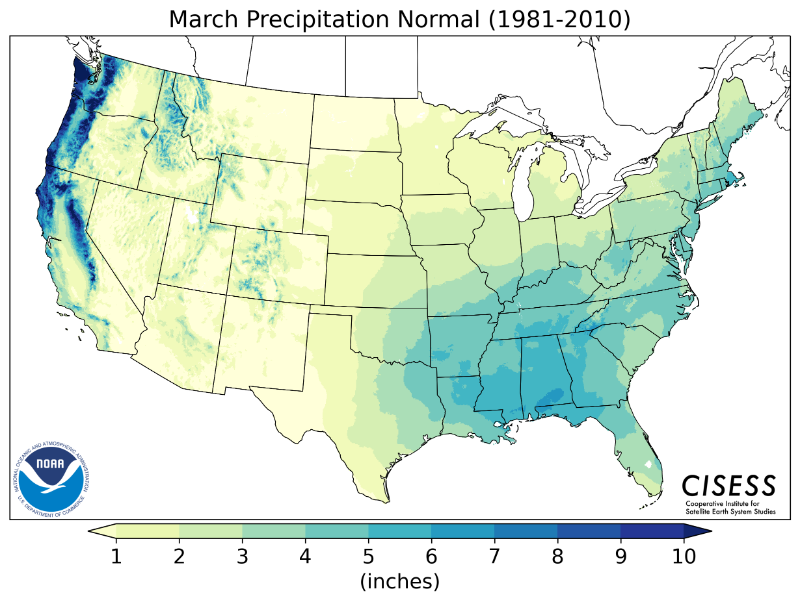
| March | 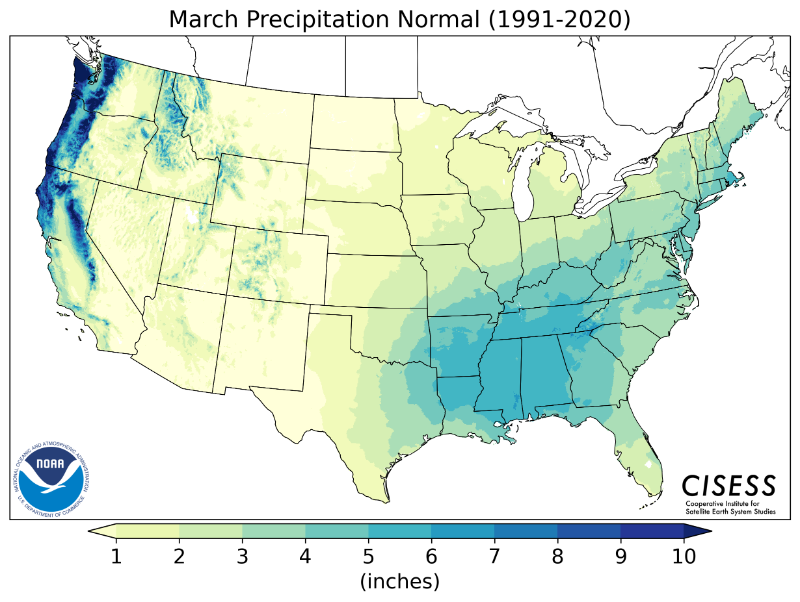 |
 |
 |
 |
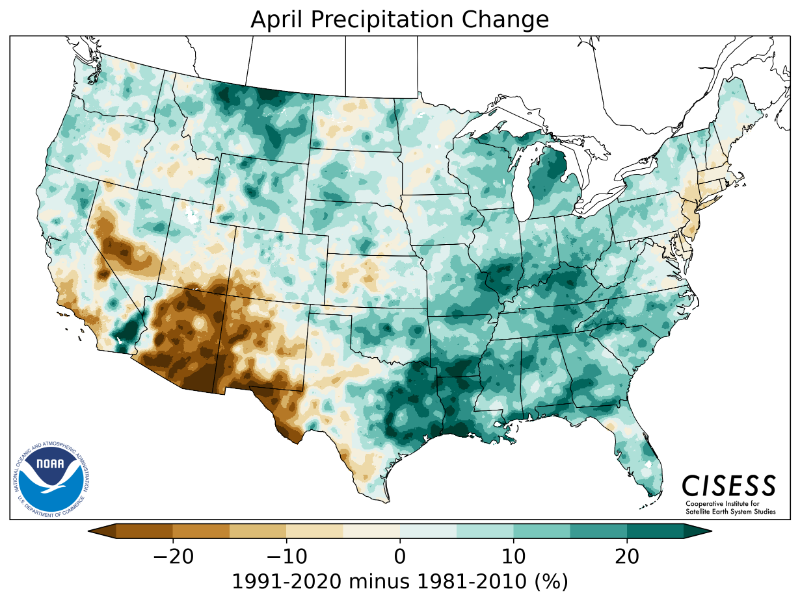
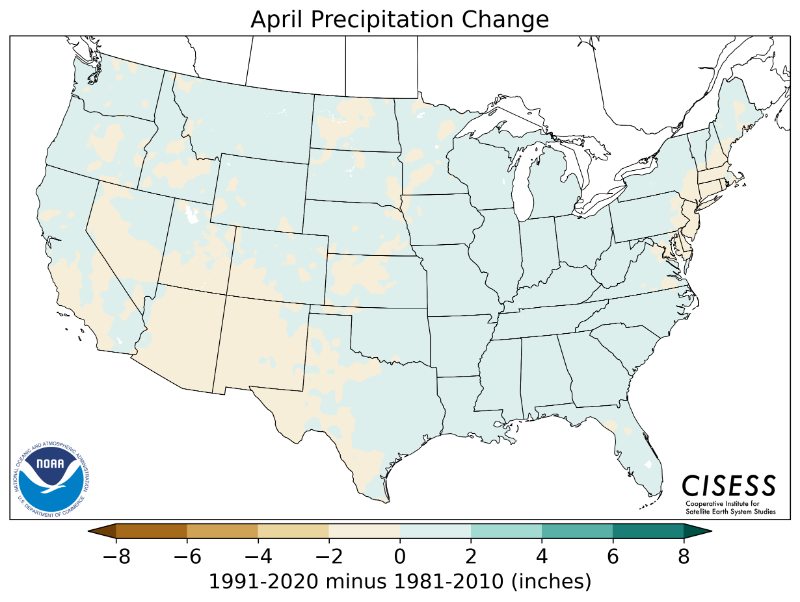
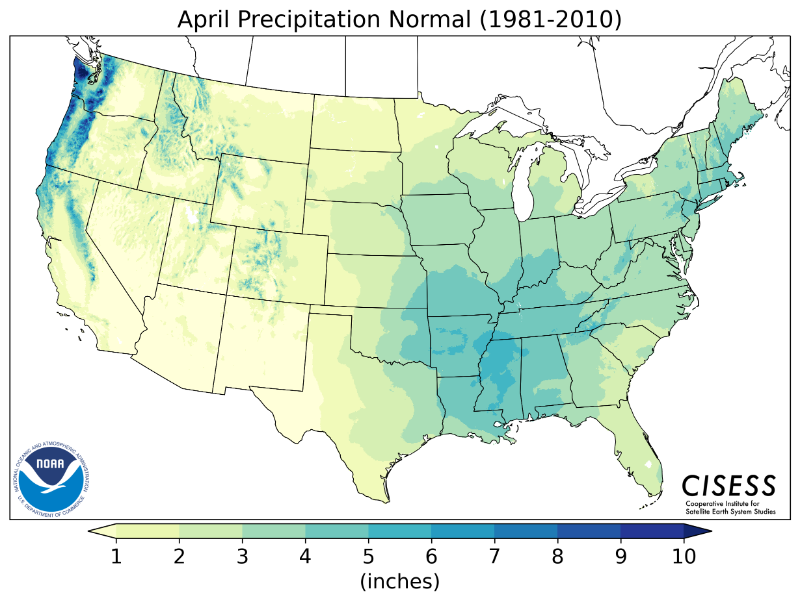
| April | 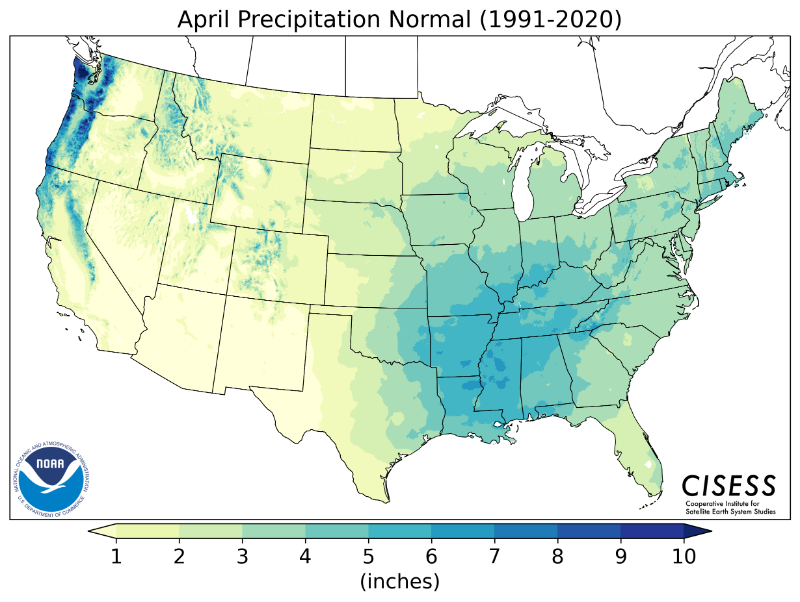 |
 |
 |
 |
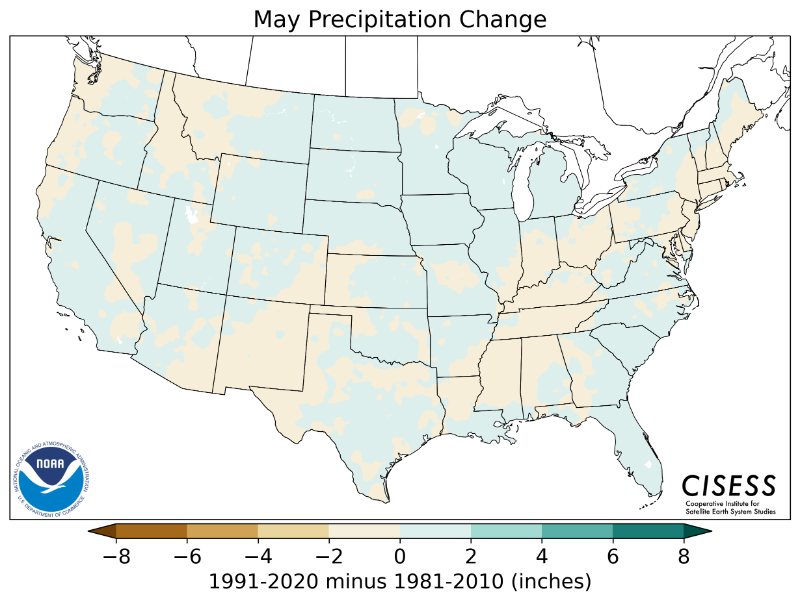
| May | 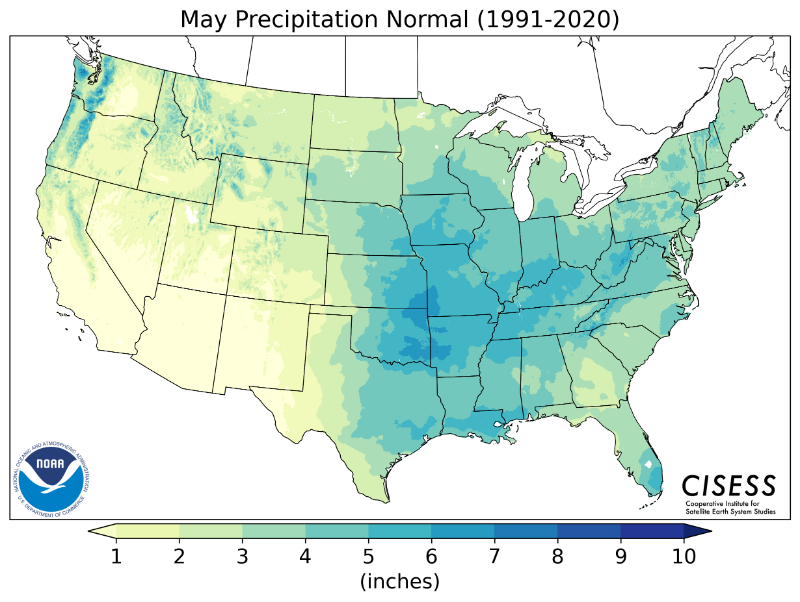 |
 |
 |
 |
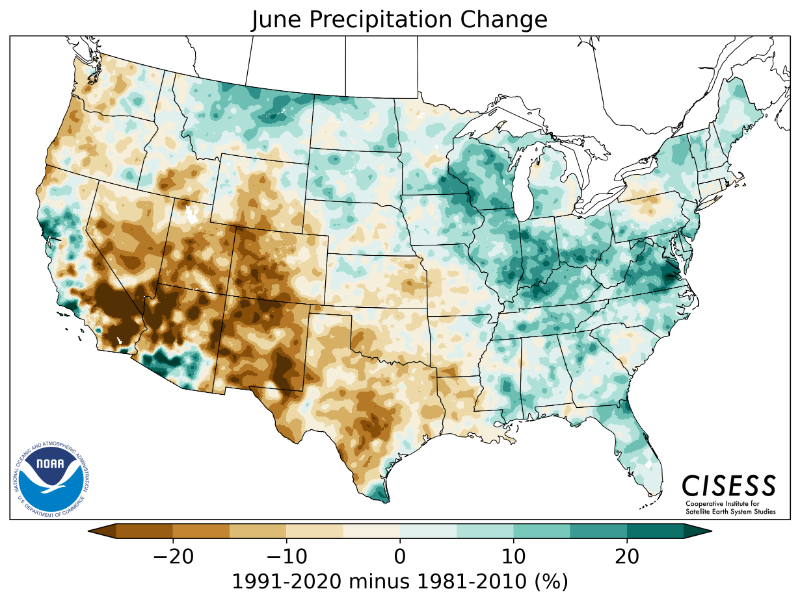
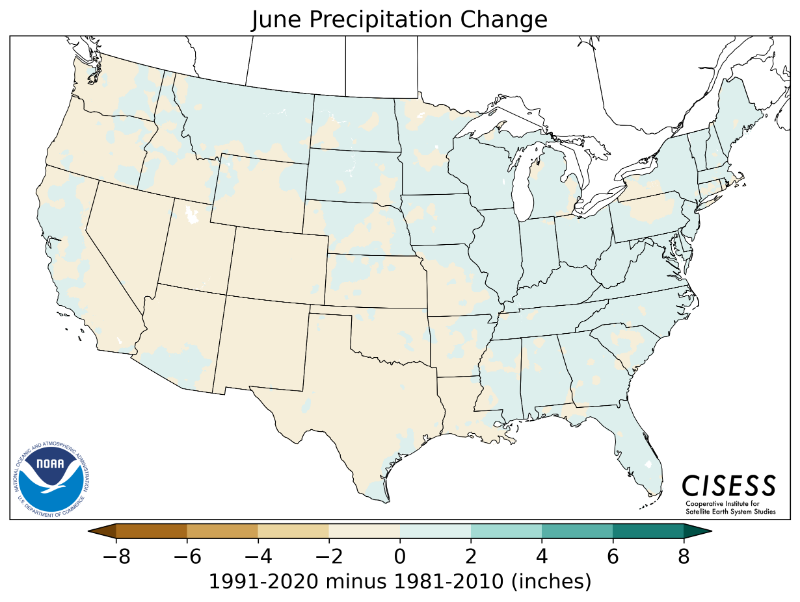
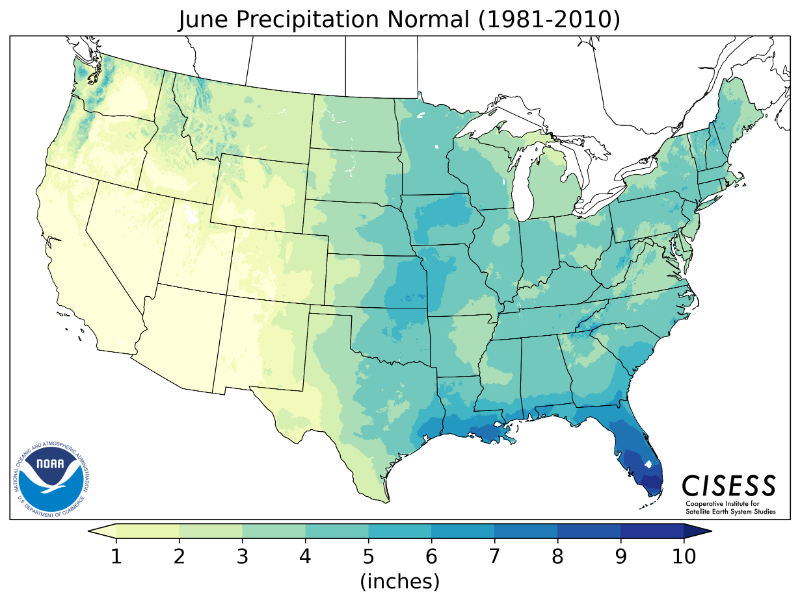
| June | 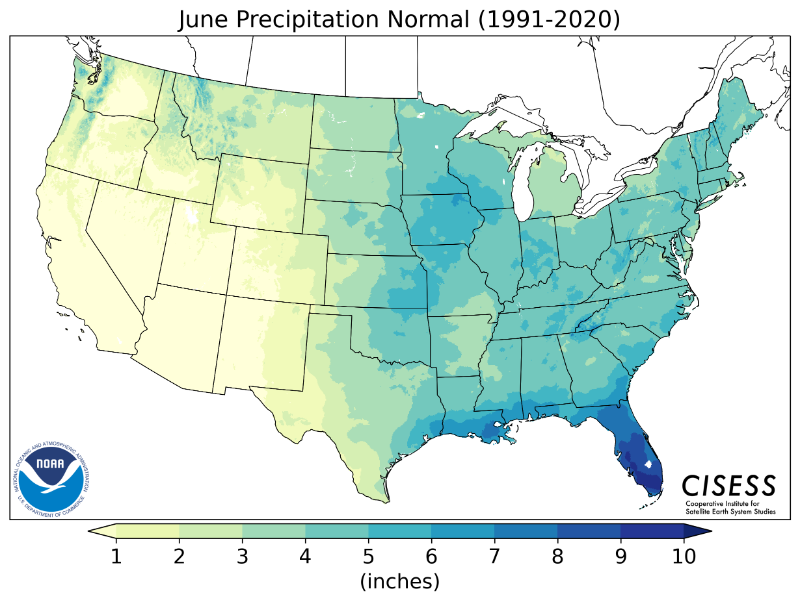 |
 |
 |
 |
| July | 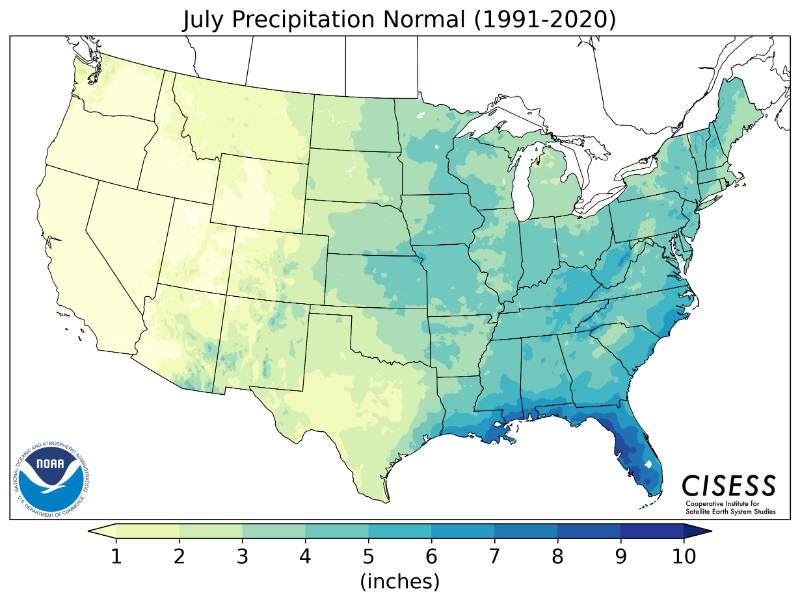 |
 |
 |
 |
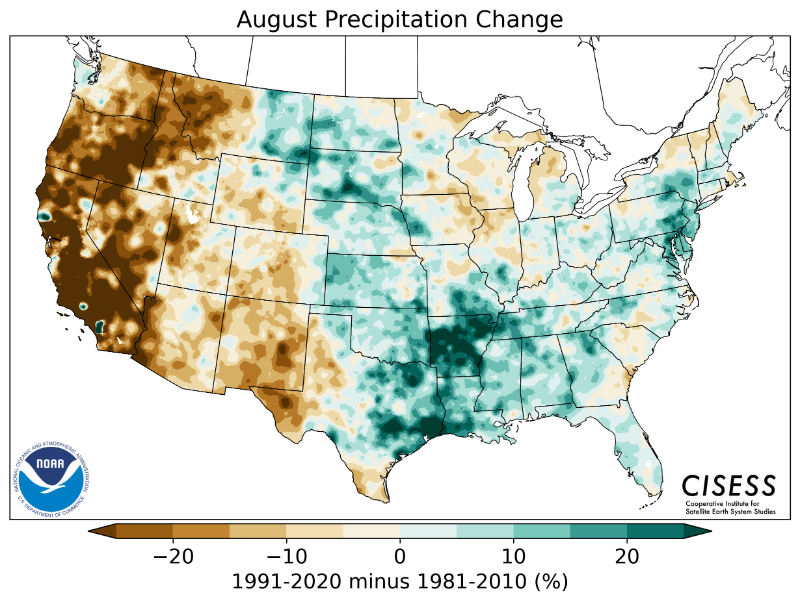
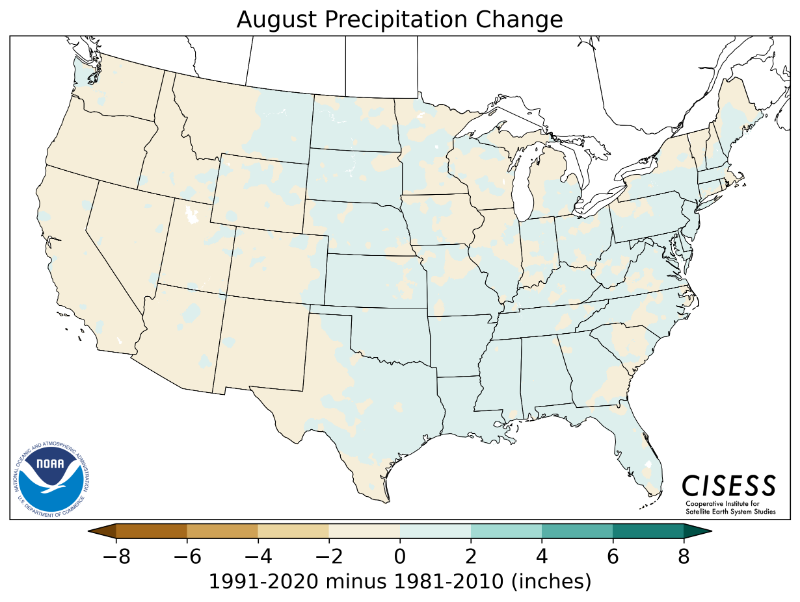
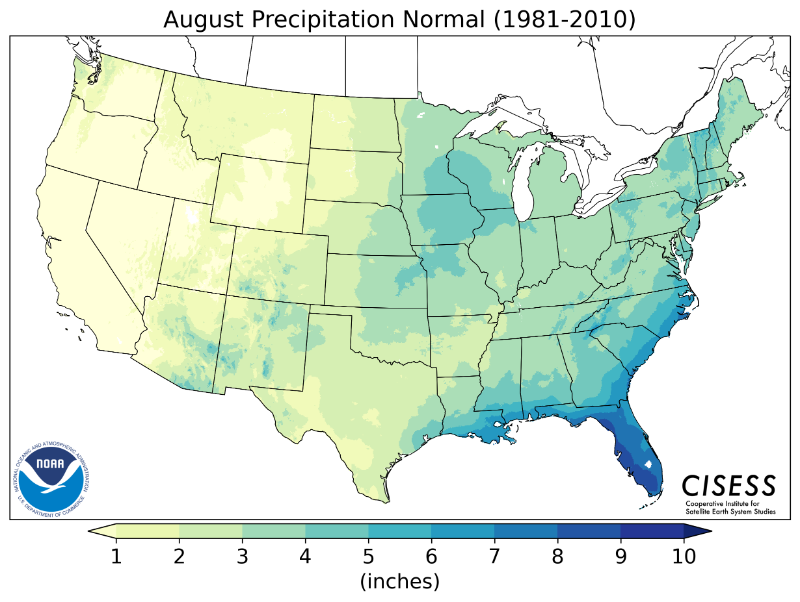
| August | 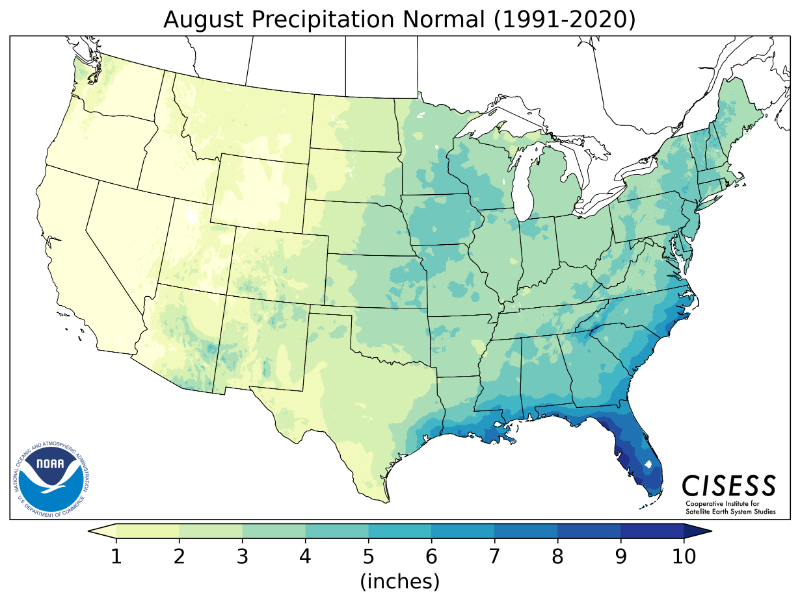 |
 |
 |
 |
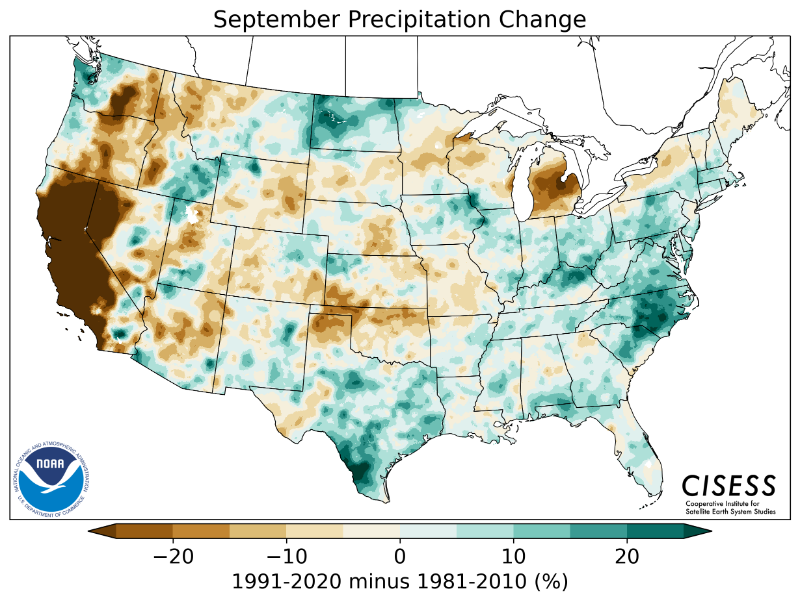
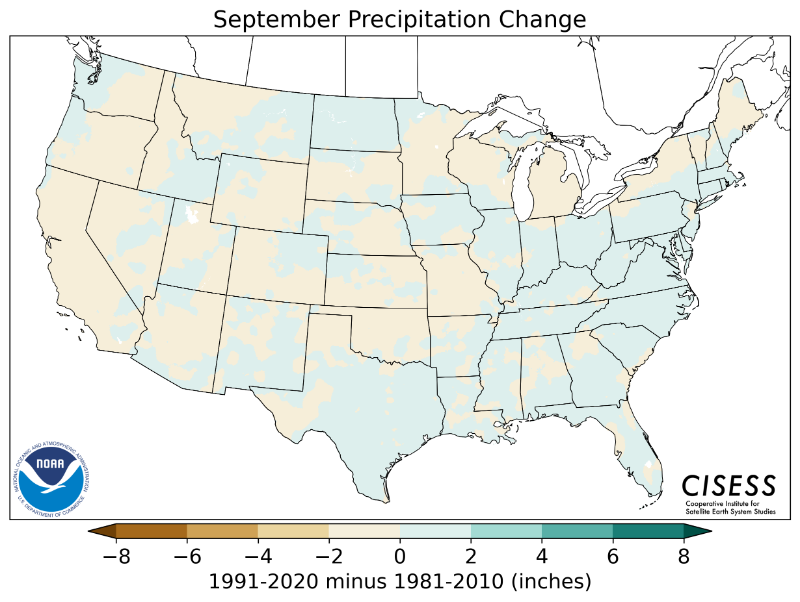
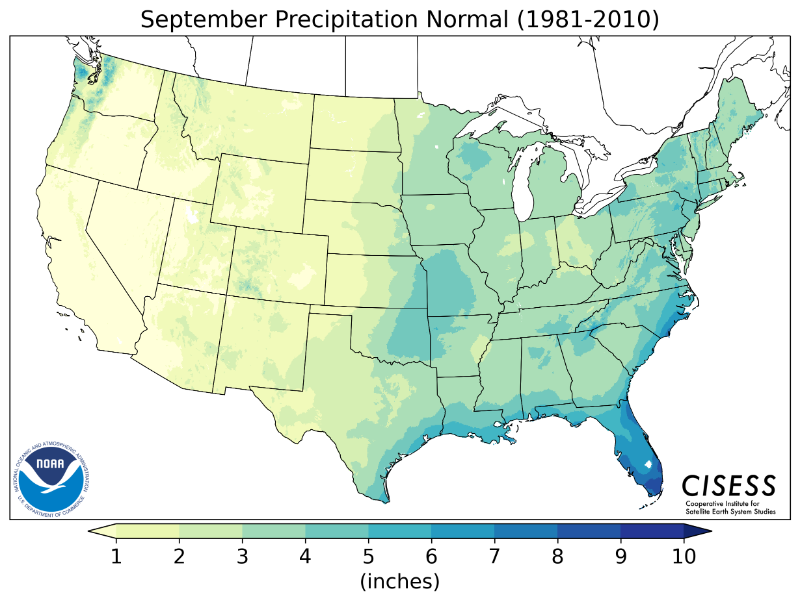
| September | 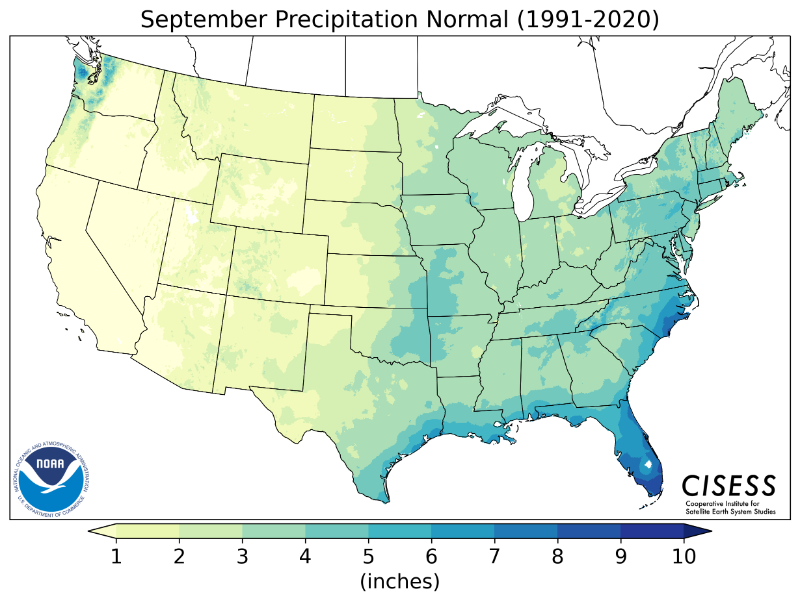 |
 |
 |
 |
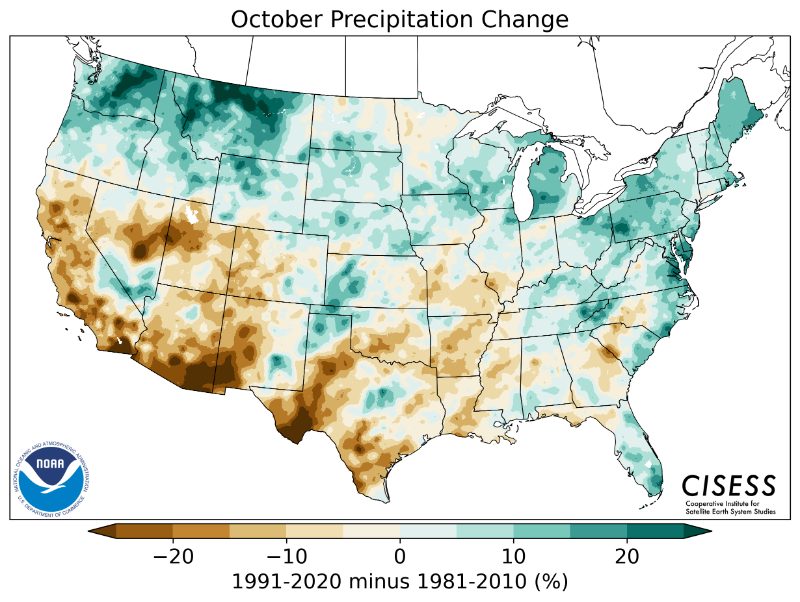
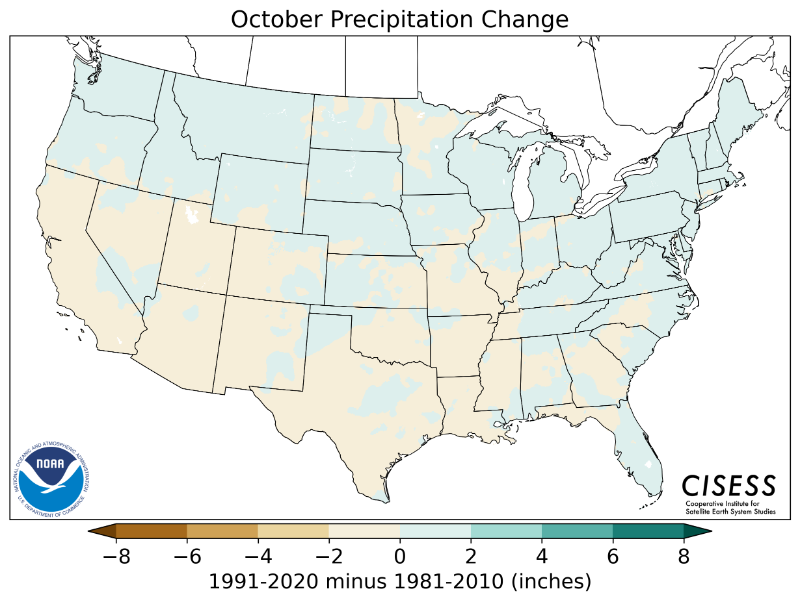
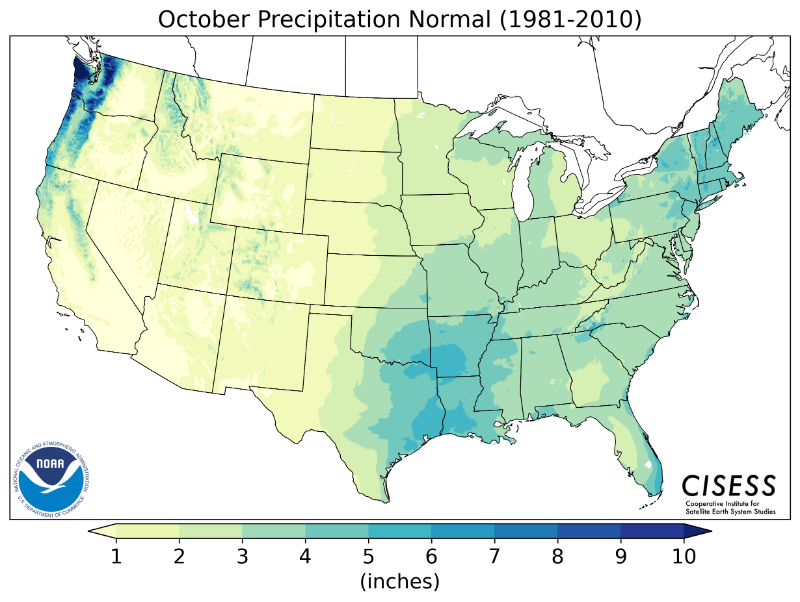
| October | 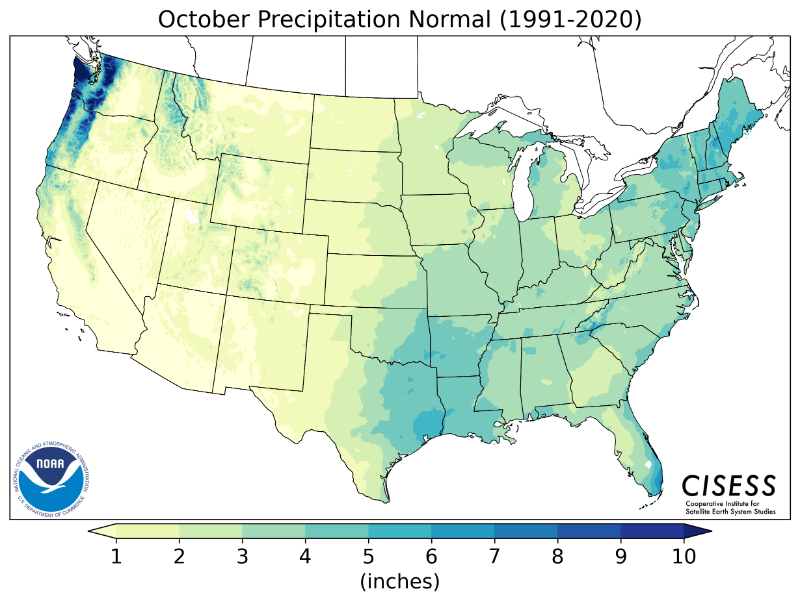 |
 |
 |
 |
| November | 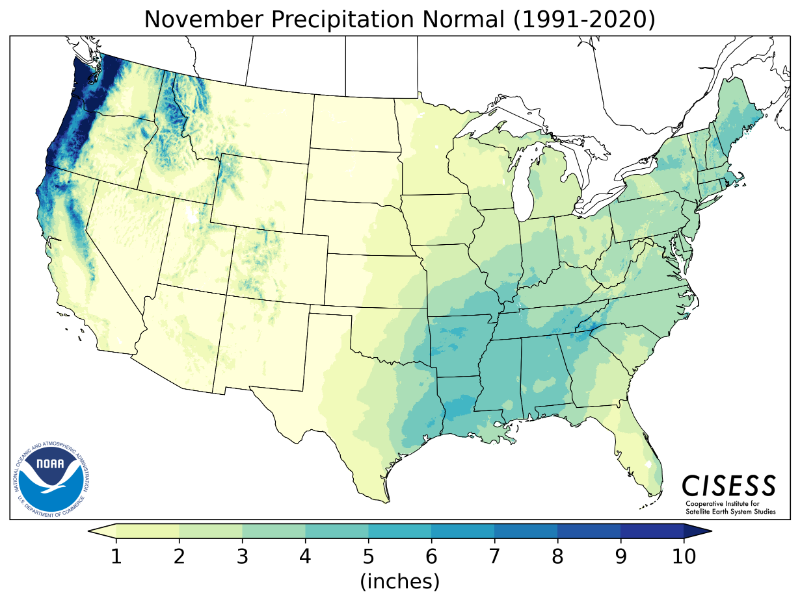 |
 |
 |
 |
| December |  |
 |
 |
 |
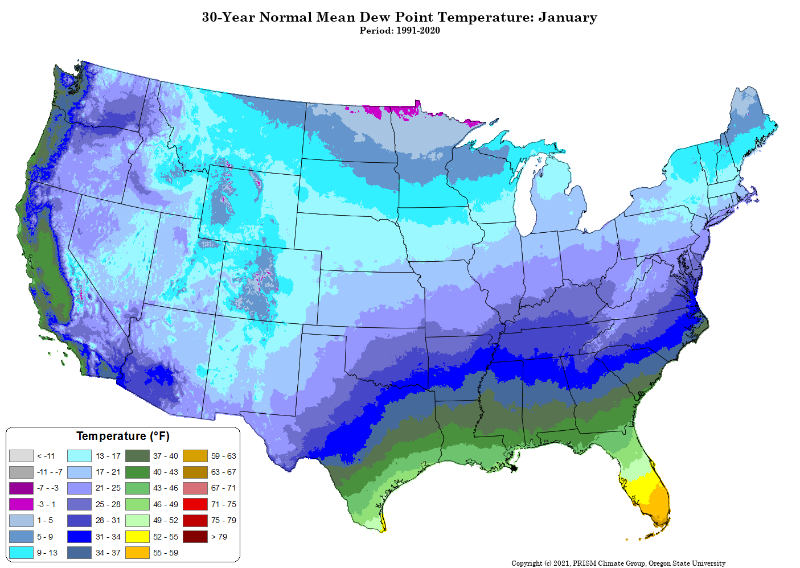
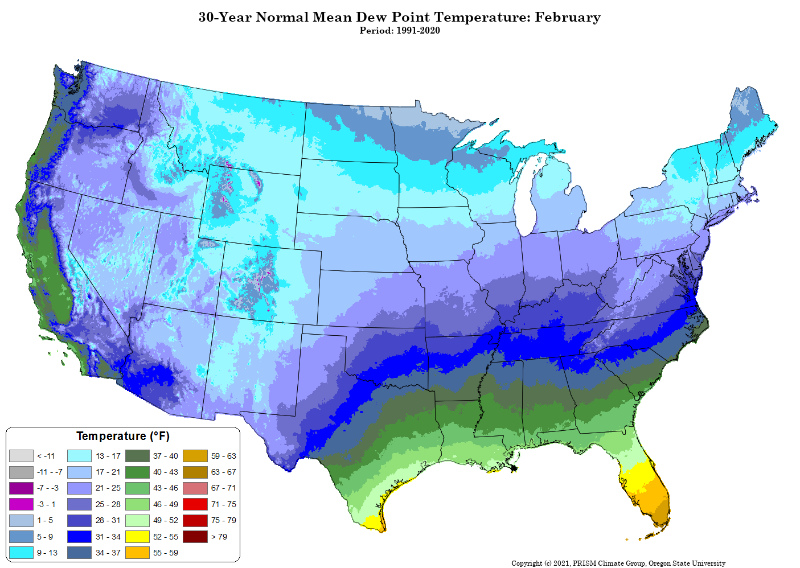
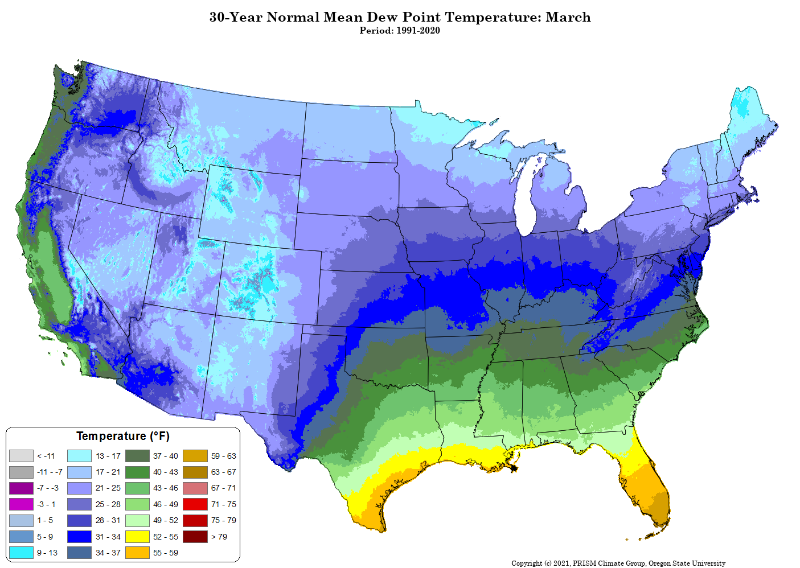
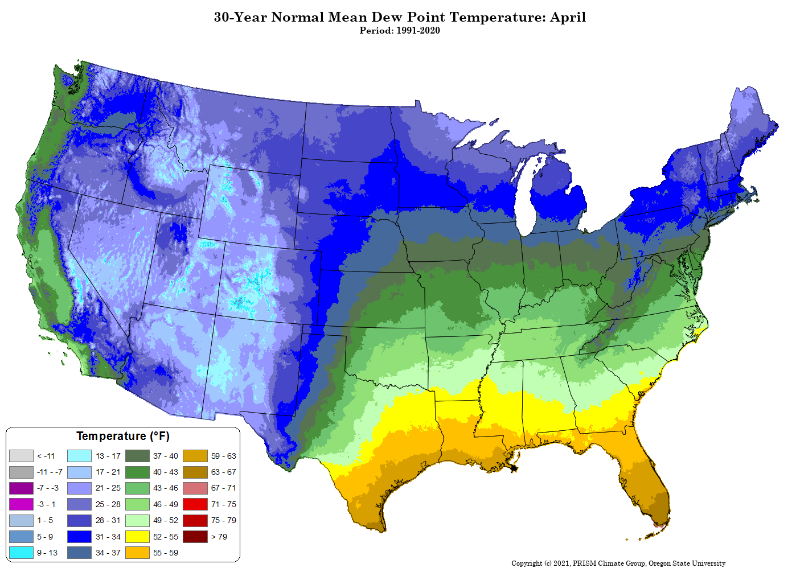
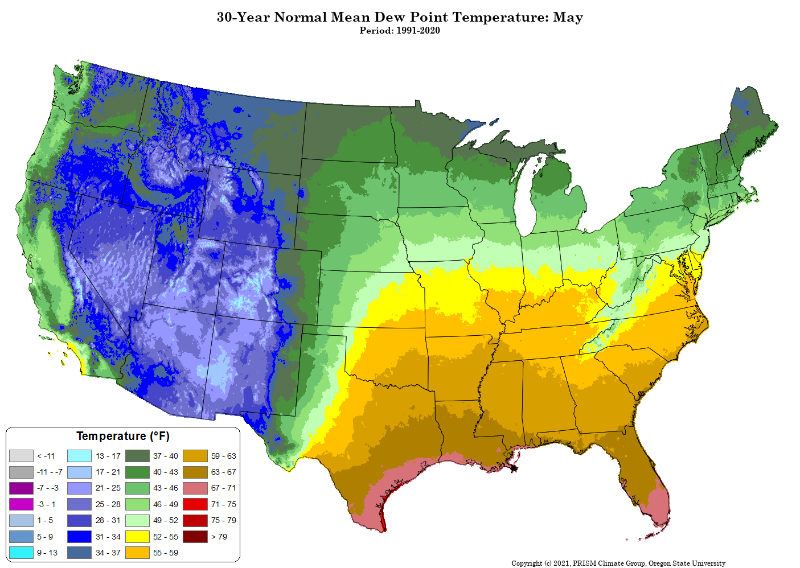
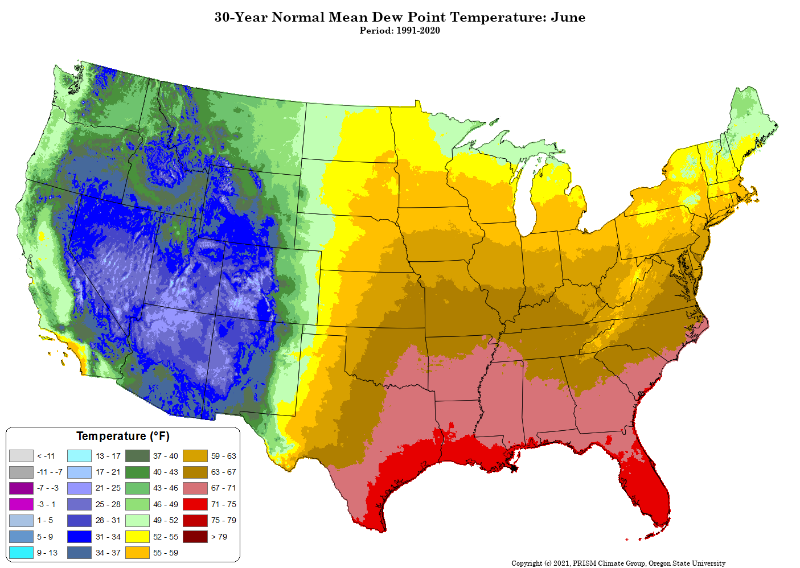
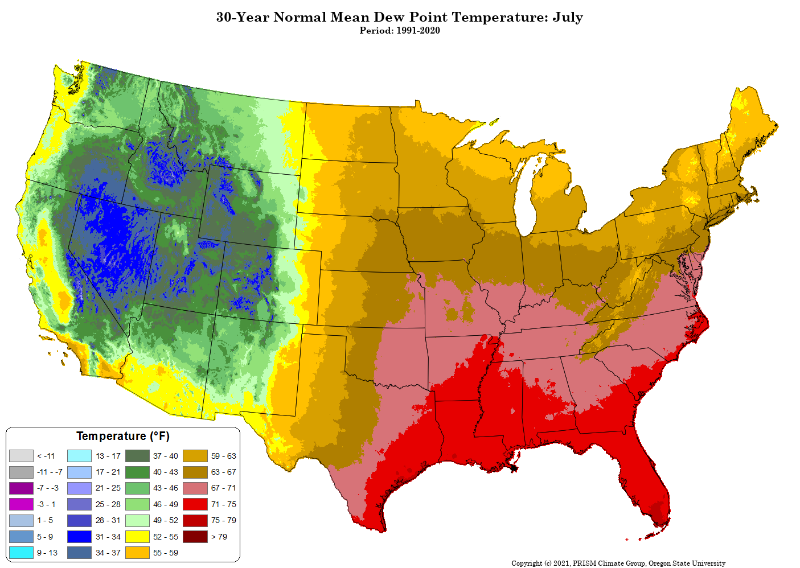
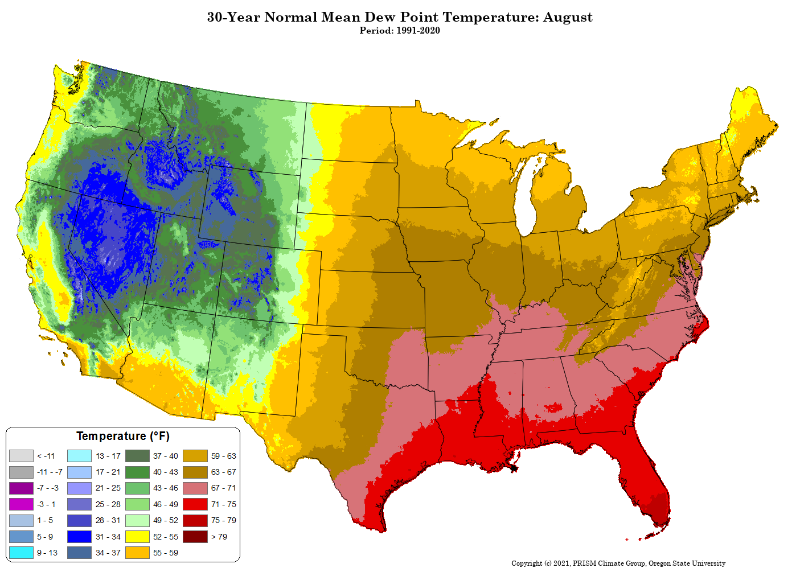
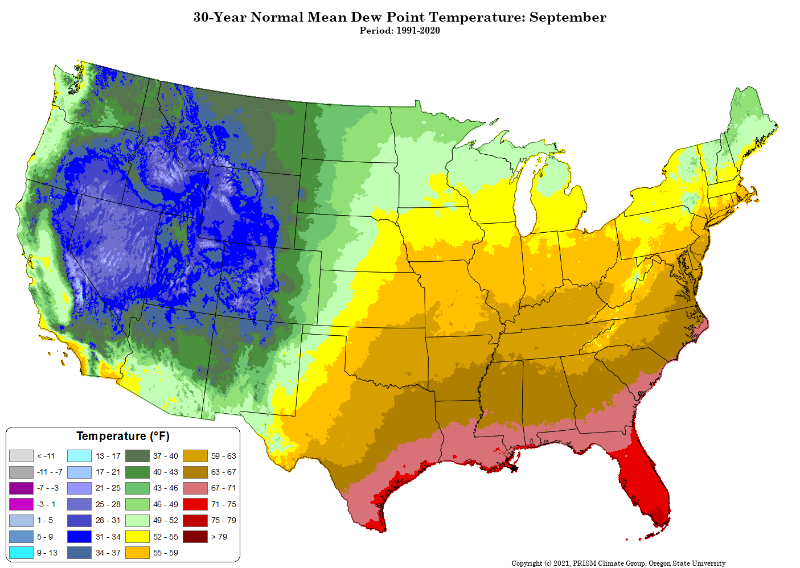
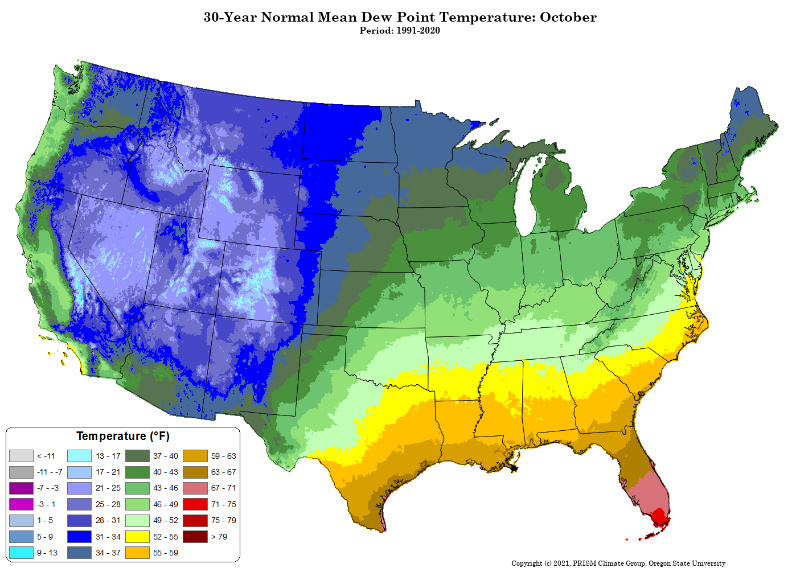
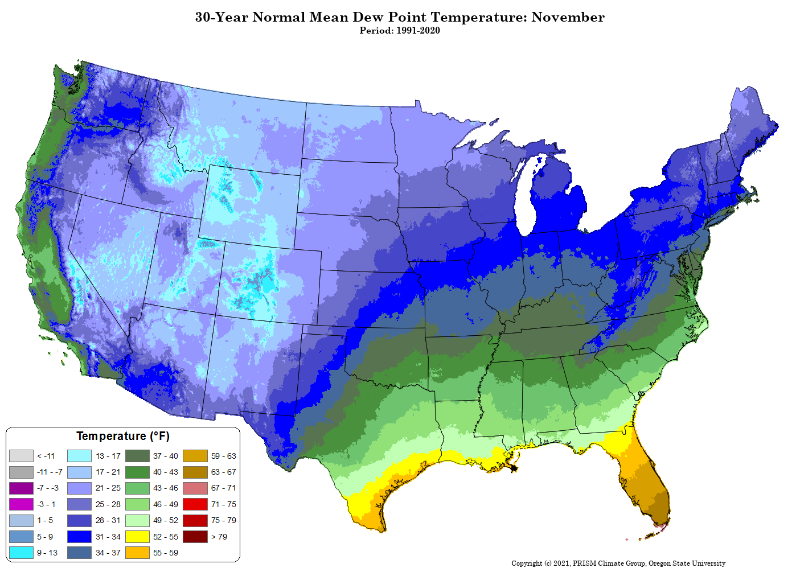
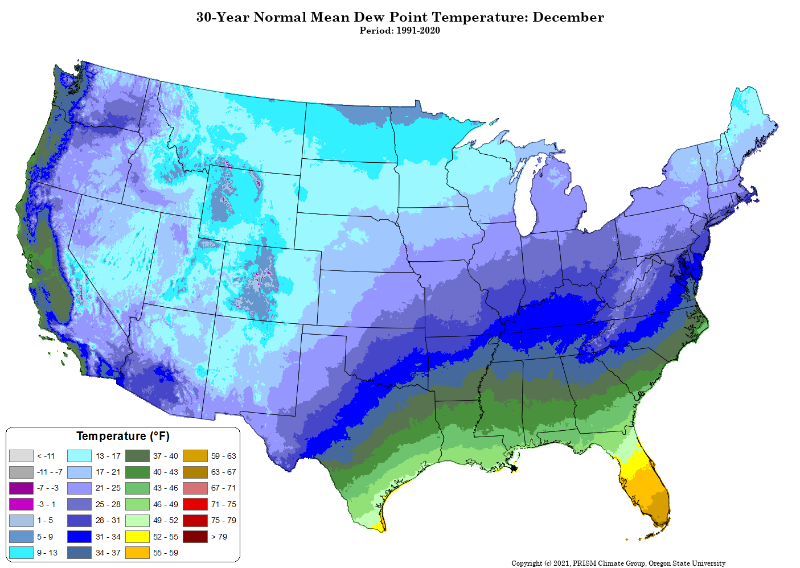
DEW POINT
The following maps are from the PRISM Climate Group at Oregon State University
| January | February | March | April |
 |
 |
 |
 |
| May | June | July | August |
 |
 |
 |
 |
| September | October | November | December |
 |
 |
 |
 |


 Weather Story
 Weather Map
 Local Radar