

Overview
Clicking on any image will expand it. To submit feedback, please contact nws.stlouis@noaa.gov
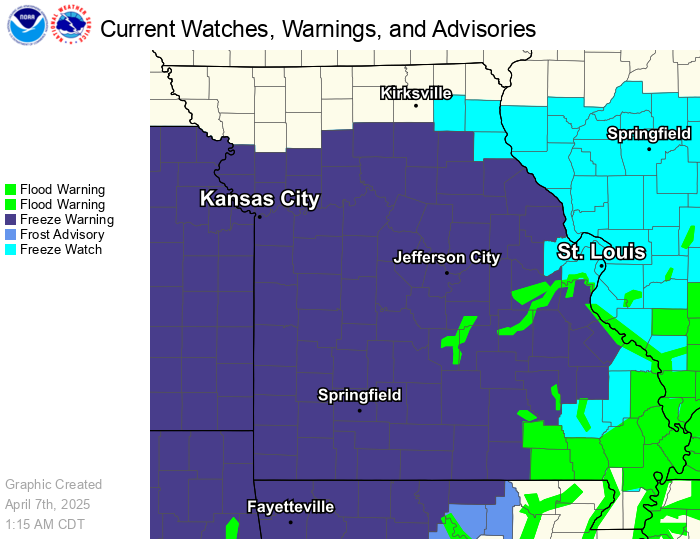
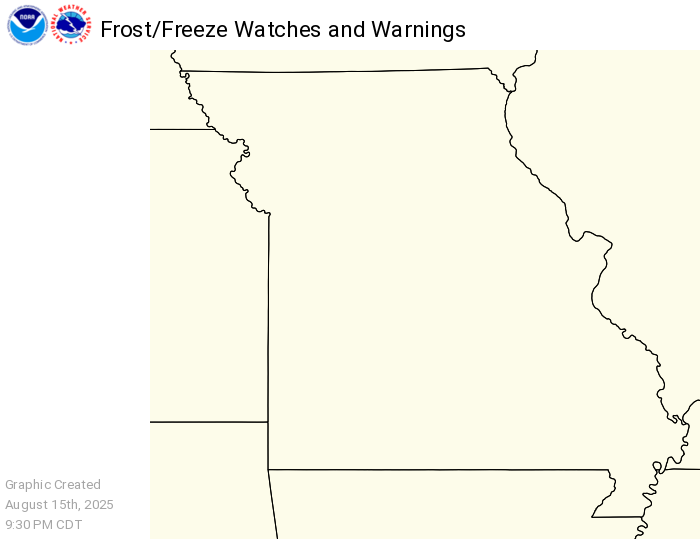
Watches, Warnings, and Advisories
 |
 |
 |
 |
|
|
|
|
|
 |
 |
 |
 |
|
|
|
|
|
 |
 |
 |
 |
|
|
|
|
|
Decision Support Services Briefing Packets
Springfield DSSPacket (link) |
Kansas City DSSPacket (link) |
St. Louis DSSPacket (link) |
Davenport DSSPacket (link) |
Paducah DSSPacket (link) |
Memphis DSSPacket (link) |
 |
Current Conditions
Local Radar
Surface Observations and Road Conditions
Current Surface Observations |
MODot Gateway Road Cameras |
MODoT Travel Map |
IDoT Travel Information |
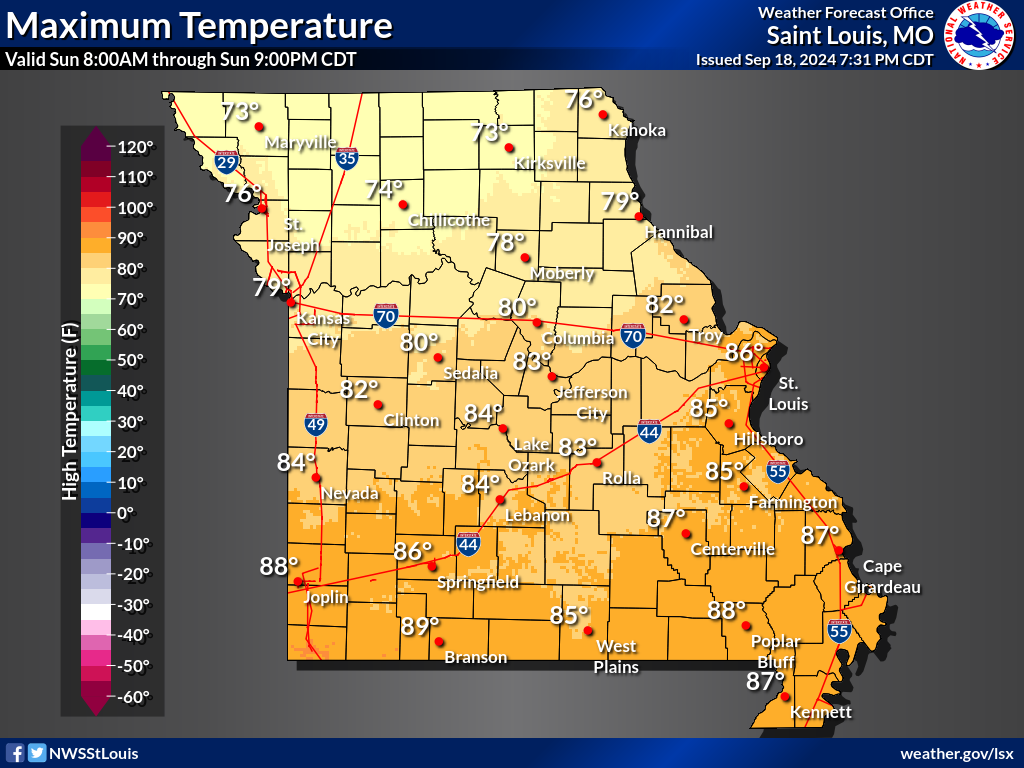
State Forecast
Day 1 Forecasts
 |
 |
 |
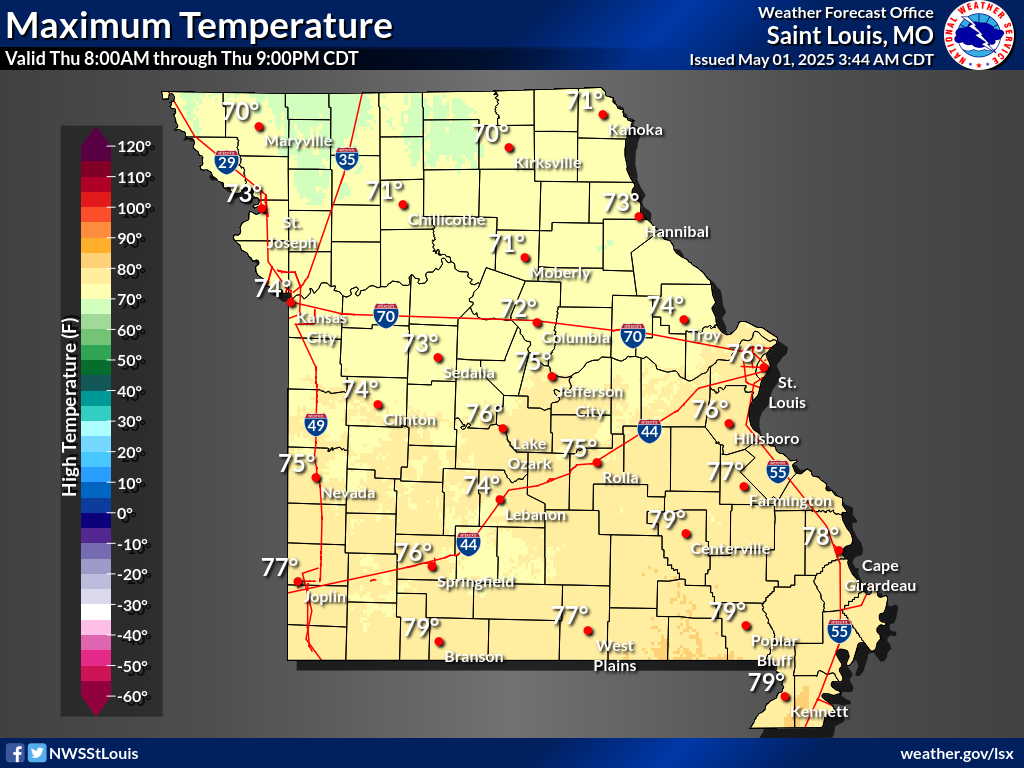
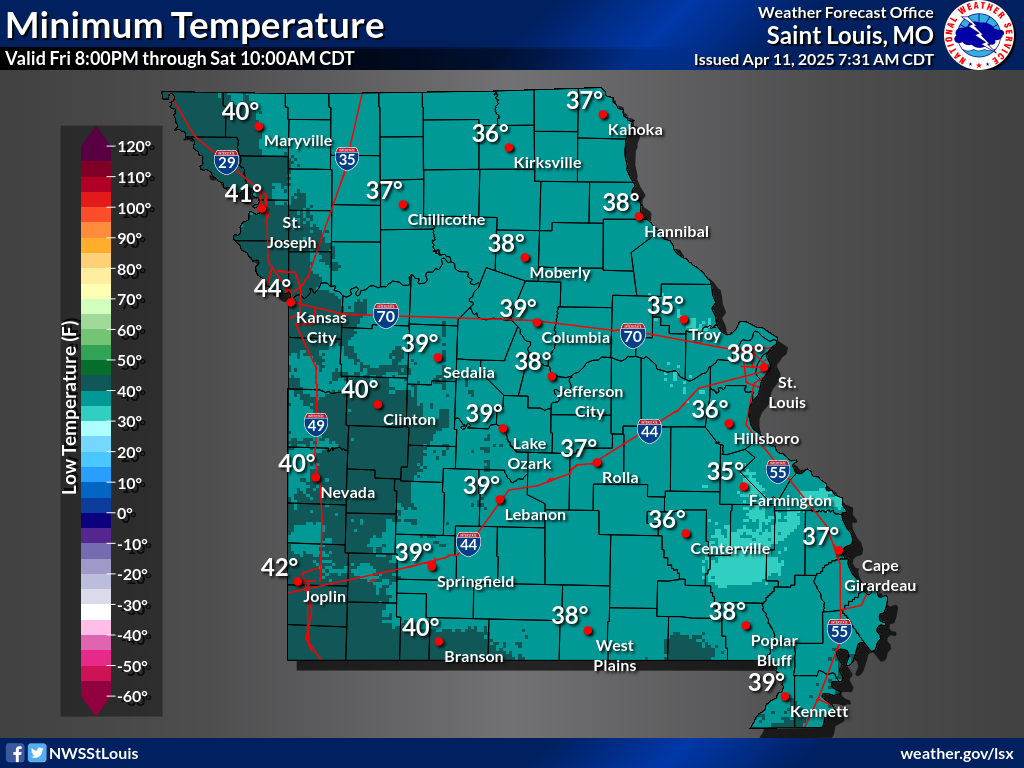
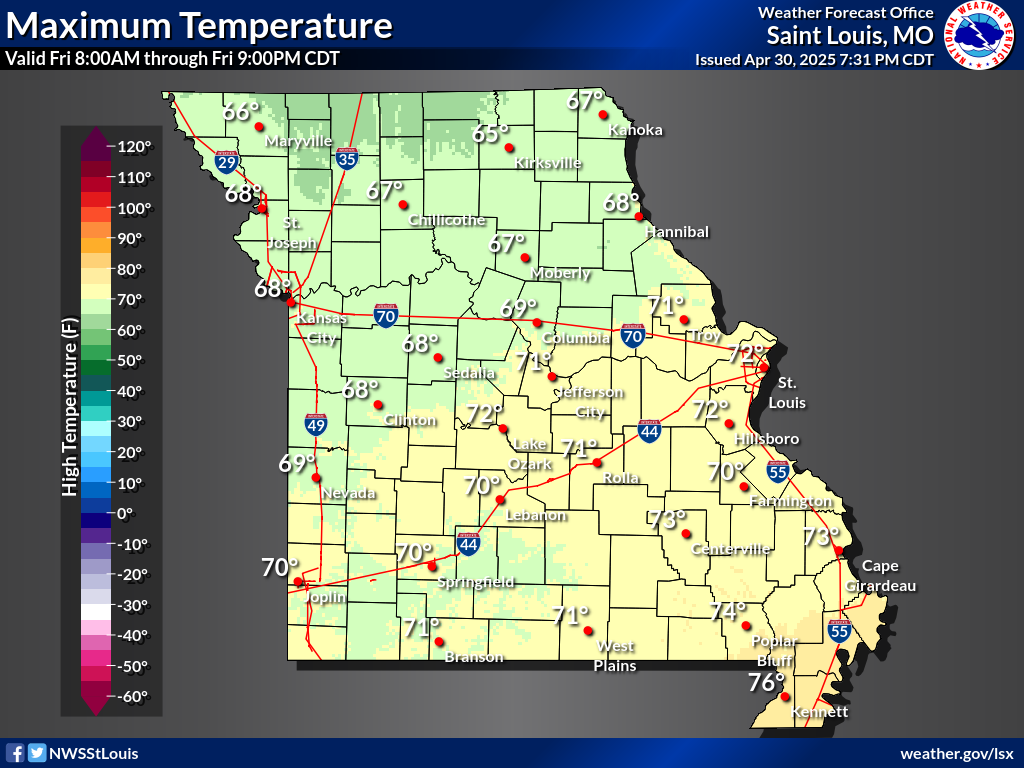
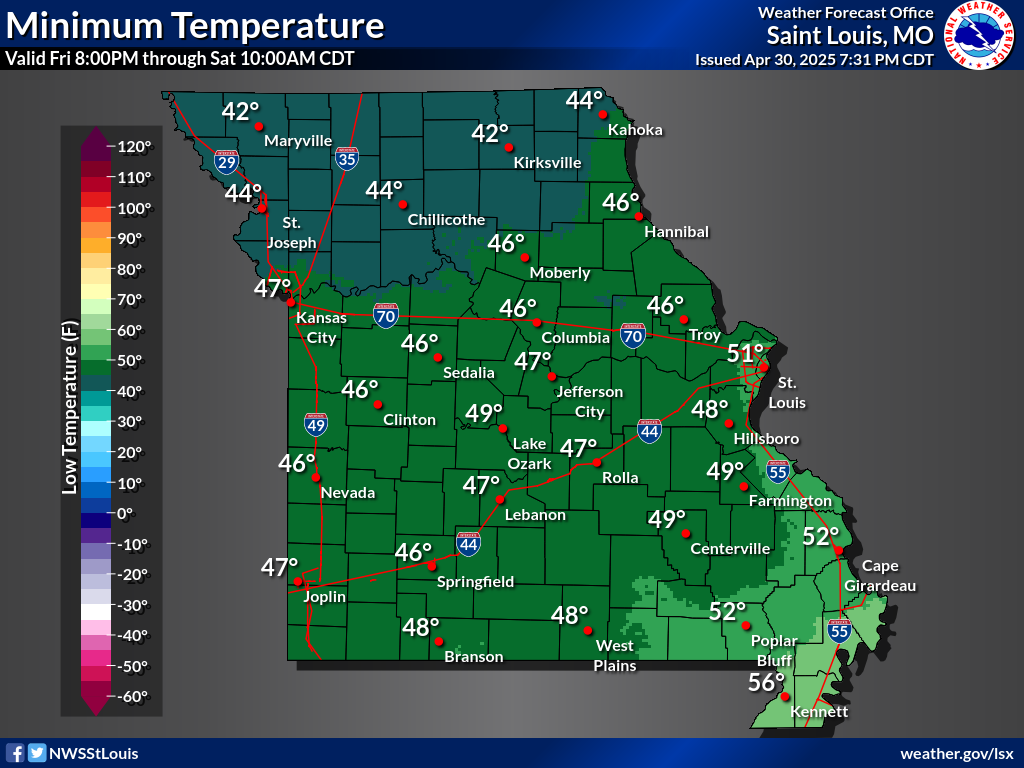
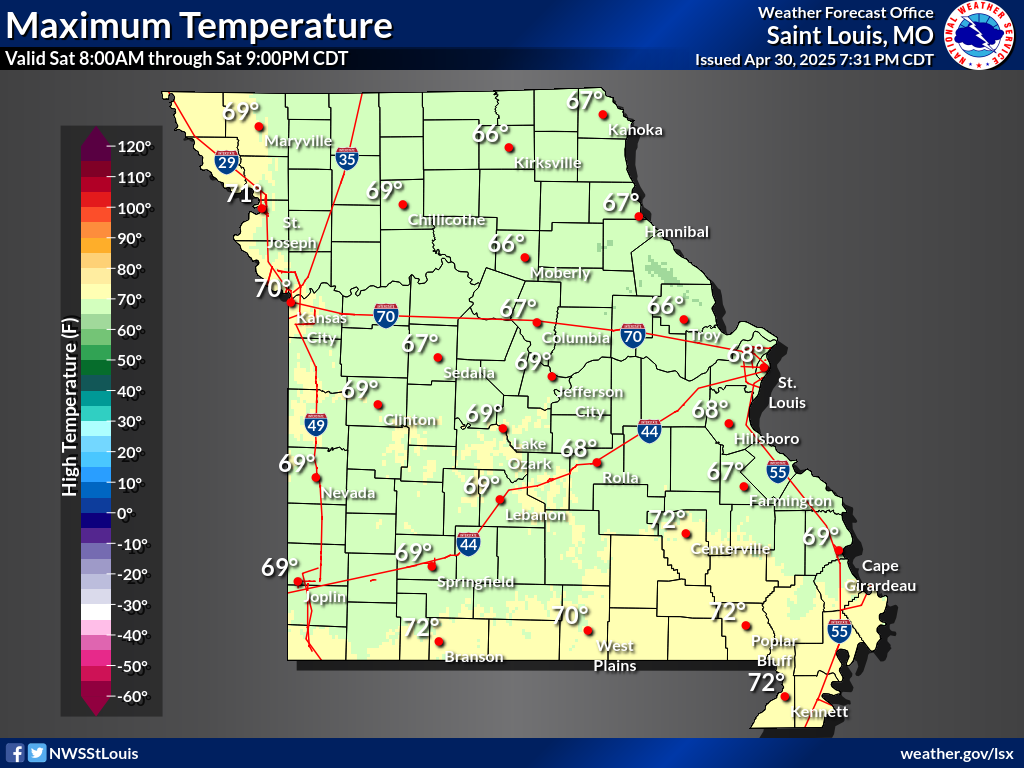
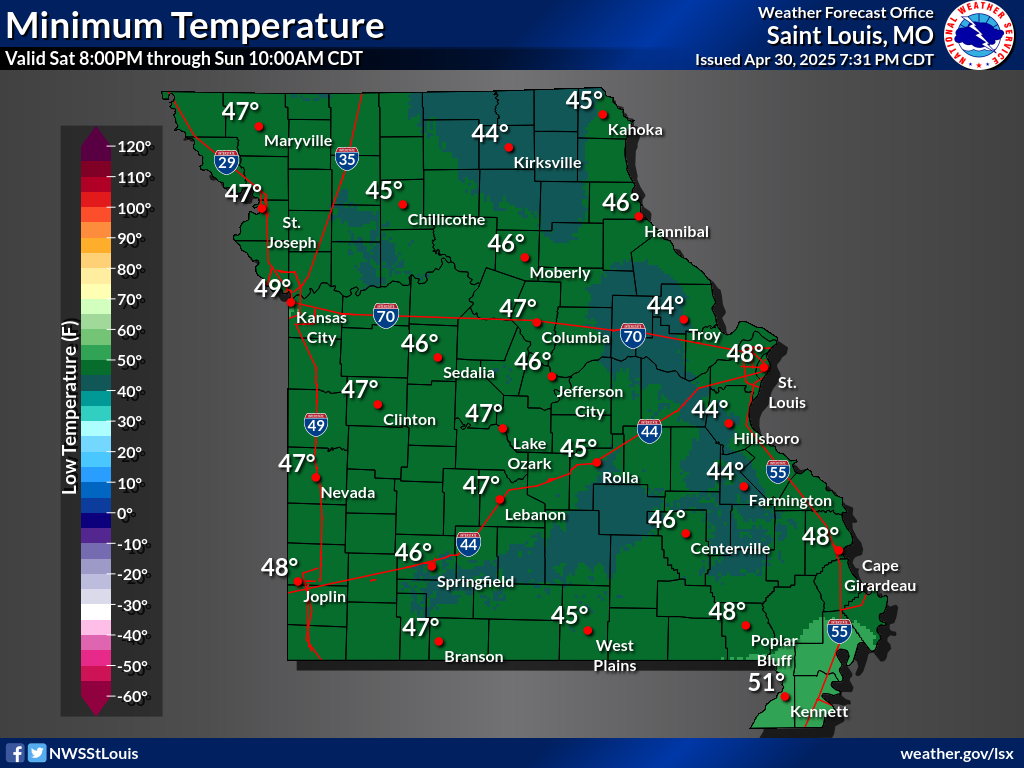
| Maximum Temperature | Minimum Temperature | Max Wind Gust |
 |
 |
|
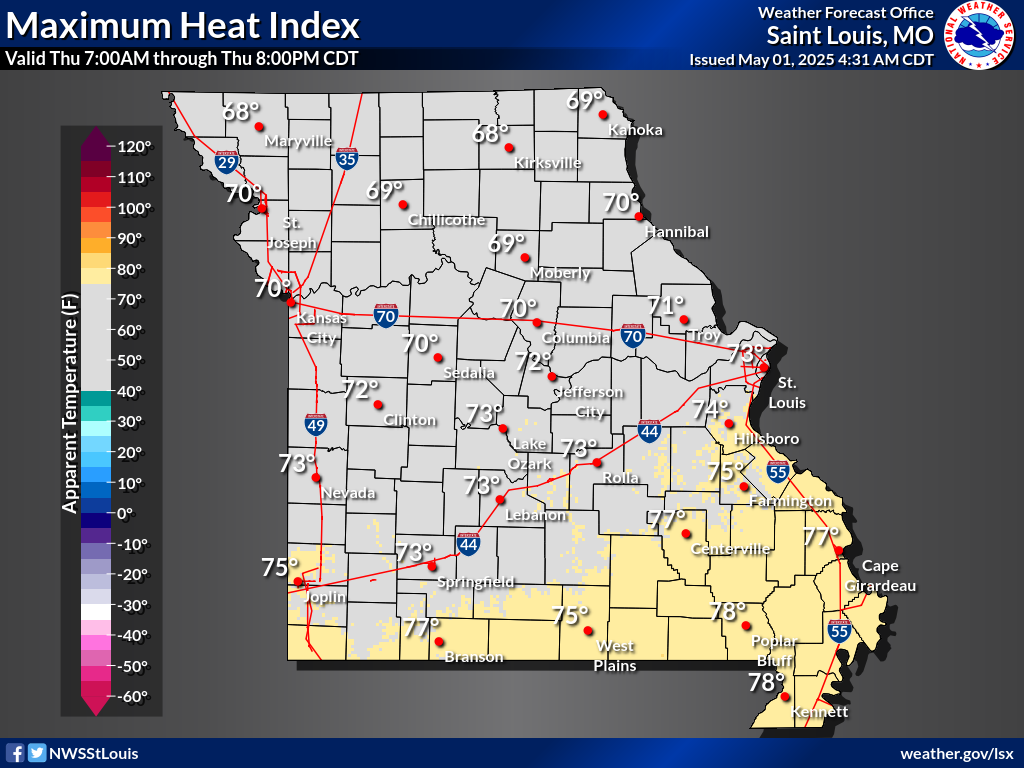
| Heat Index | Wind Chill |
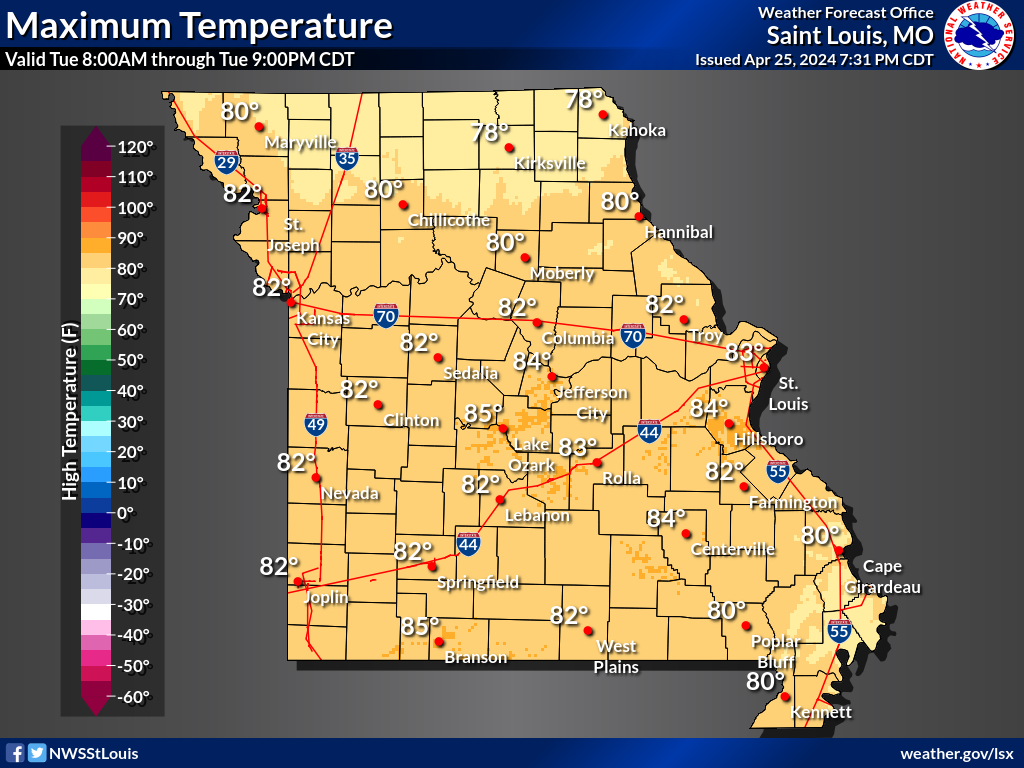
Day 2 Forecasts
 |
 |
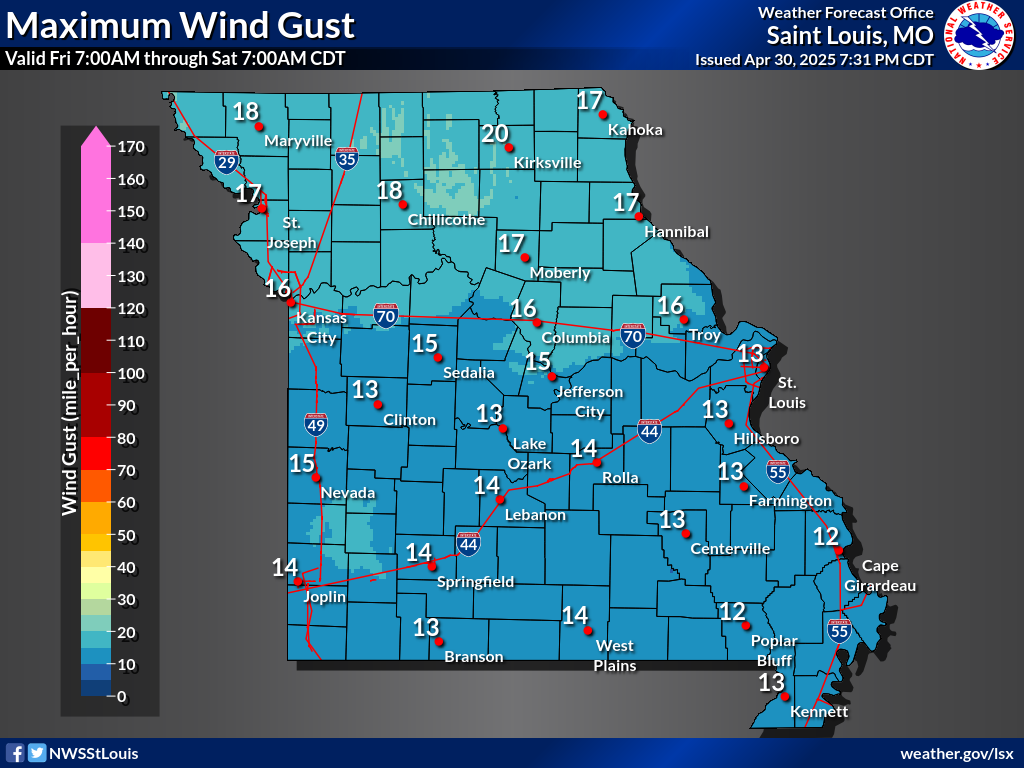 |
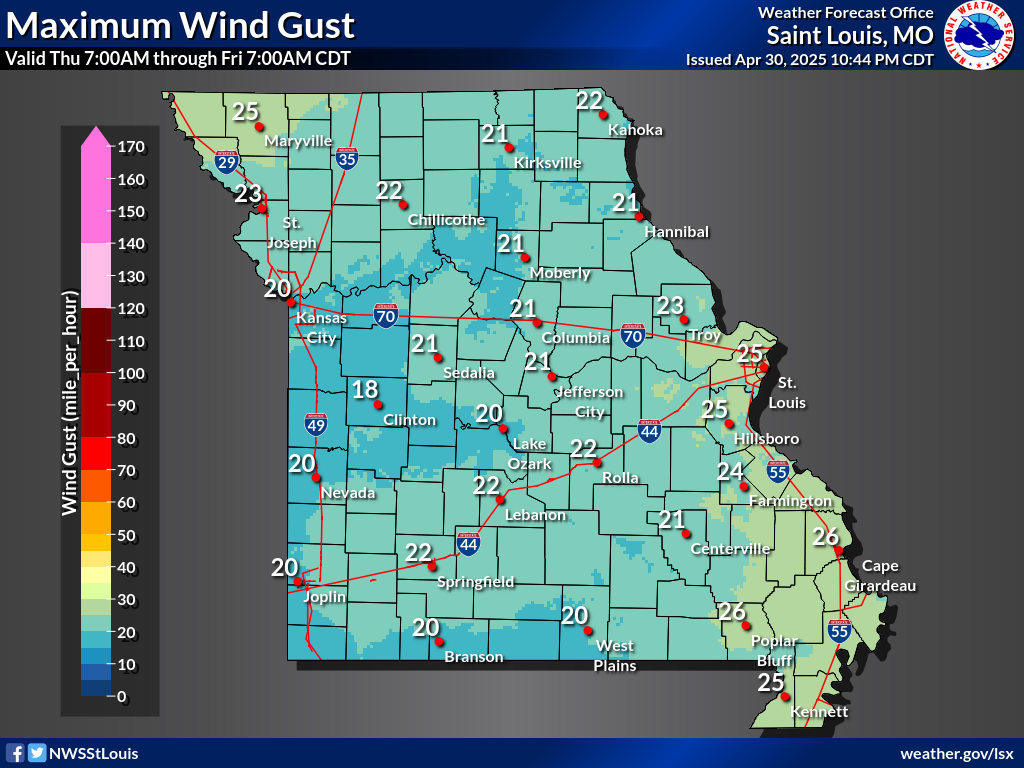
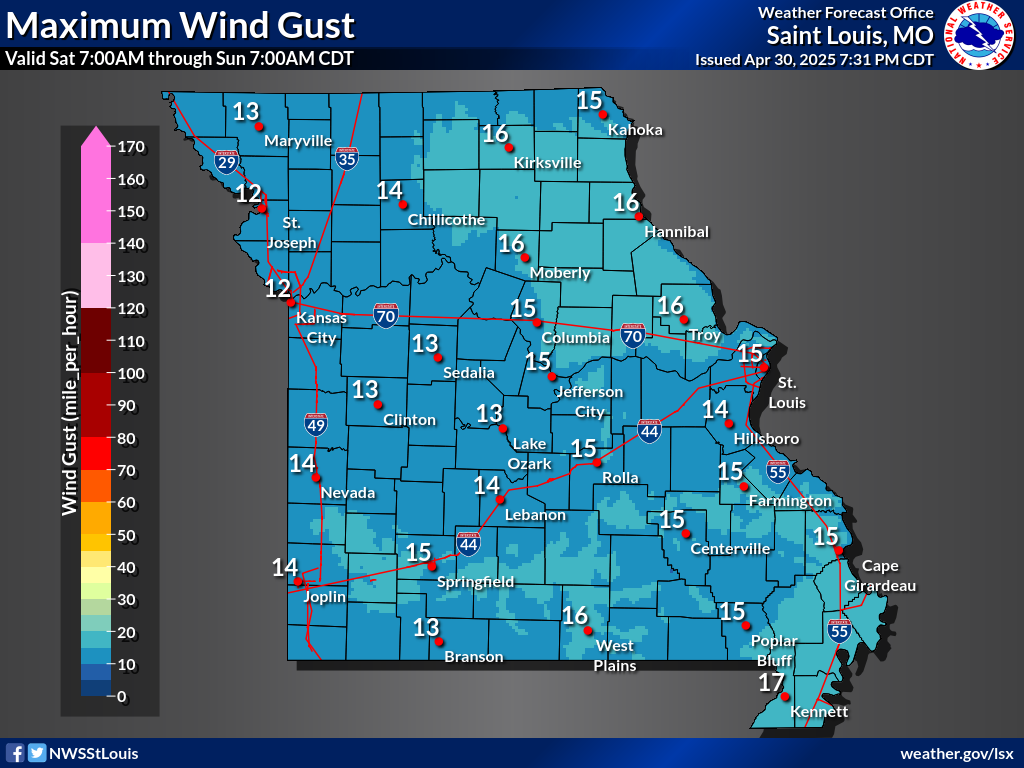
| Maximum Temperature | Minimum Temperature | Max Wind Gust |
 |
 |
|
| Heat Index | Wind Chill |
Day 3 Forecasts
 |
 |
 |
| Maximum Temperature | Minimum Temperature | Max Wind Gust |
 |
 |
|
| Heat Index | Wind Chill |
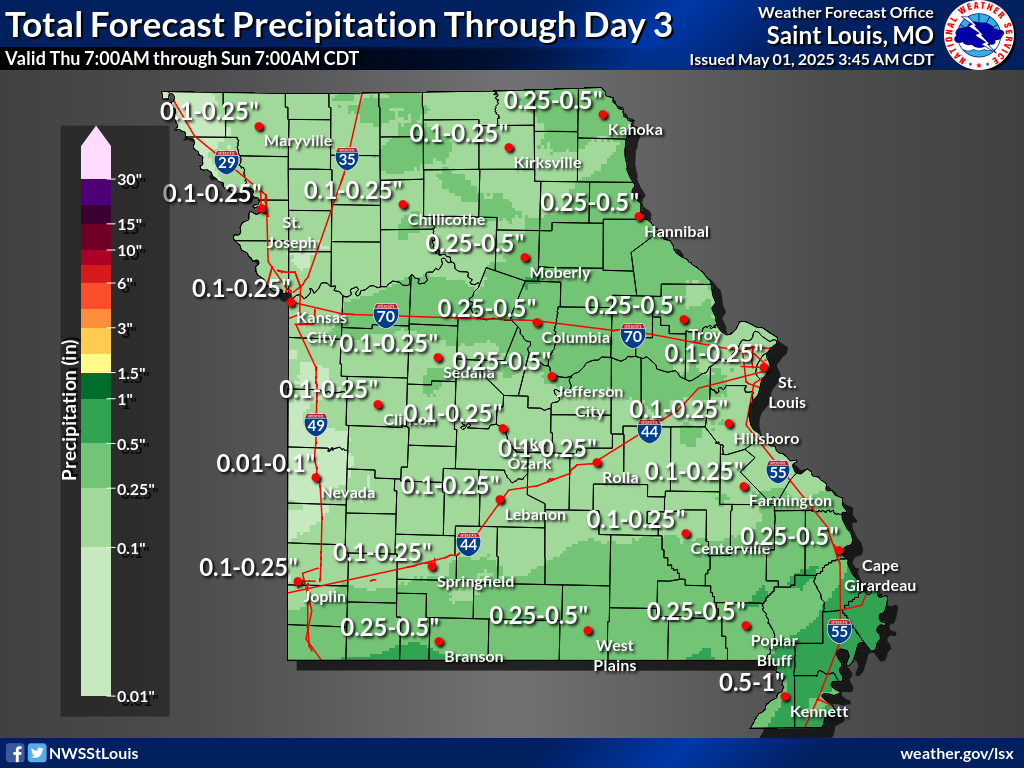
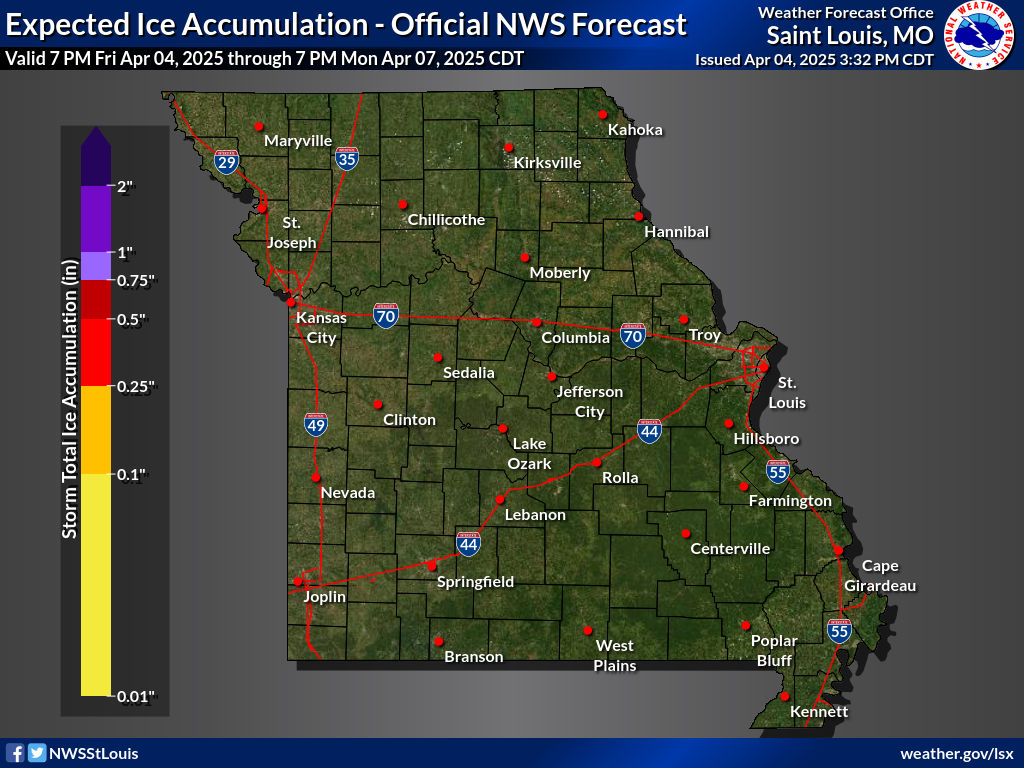
Days 1-3 Forecast Precipitation
 |
 |
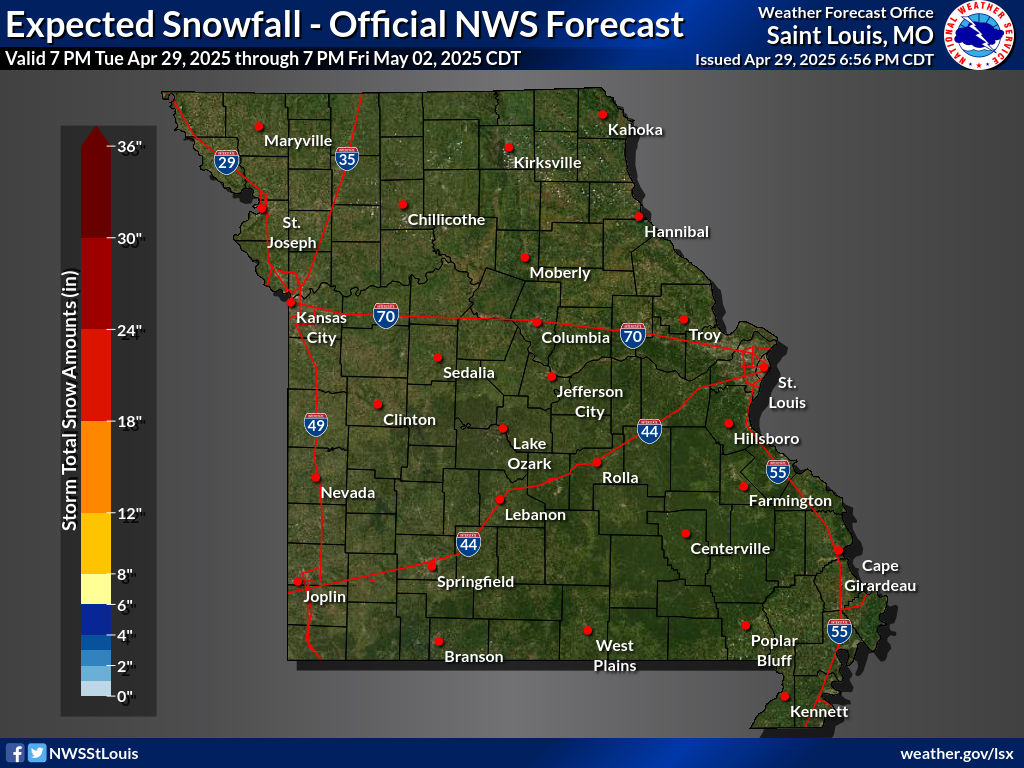 |
| Storm Total (Days 1 -3) Forecast Precipitation | Storm Total (Days 1 -3) Forecast Ice | Storm Total (Days 1 -3) Forecast Snow |
Thunderstorms
Storm Prediction Center Missouri Severe Weather Outlooks
 |
 |
 |
| SPC Convective Outlook for Missouri: Day 1 | SPC Convective Outlook for Missouri: Day 2 | SPC Convective Outlook for Missouri: Day 3 |
Storm Prediction Center National Severe Weather Outlooks
 |
 |
 |
 |
| SPC Convective Outlook: Day 1 | SPC Convective Outlook: Day 1 Tornado Probabilities "Probability of a tornado within 25 miles of a point. Hatched area denotes 10%+ probability of EF2-EF5 tornadoes within 25 miles of a point." (SPC) |
SPC Convective Outlook: Day 1 Wind Probabilities "Probability of damaging thunderstorm winds or wind gusts of 50 knots (58 mph) or higher within 25 miles of a point. Hatched area denotes 10% or greater probability of wind gusts 65 knots (75 mph) or greater within 25 miles of a point." (SPC) |
SPC Convective Outlook: Day 1 Hail Probabilities "Probability of one inch diameter hail or larger within 25 miles of a point. Hatched area denotes 10% or greater probability of two inch diameter hail or larger within 25 miles of a point." (SPC) |
 |
 |
 |
 |
| SPC Convective Outlook: Day 2 | SPC Convective Outlook: Day 2 Tornado Probabilities "Probability of a tornado within 25 miles of a point. Hatched area denotes 10%+ probability of EF2-EF5 tornadoes within 25 miles of a point." (SPC) |
SPC Convective Outlook: Day 2 Wind Probabilities "Probability of damaging thunderstorm winds or wind gusts of 50 knots (58 mph) or higher within 25 miles of a point. Hatched area denotes 10% or greater probability of wind gusts 65 knots (75 mph) or greater within 25 miles of a point." (SPC) |
SPC Convective Outlook: Day 2 Hail Probabilities "Probability of one inch diameter hail or larger within 25 miles of a point. Hatched area denotes 10% or greater probability of two inch diameter hail or larger within 25 miles of a point." (SPC) |
 |
 |
 |
|
| SPC Convective Outlook: Day 3 | SPC Convective Outlook: Day 4 | Mesoscale Discussion |
Observed Storm Damage
 |
 |
Storm Survey Information |
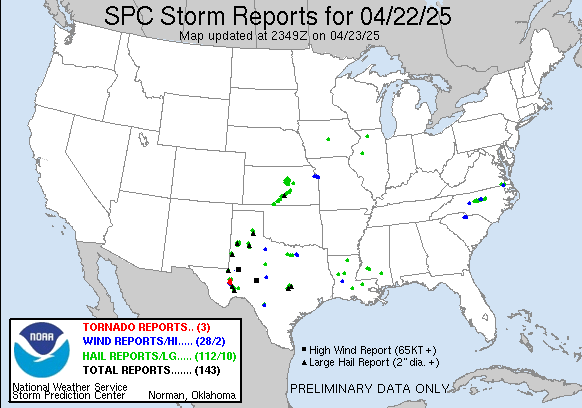
| Yesterday's SPC Storm Reports | Today's SPC Storm Reports |
Heavy Precipitation & Flooding
Weather Prediction Center Excessive Rainfall Outlooks
 |
 |
 |
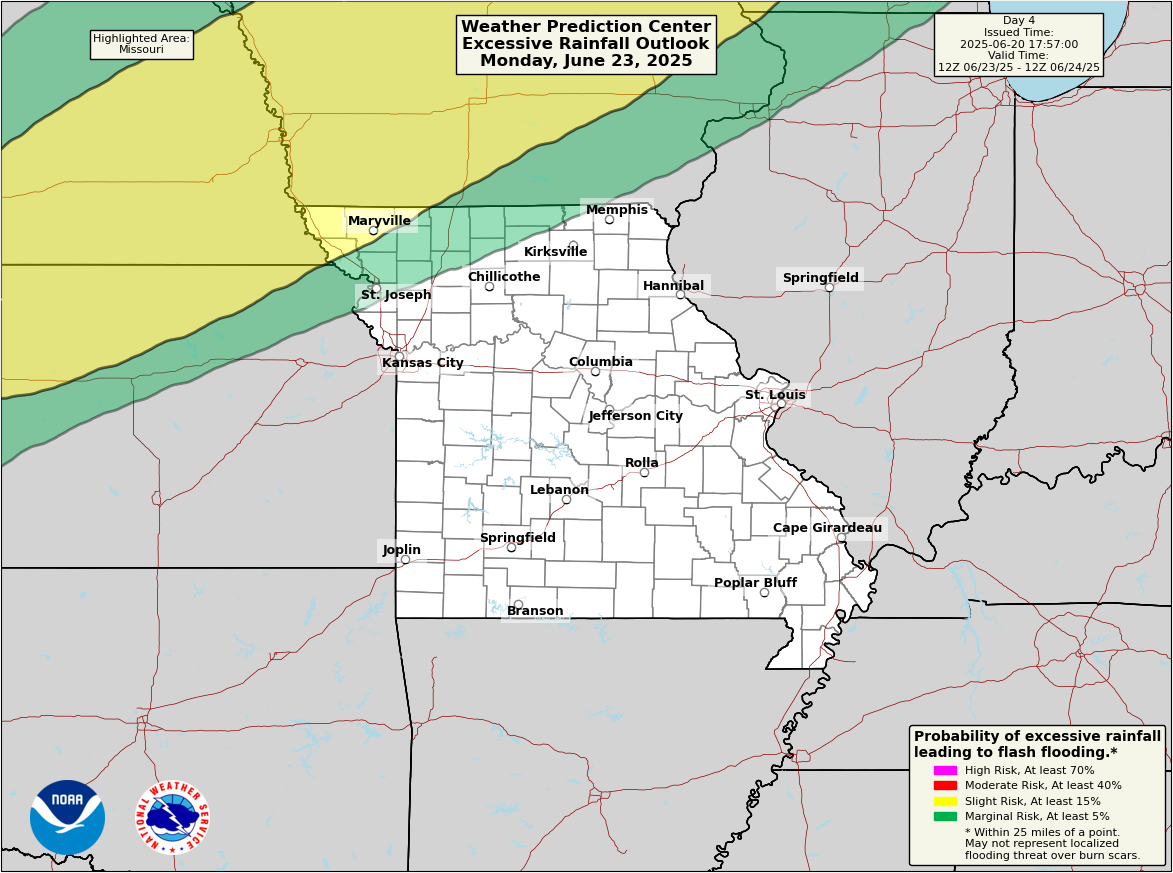 |
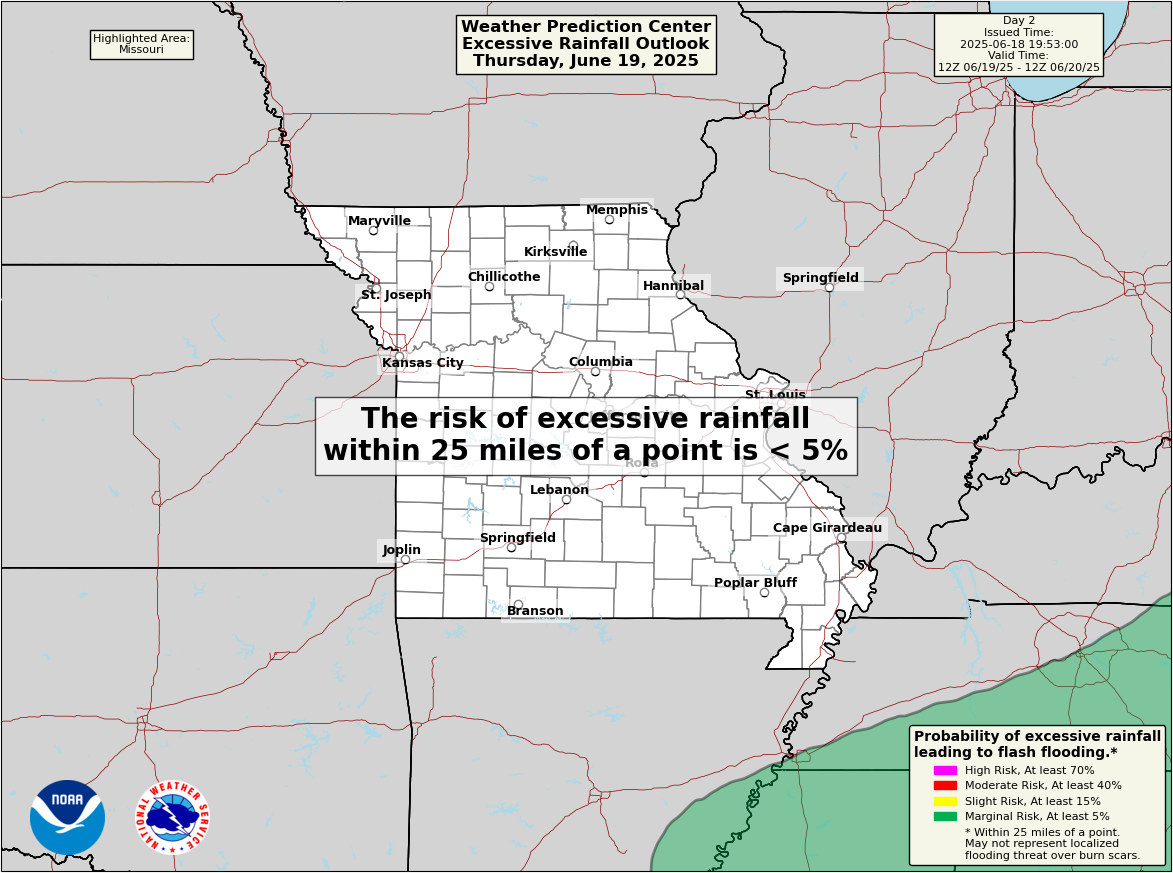
| Excessive Rainfall Outlook: Day 1 | Excessive Rainfall Outlook: Day 2 | Excessive Rainfall Outlook: Day 3 | Excessive Rainfall Outlook: Day 4 |
 |
 |
||
| Excessive Rainfall Outlook: Day 5 | Mesoscale Precipitation Discussion |
Precipitation Forecasts
 |
 |
 |
 |
| 24 Hour Precipitation Forecast: Day 1 | 24 Hour Precipitation Forecast: Day 2 | 24 Hour Precipitation Forecast: Day 3 | Day 1-7 Total Precipitation Forecast |
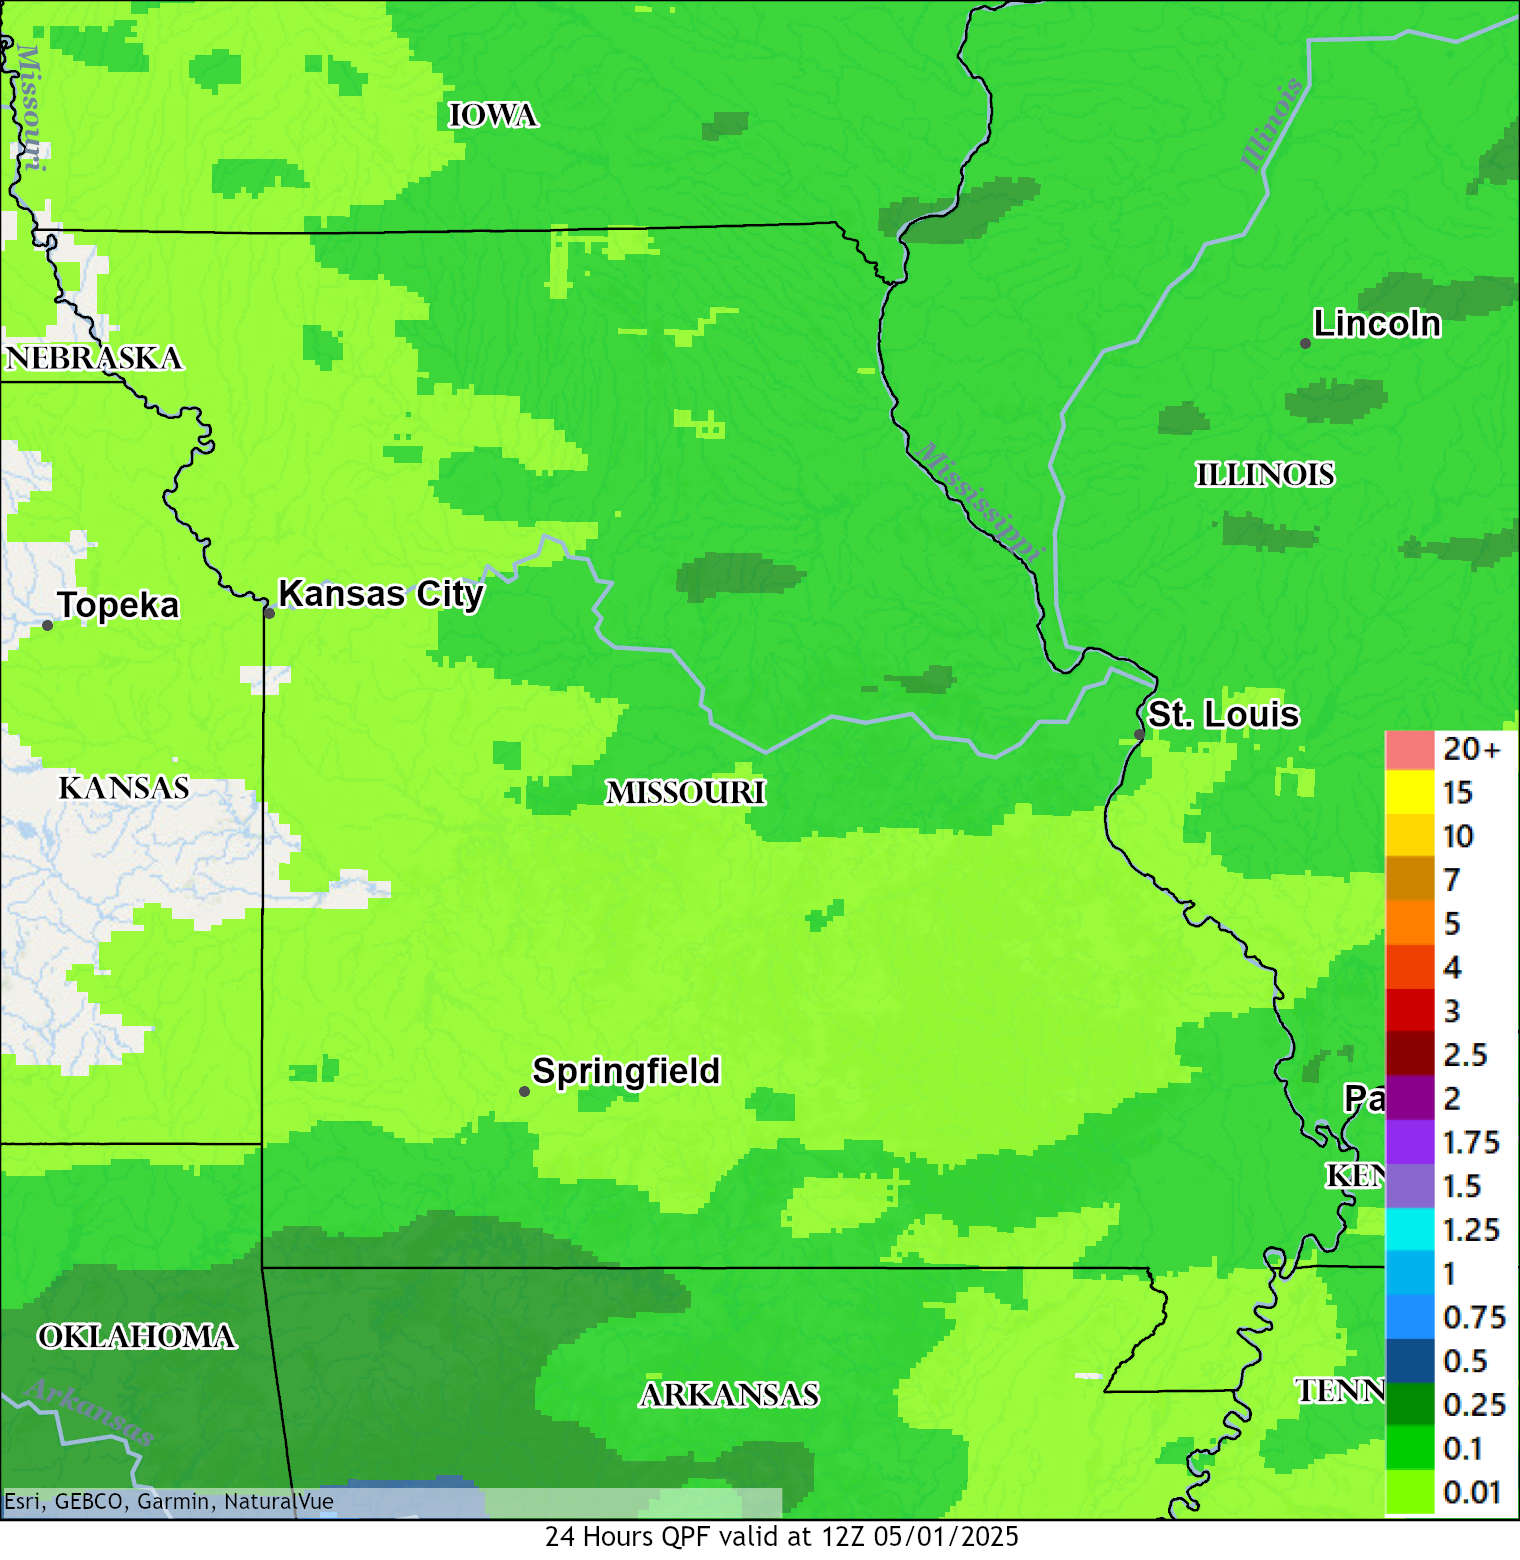 |
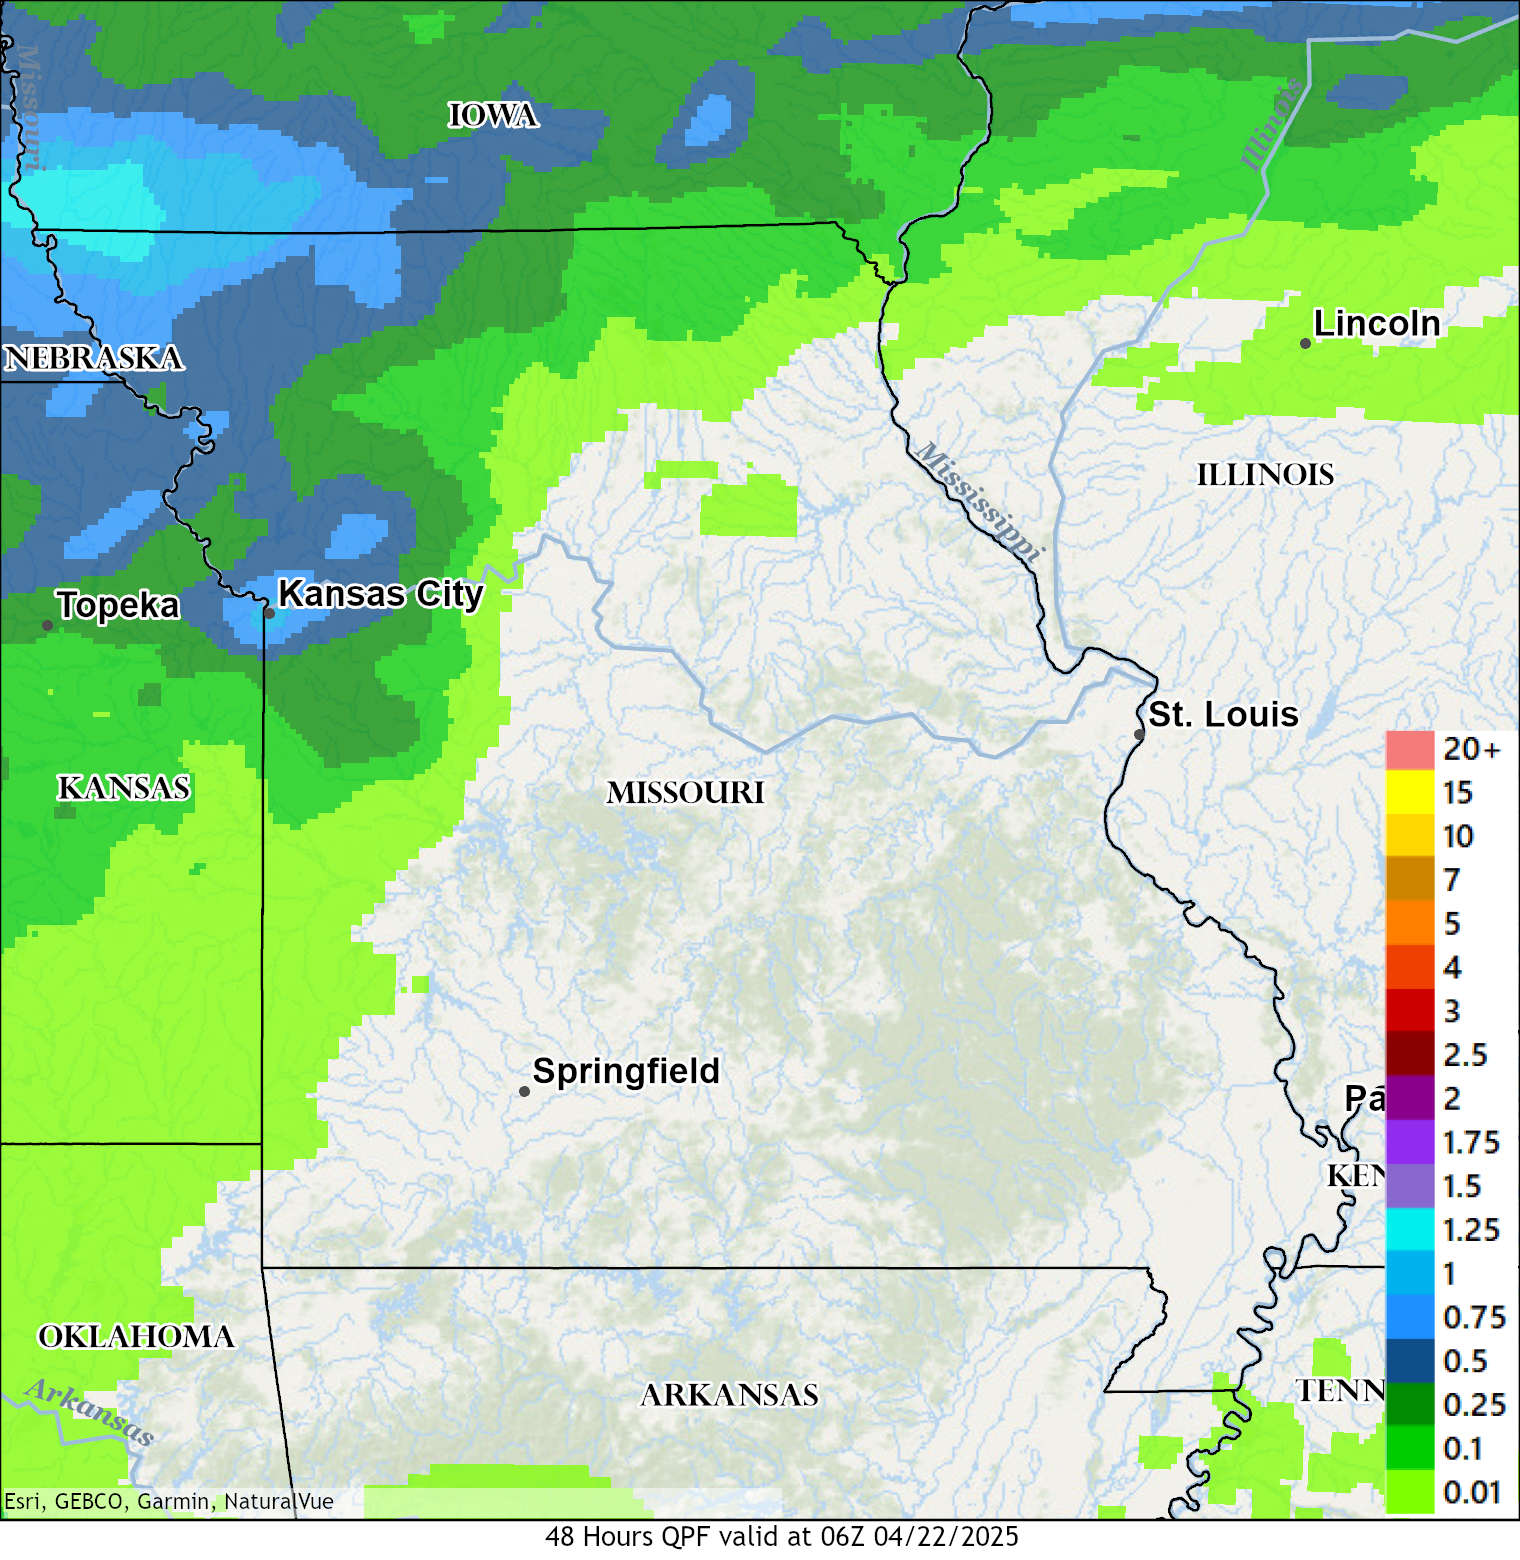 |
 |
 |
| Missouri 24 Hour Precipitation Forecast | Missouri 48 Hour Precipitation Forecast | Missouri 72 Hour Precipitation Forecast | Missouri 96 Hour Precipitation Forecast |
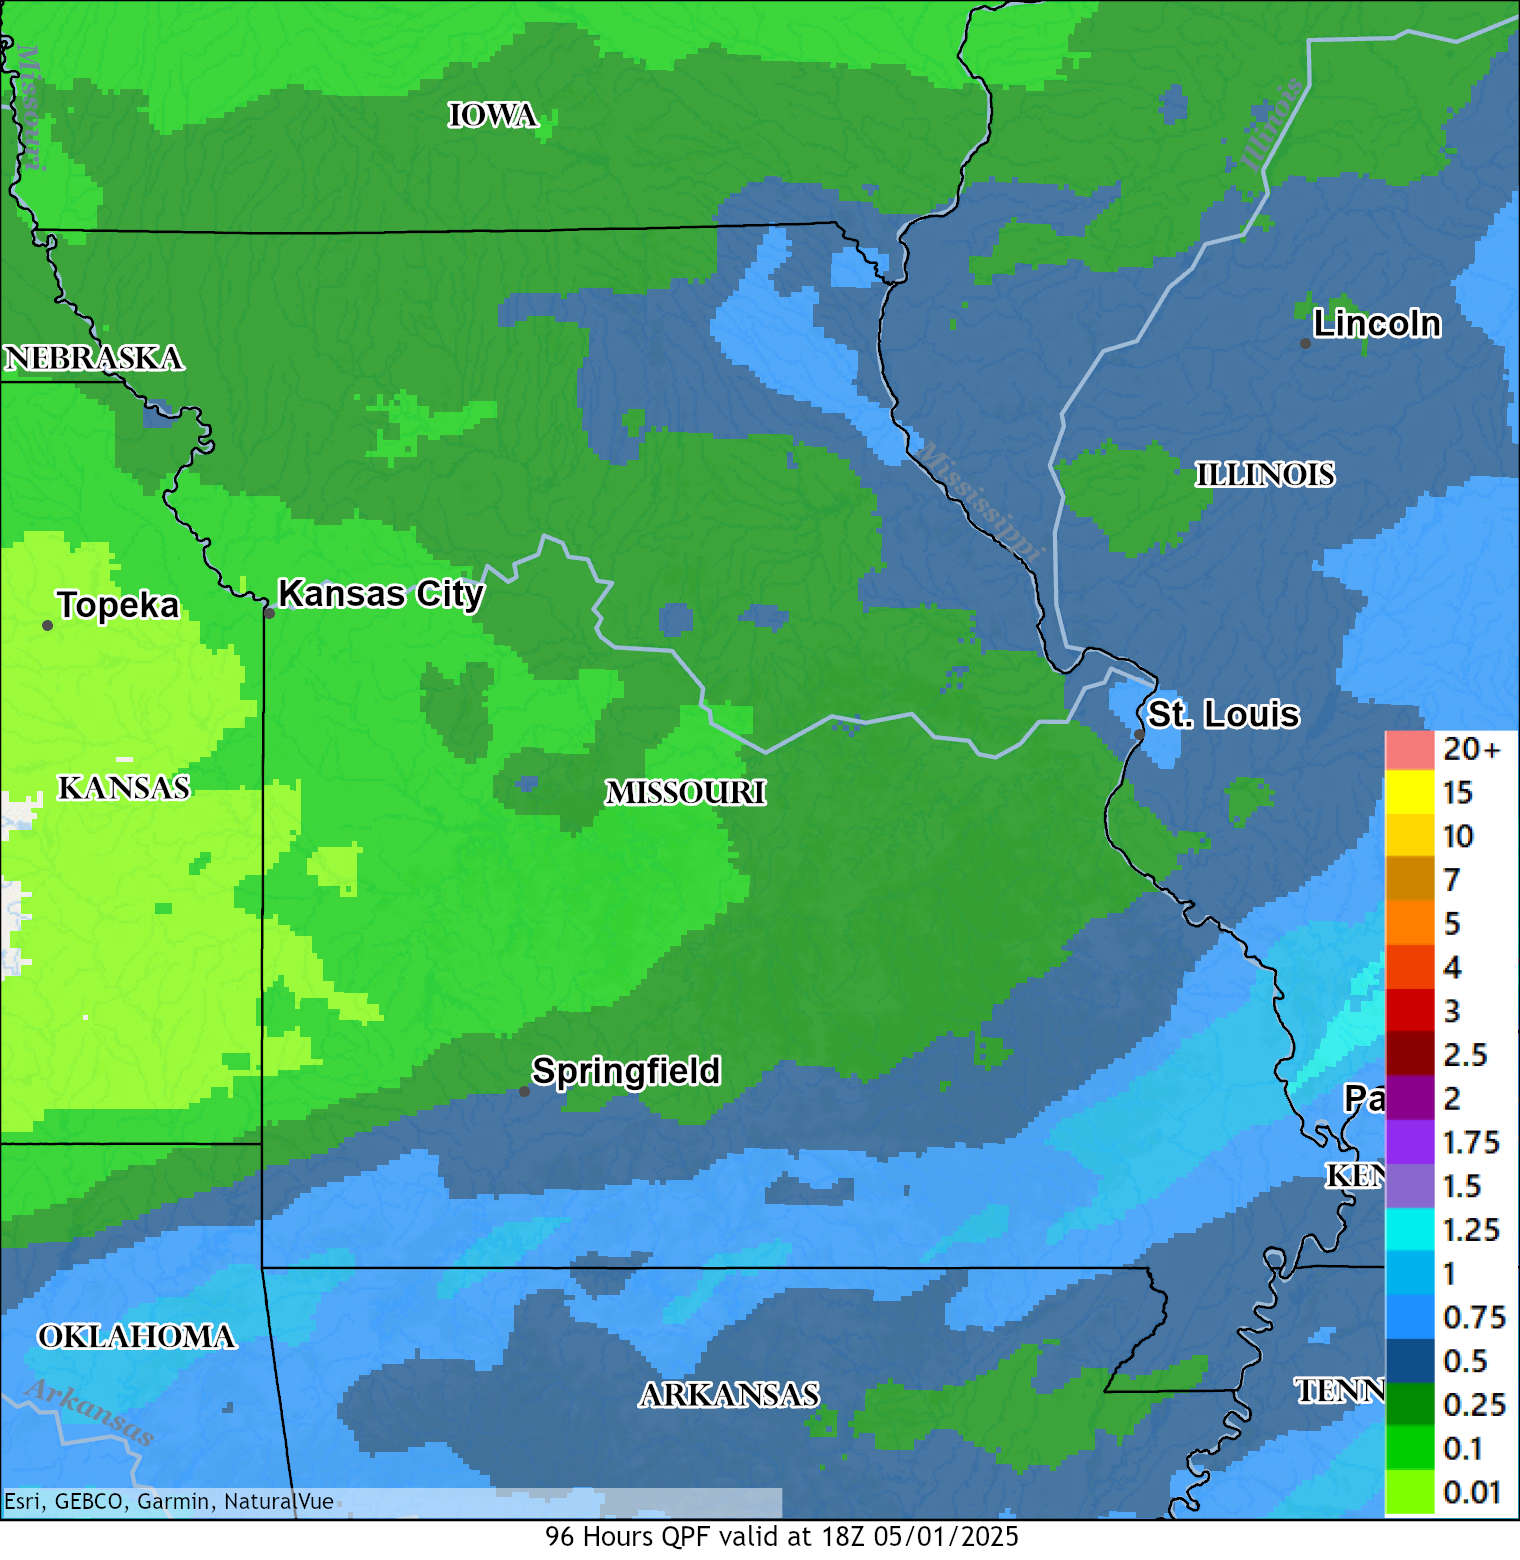
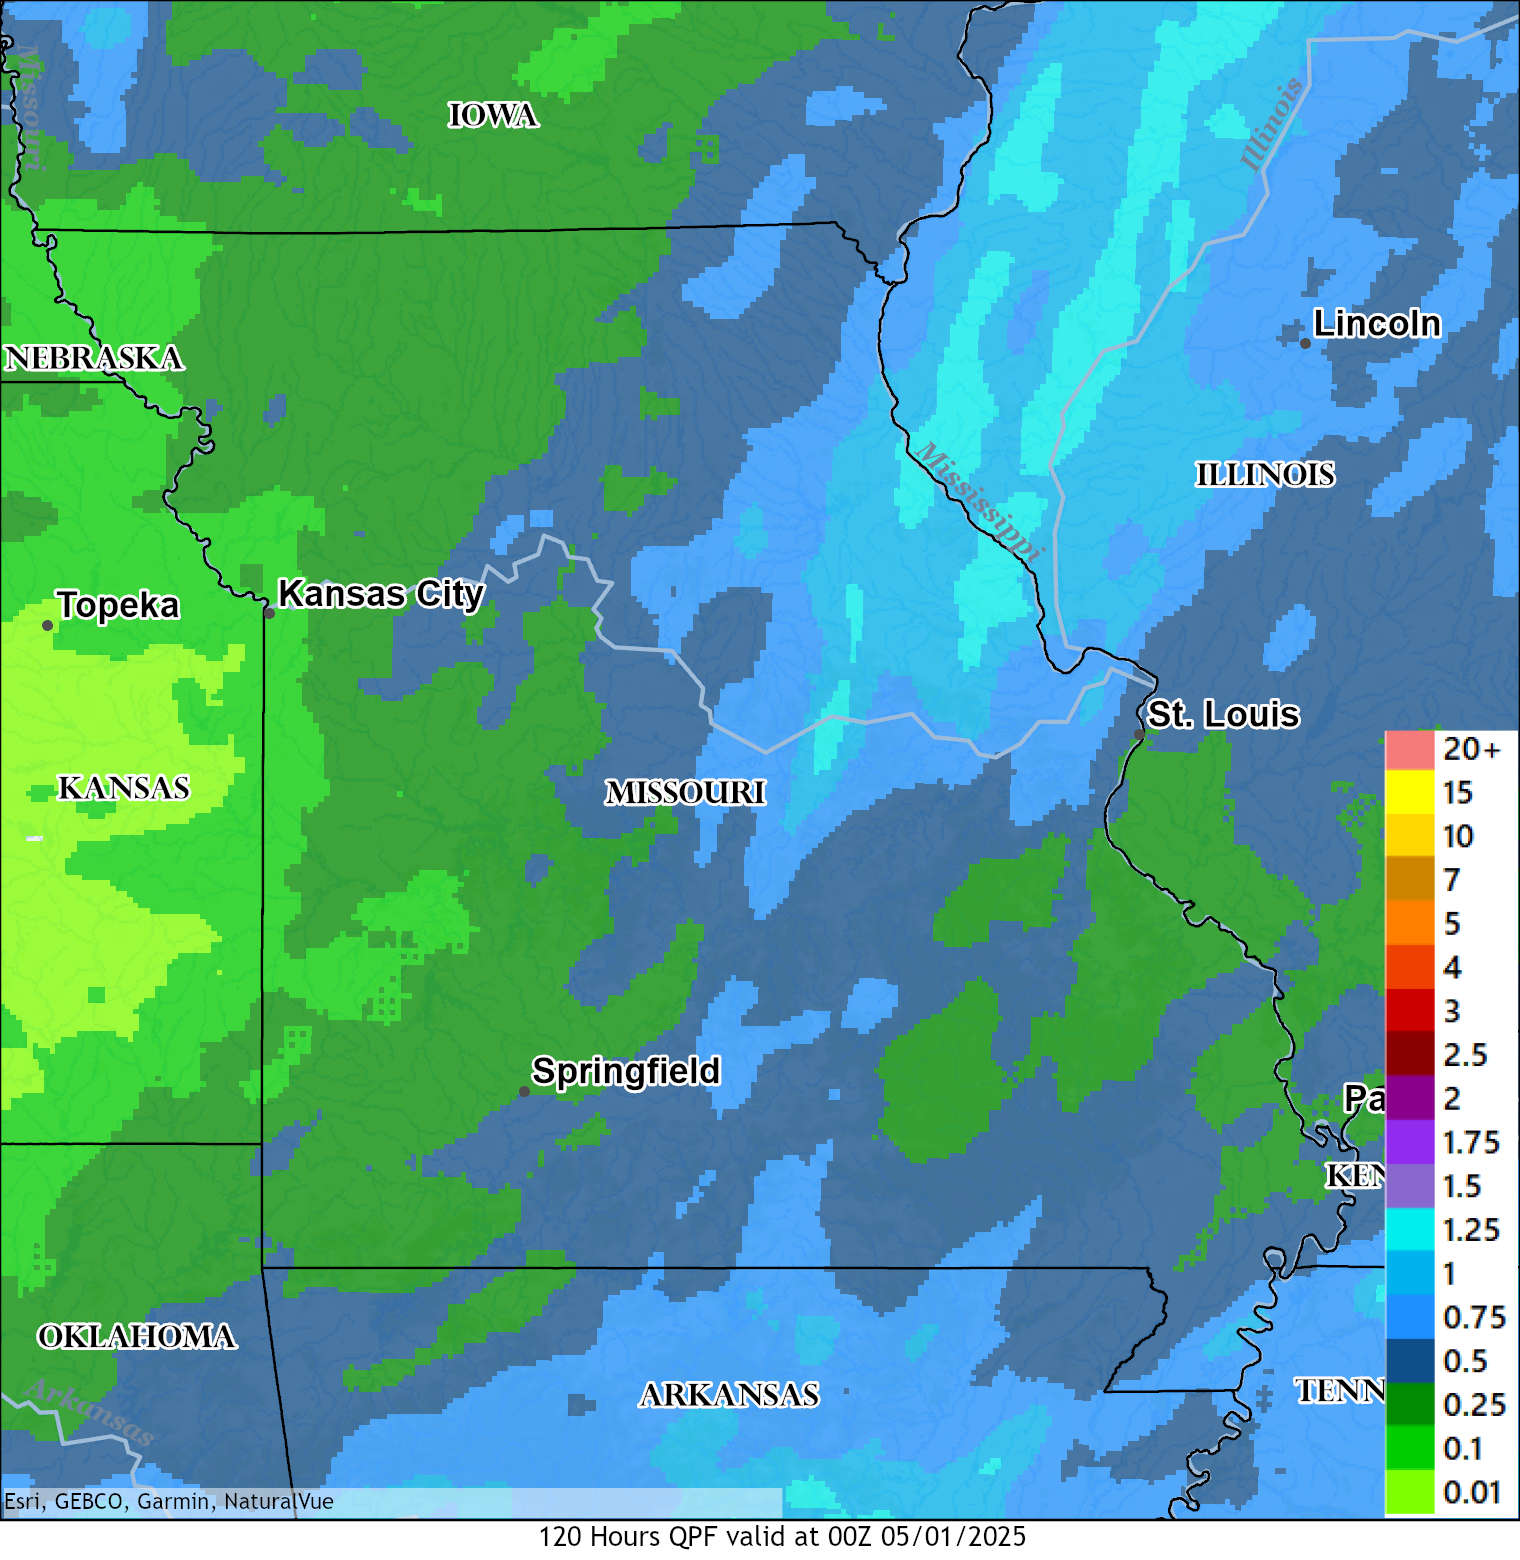 |
|||
| Missouri 120 Hour Precipitation Forecast |
Precipitation Outlooks
 |
 |
 |
 |
| Next Week's Risk of Heavy Precipitation | 6-10 Day Precipitation Outlook | 8-14 Day Precipitation Outlook | 3-4 Week Precipitation Outlook |
 |
 |
||
| One Month Precipitation Outlook | Three Month Precipitation Outlook |
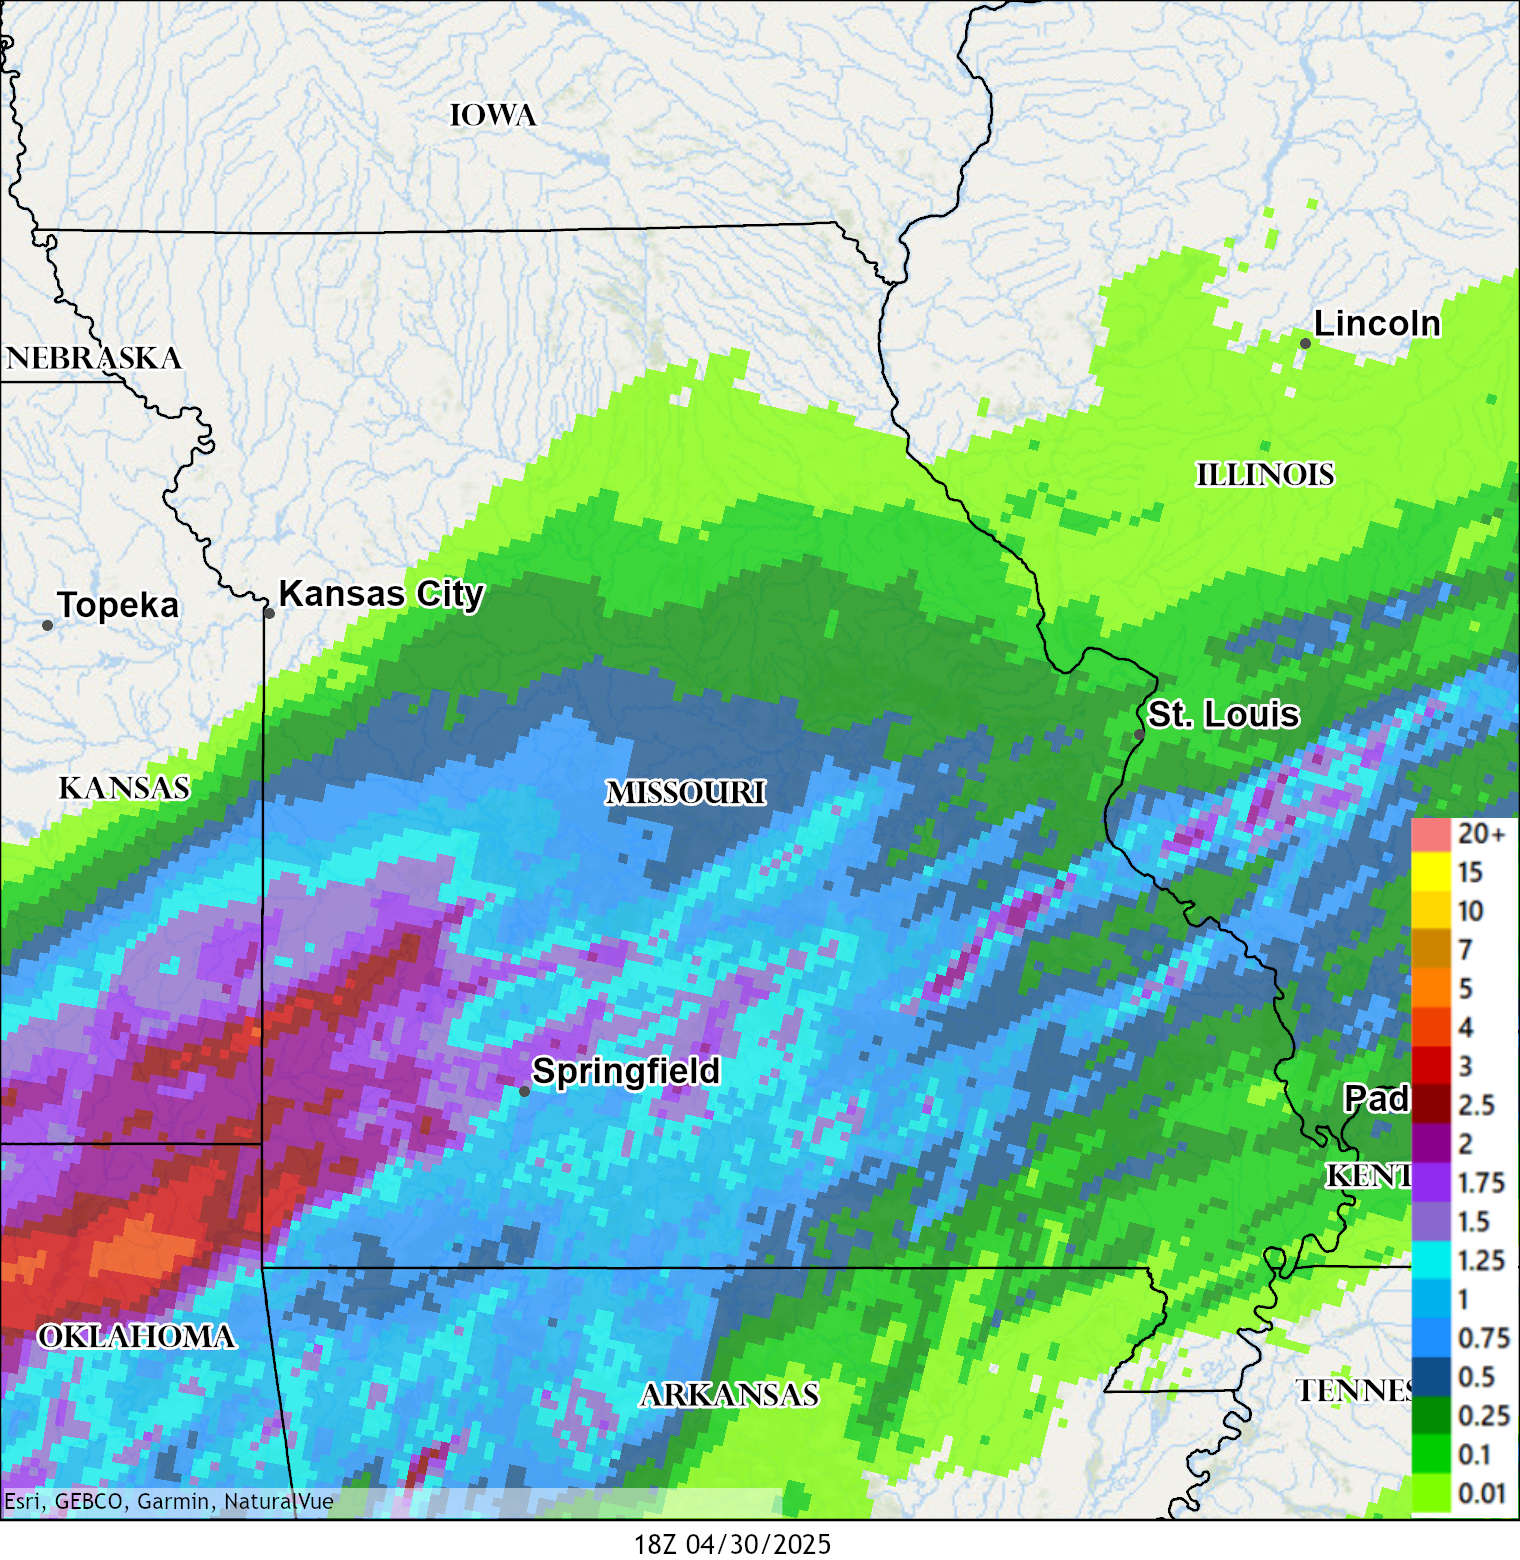
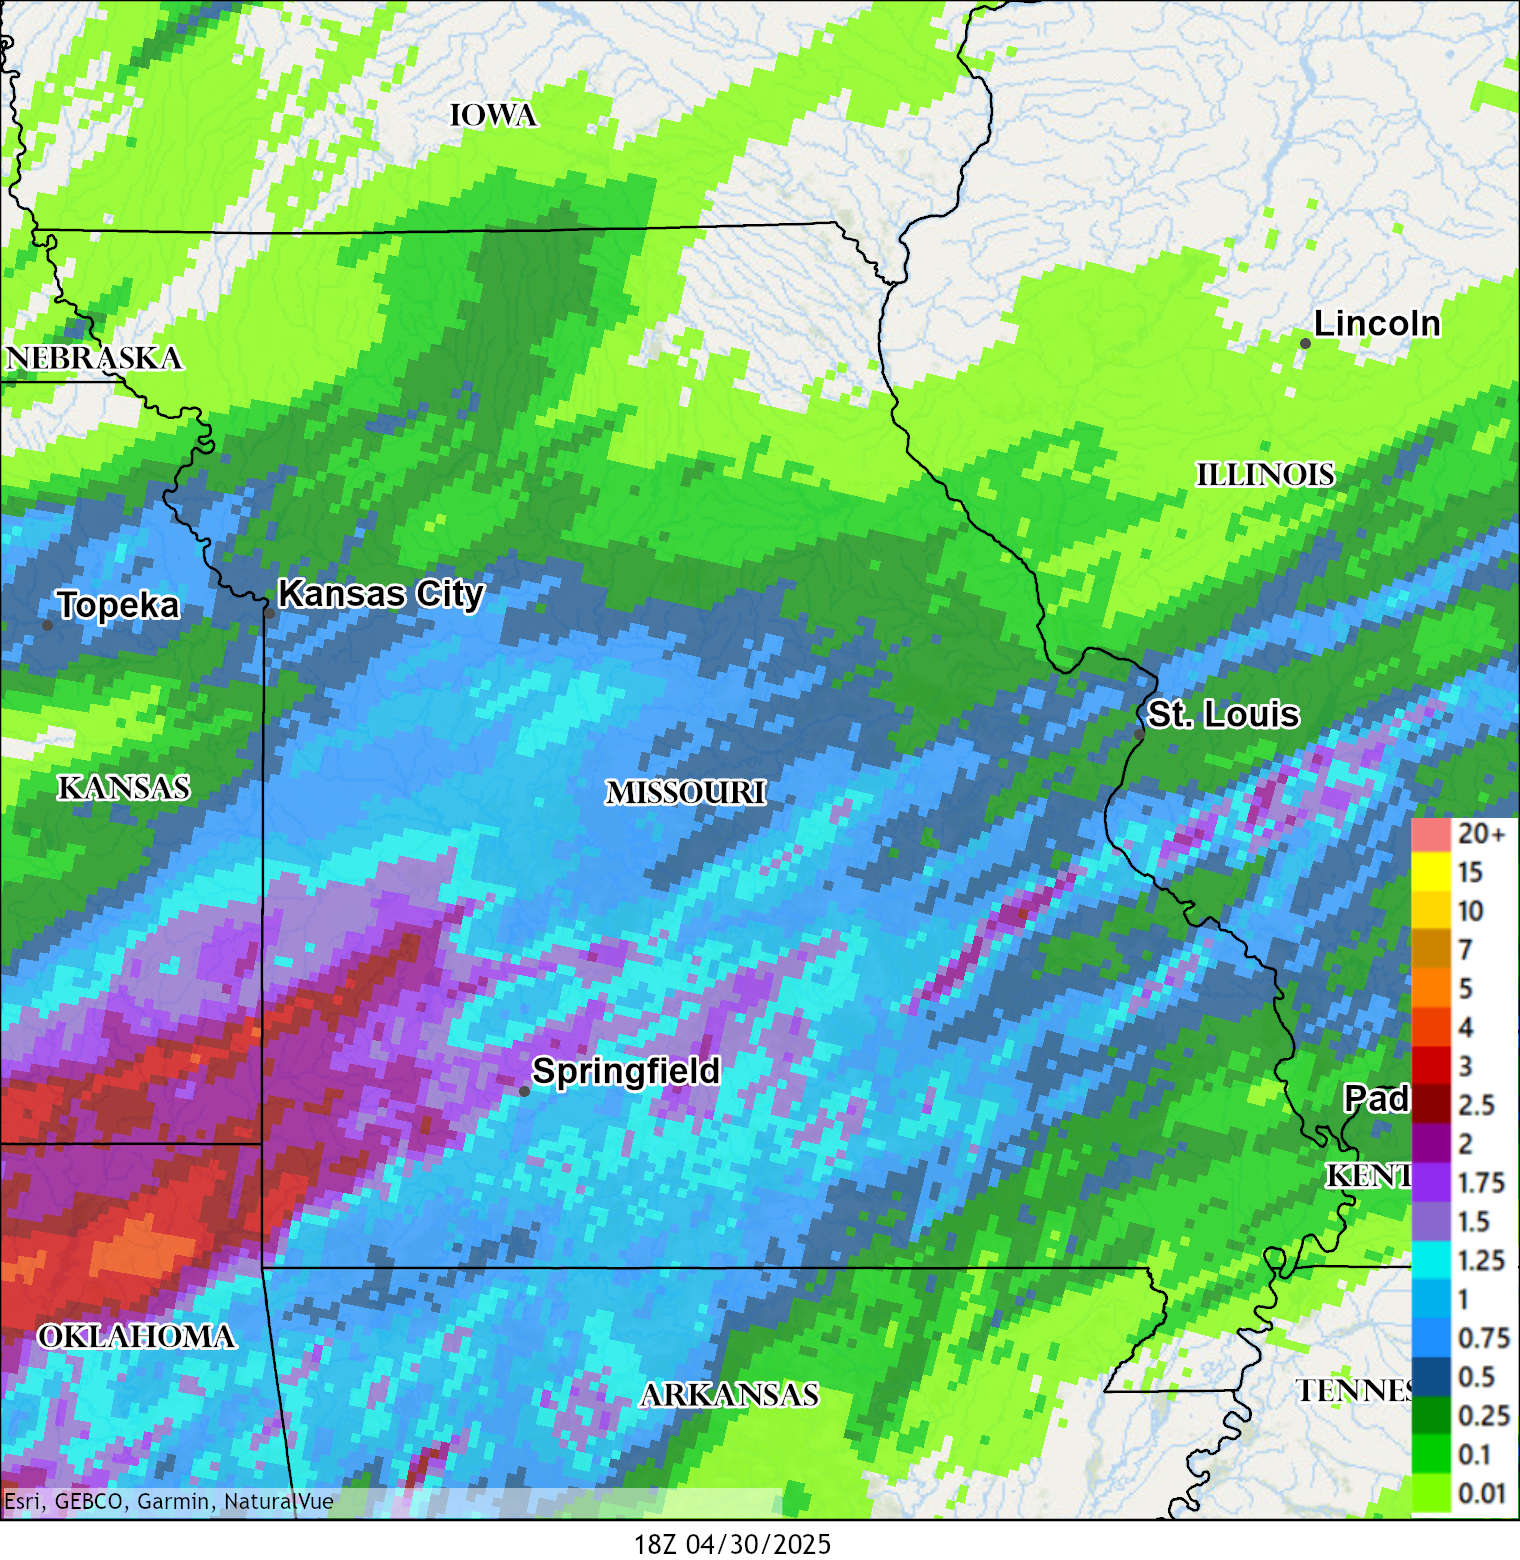
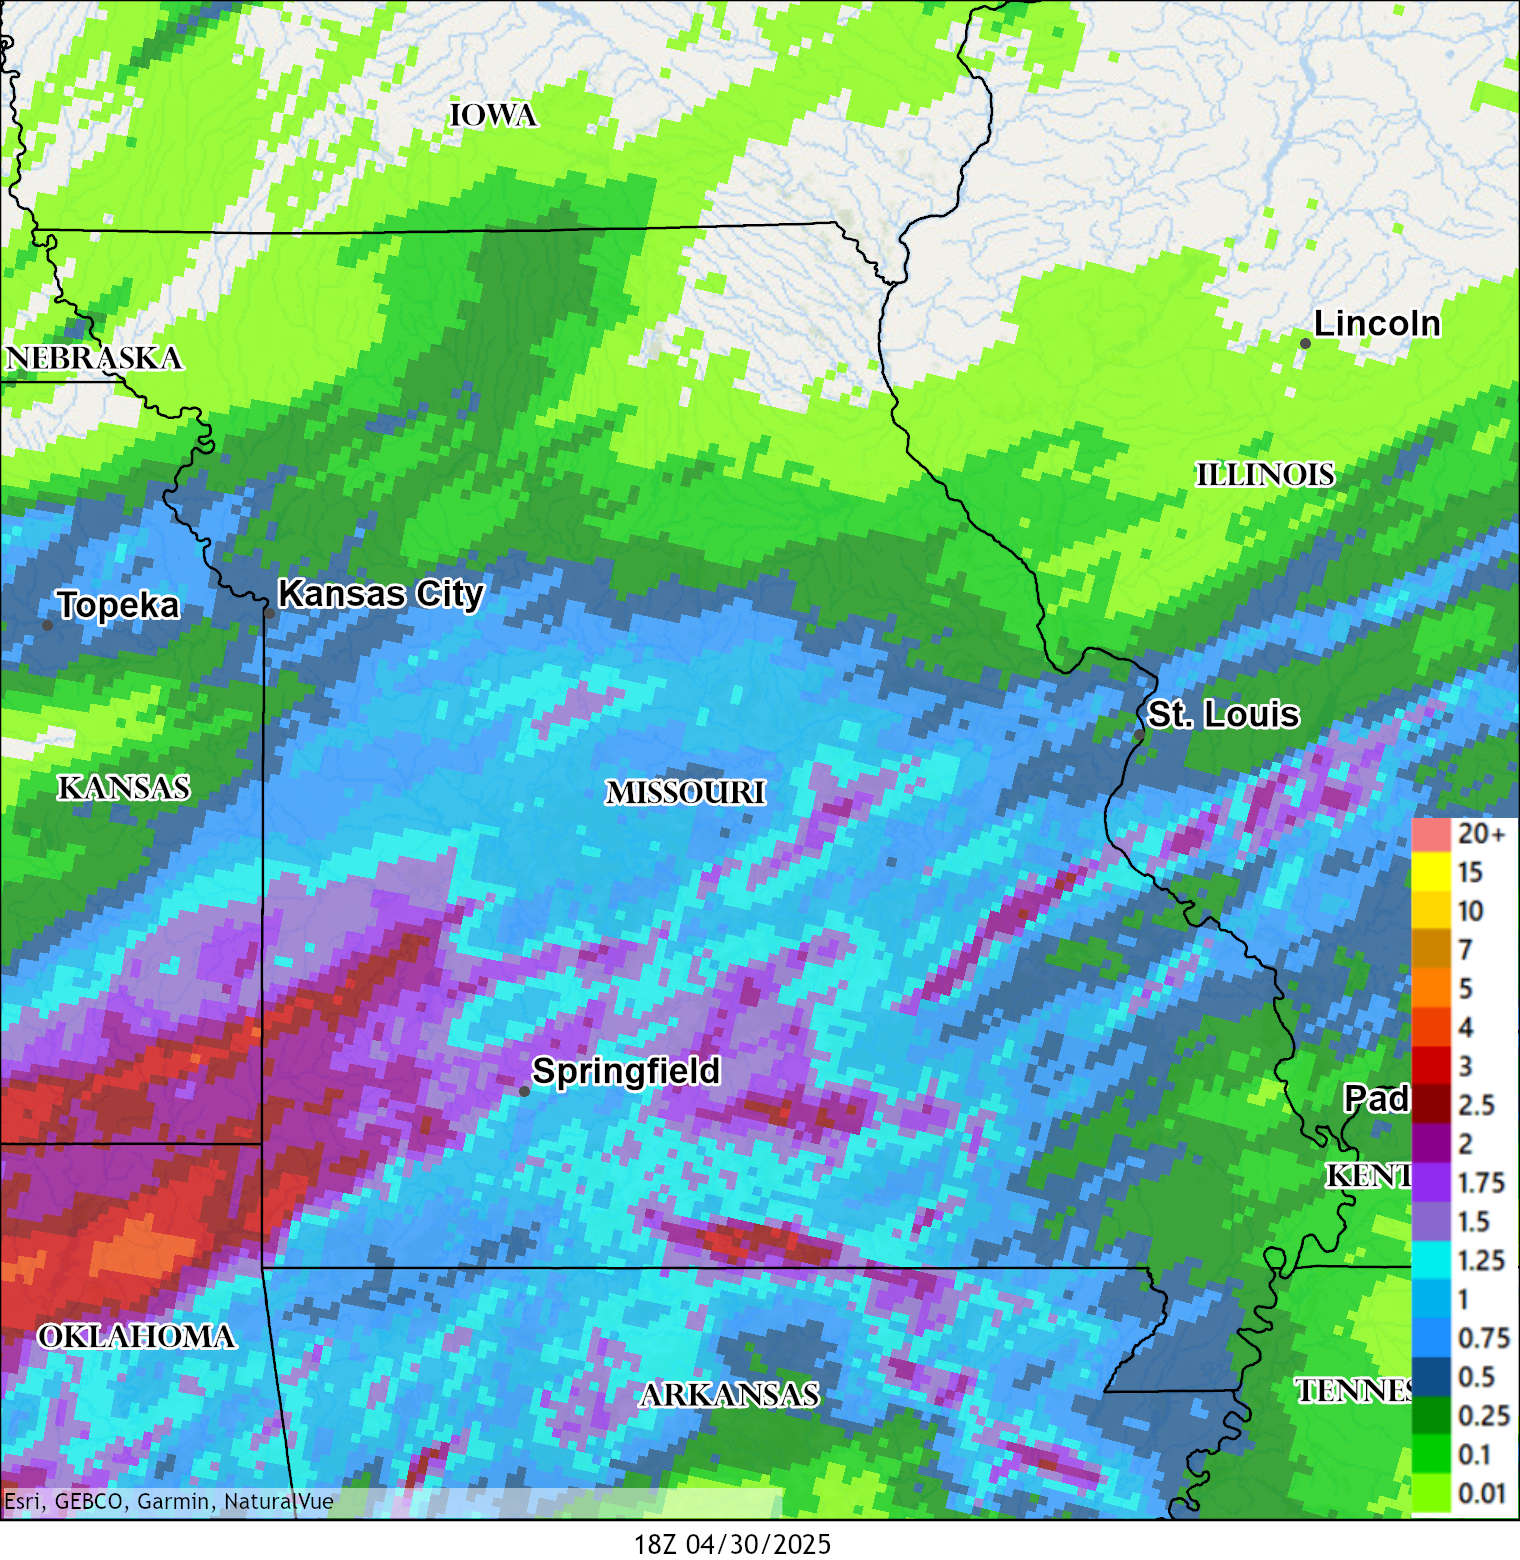
Observed Precipitation
 |
 |
 |
 |
| Missouri 24 Hour Observed Precipitation | Missouri 48 Hour Observed Precipitation | Missouri 72 Hour Observed Precipitation | Missouri 96 Hour Observed Precipitation |
 |
 |
 |
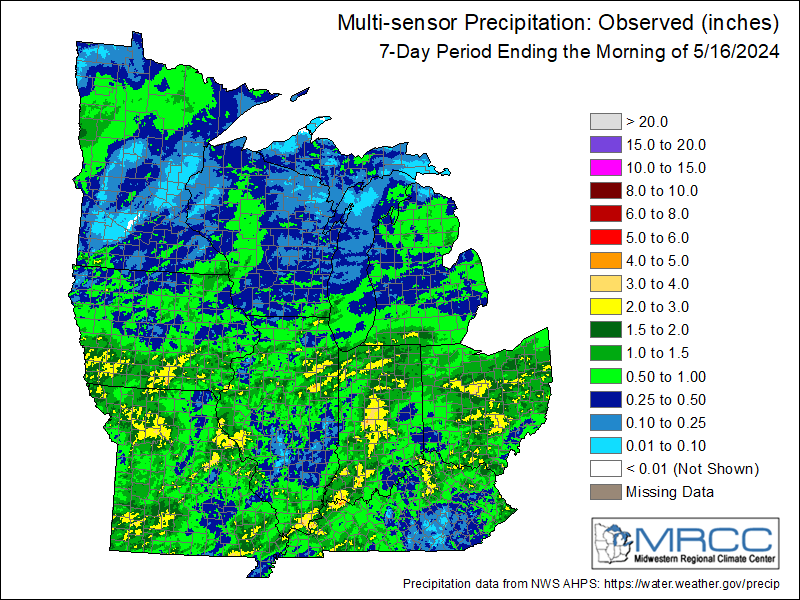 |
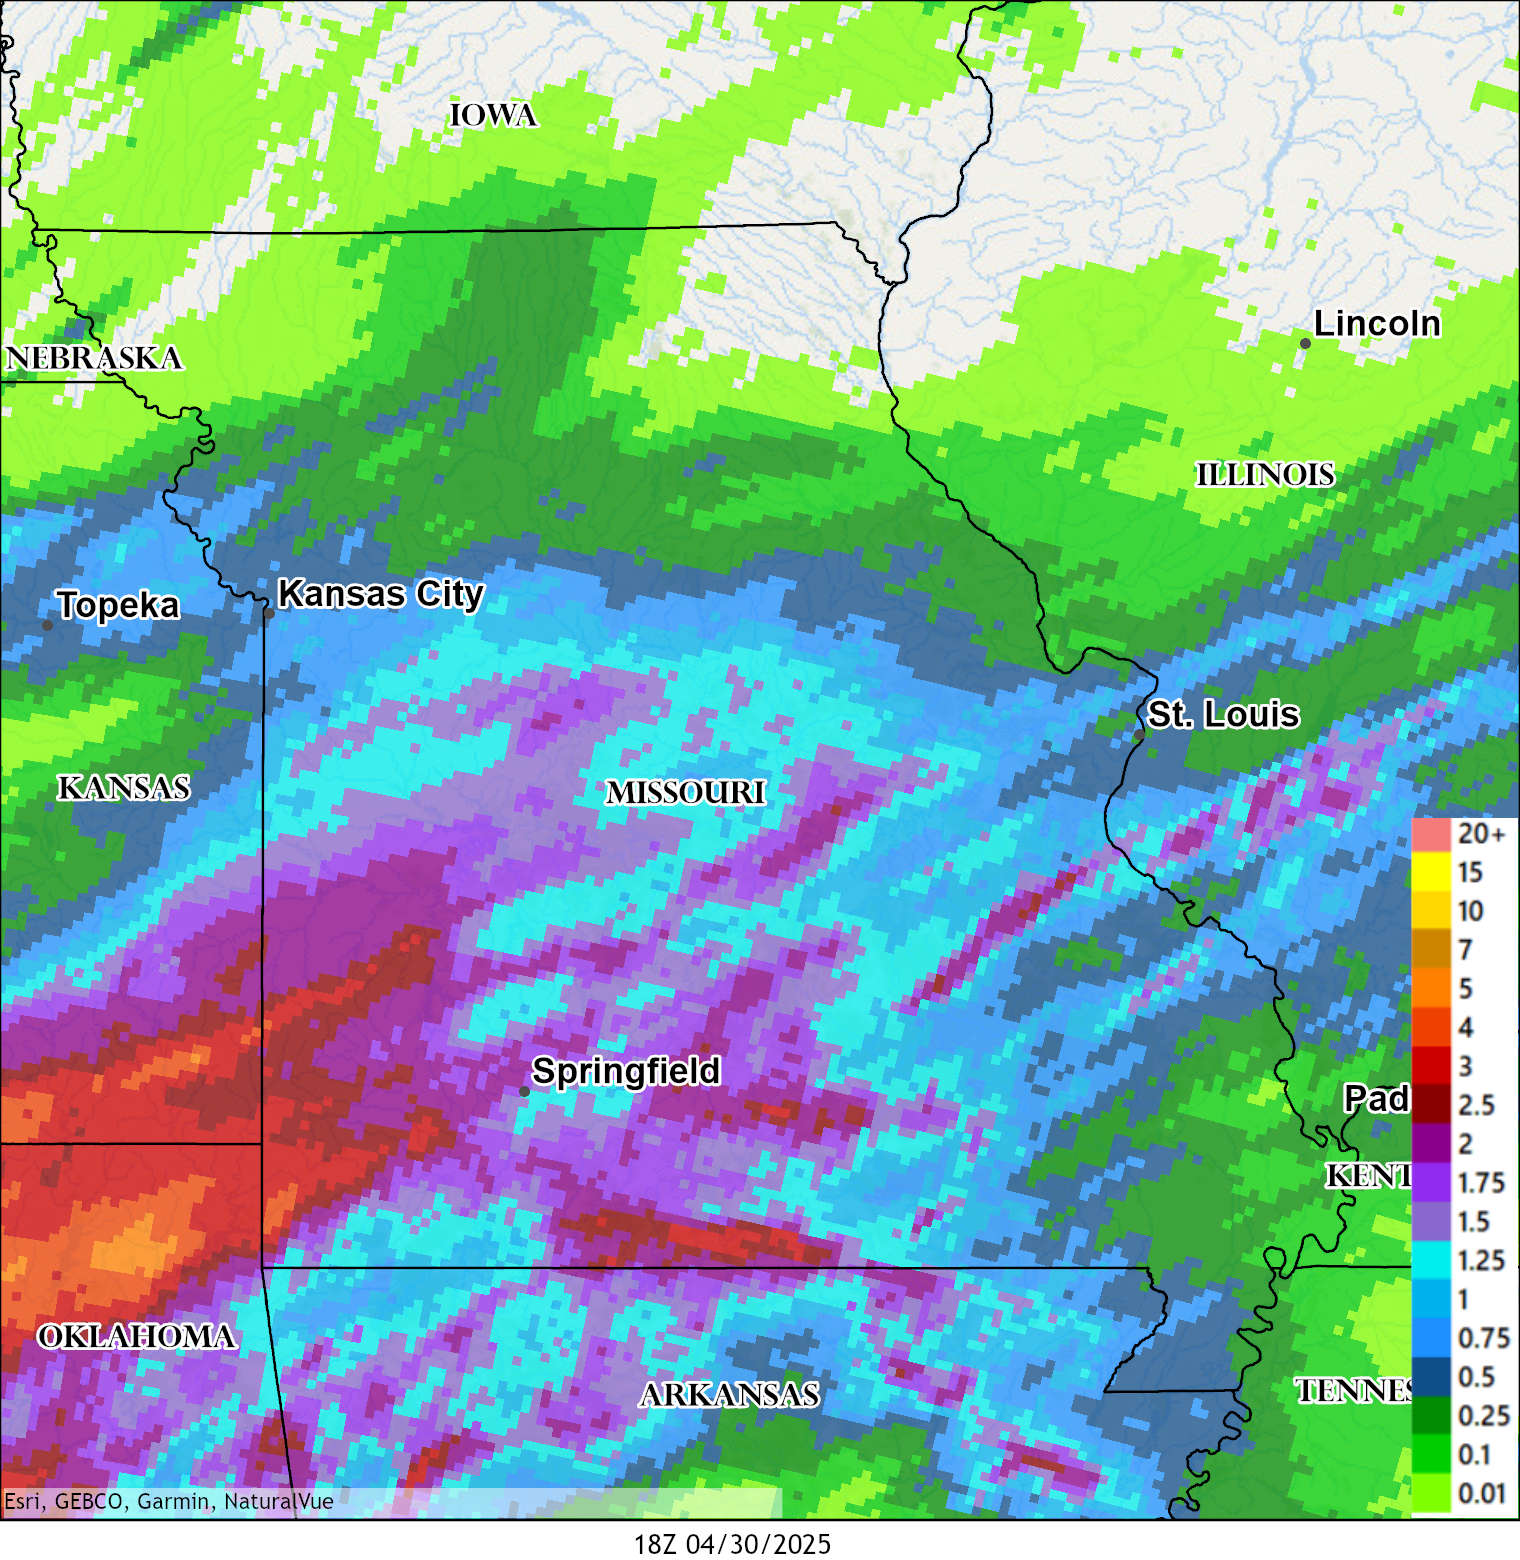
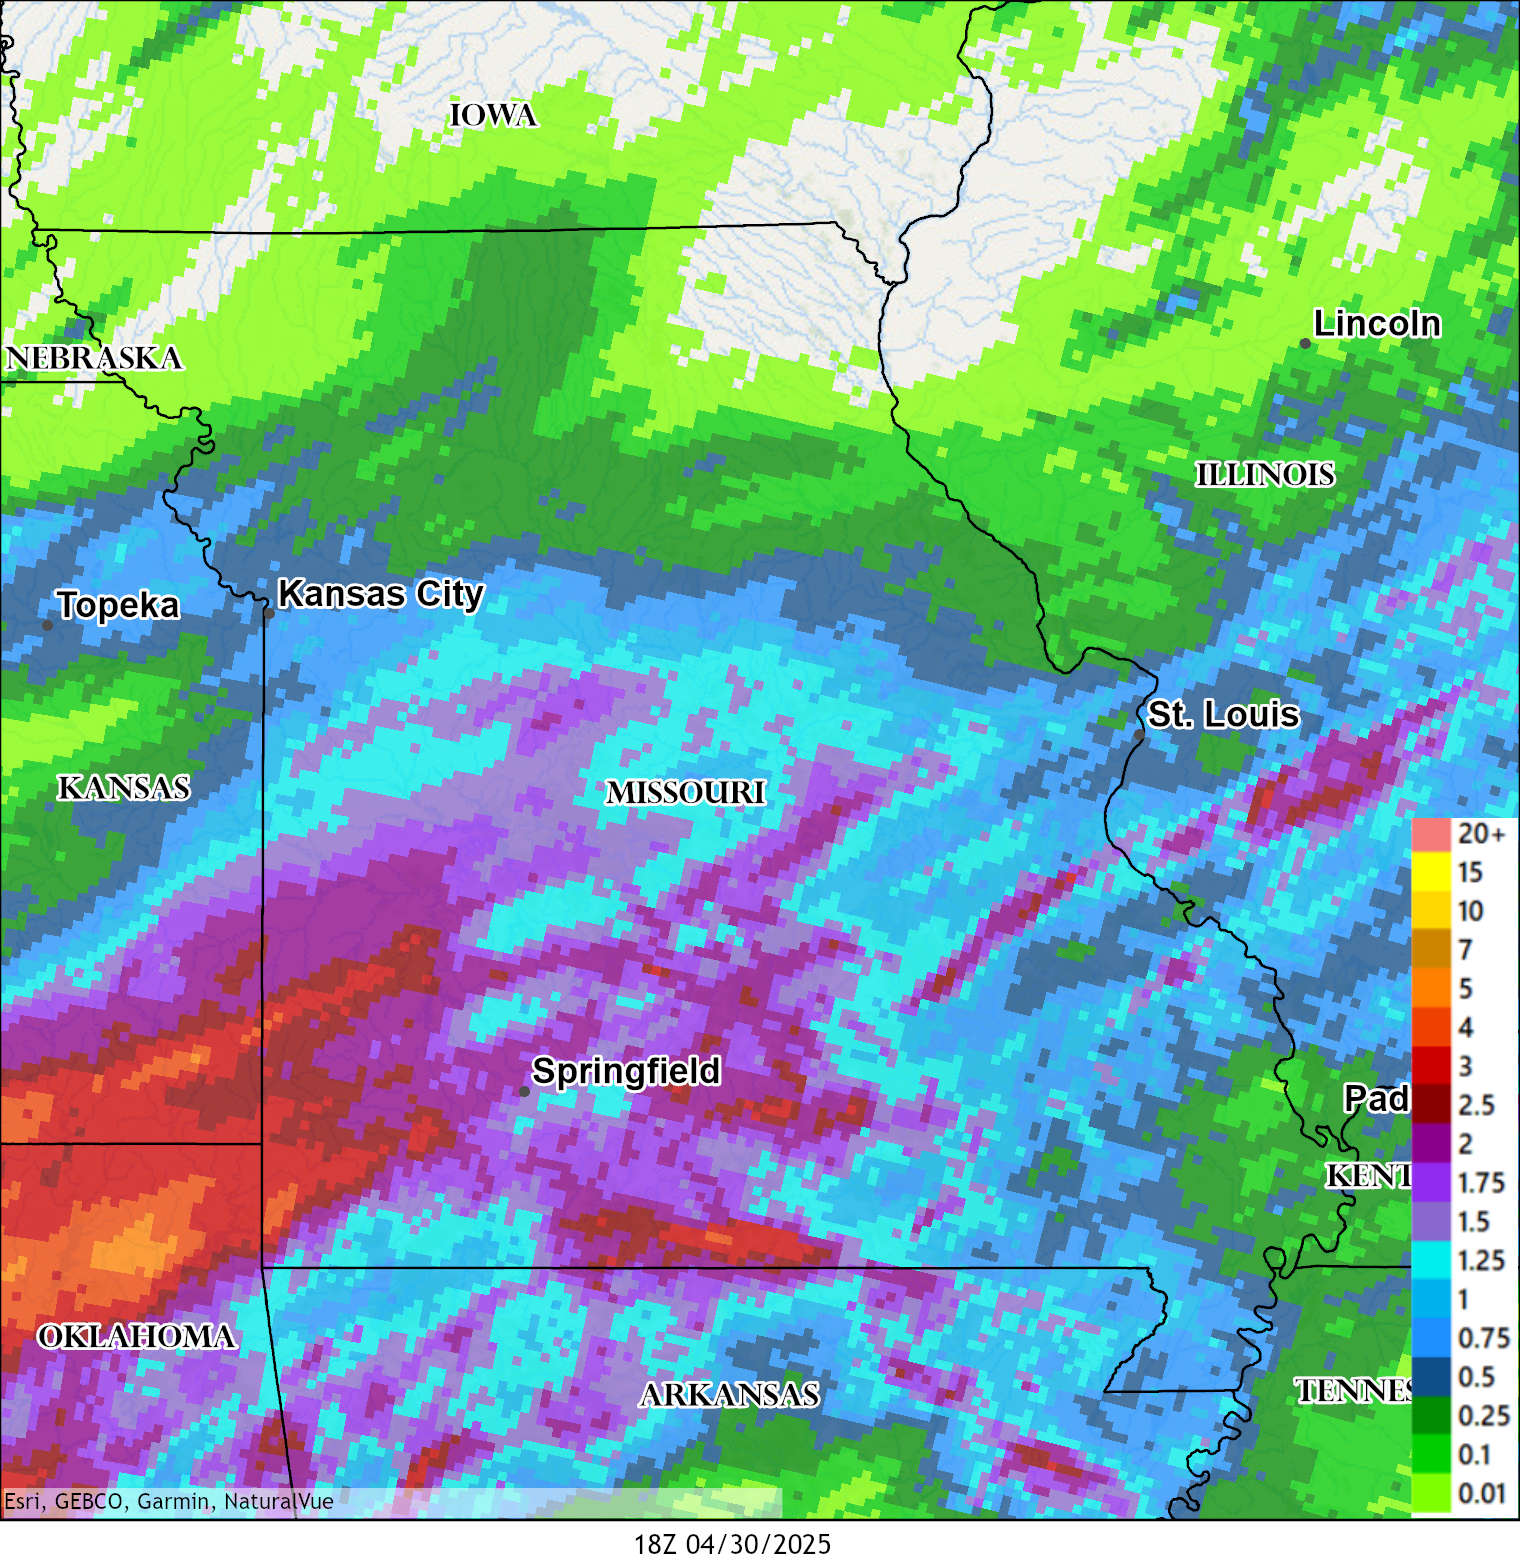
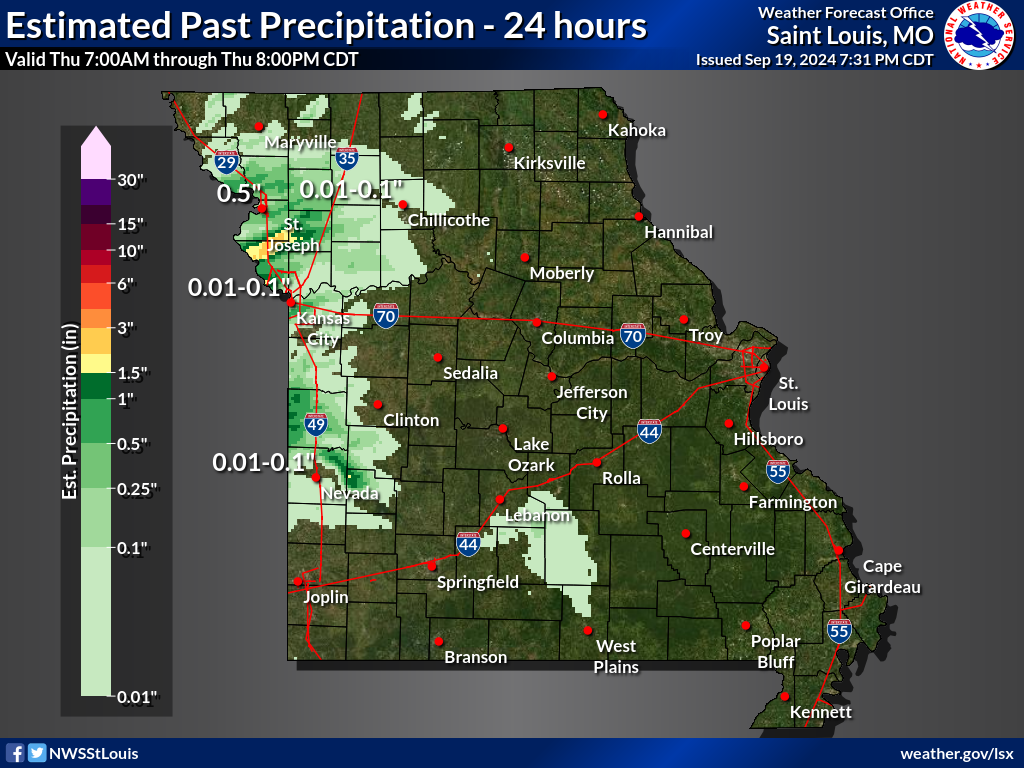
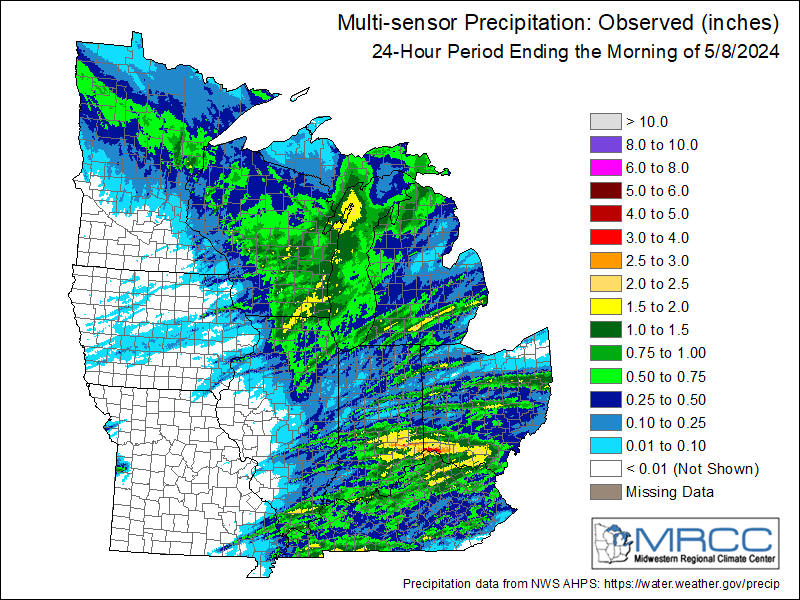
| Missouri 120 Hour Observed Precipitation | Missouri Estimated Precipitation | 24 Hour Precipitation Totals | 7 Day Precipitation Totals |
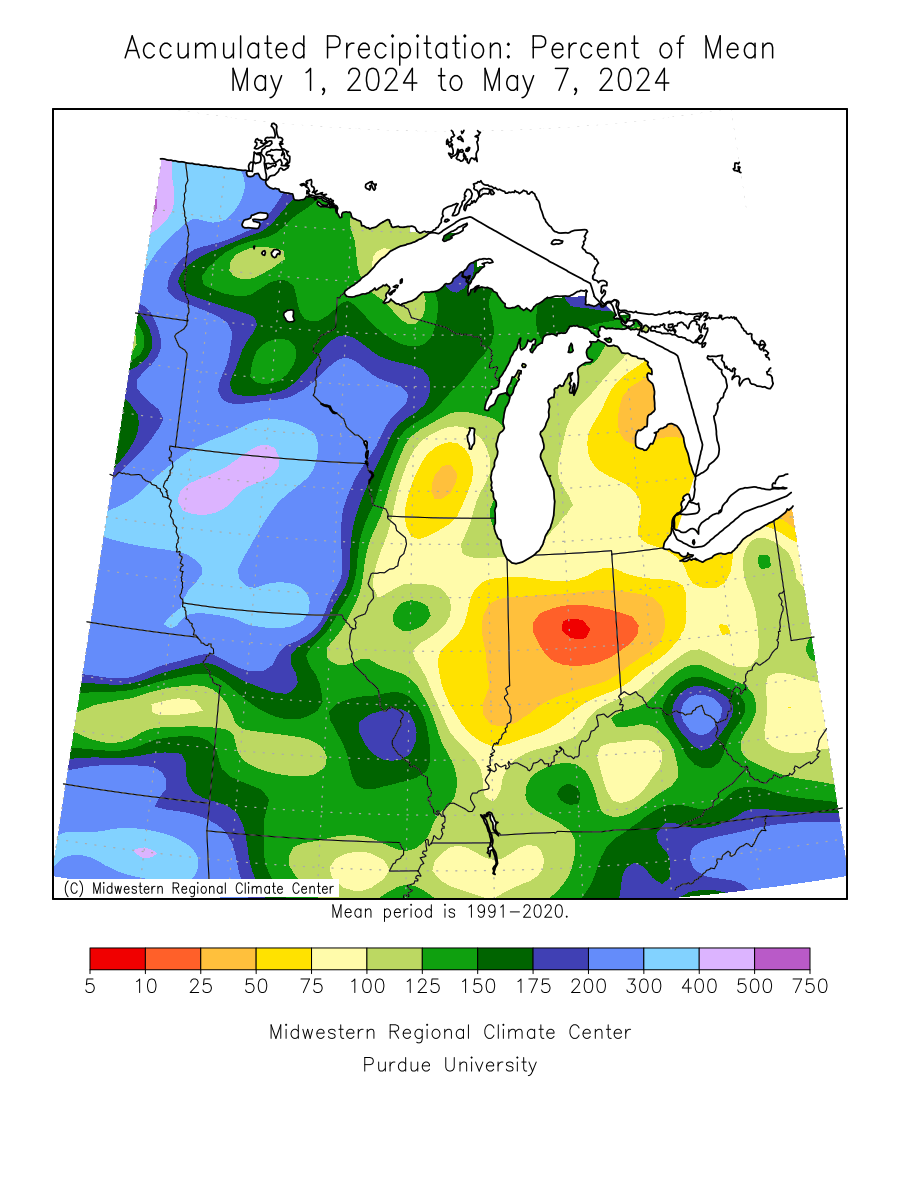 |
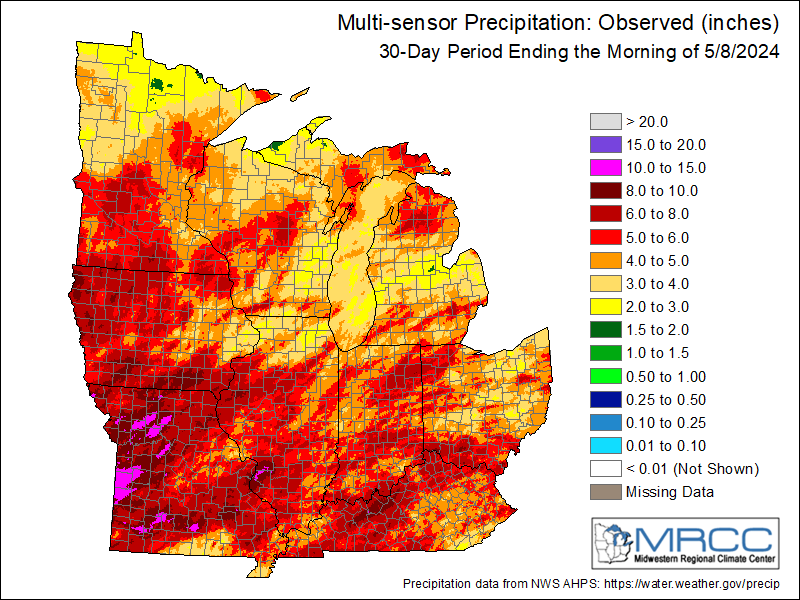 |
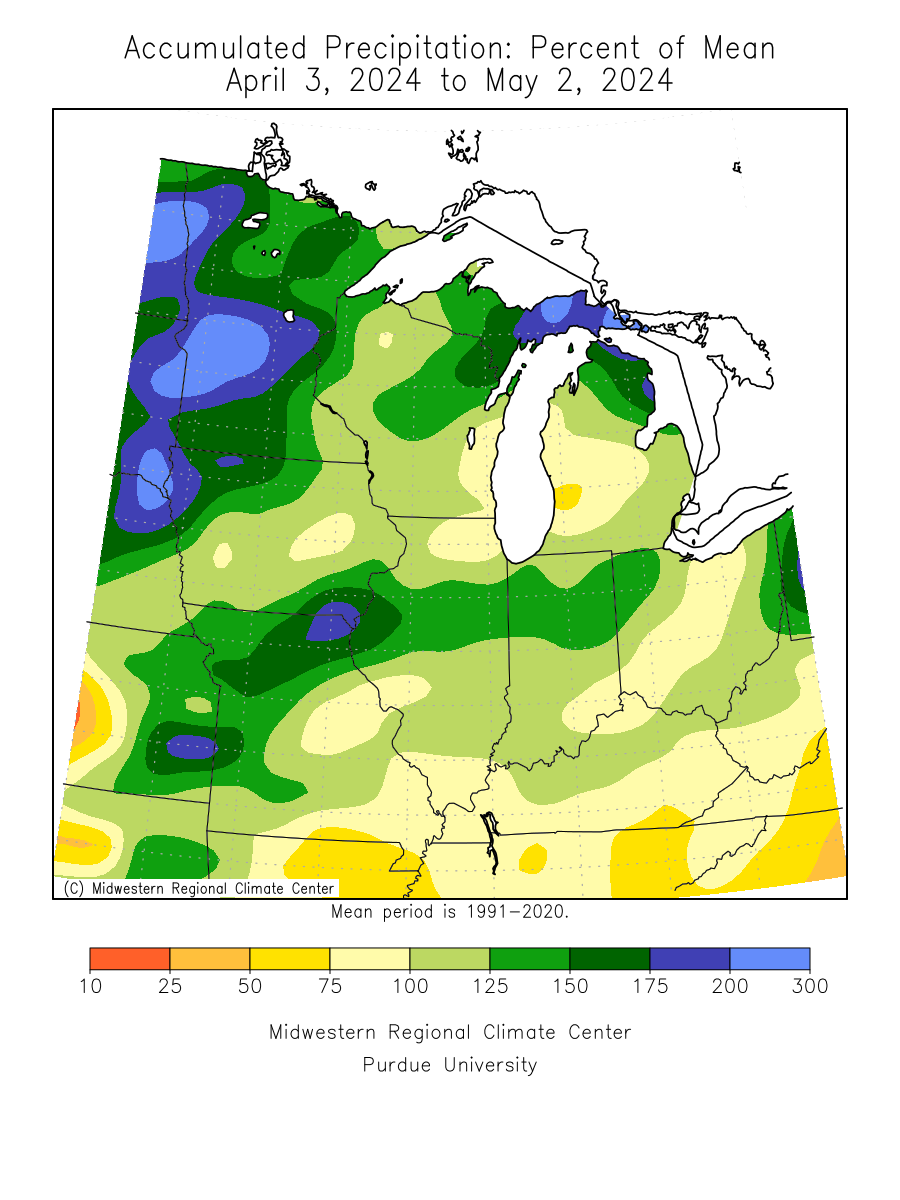 |
|
| 7 Day Accumulated Precipitation Percent of Mean | 30 Day Precipitation Totals | 30 Day Accumulated Precipitation Percent of Mean |
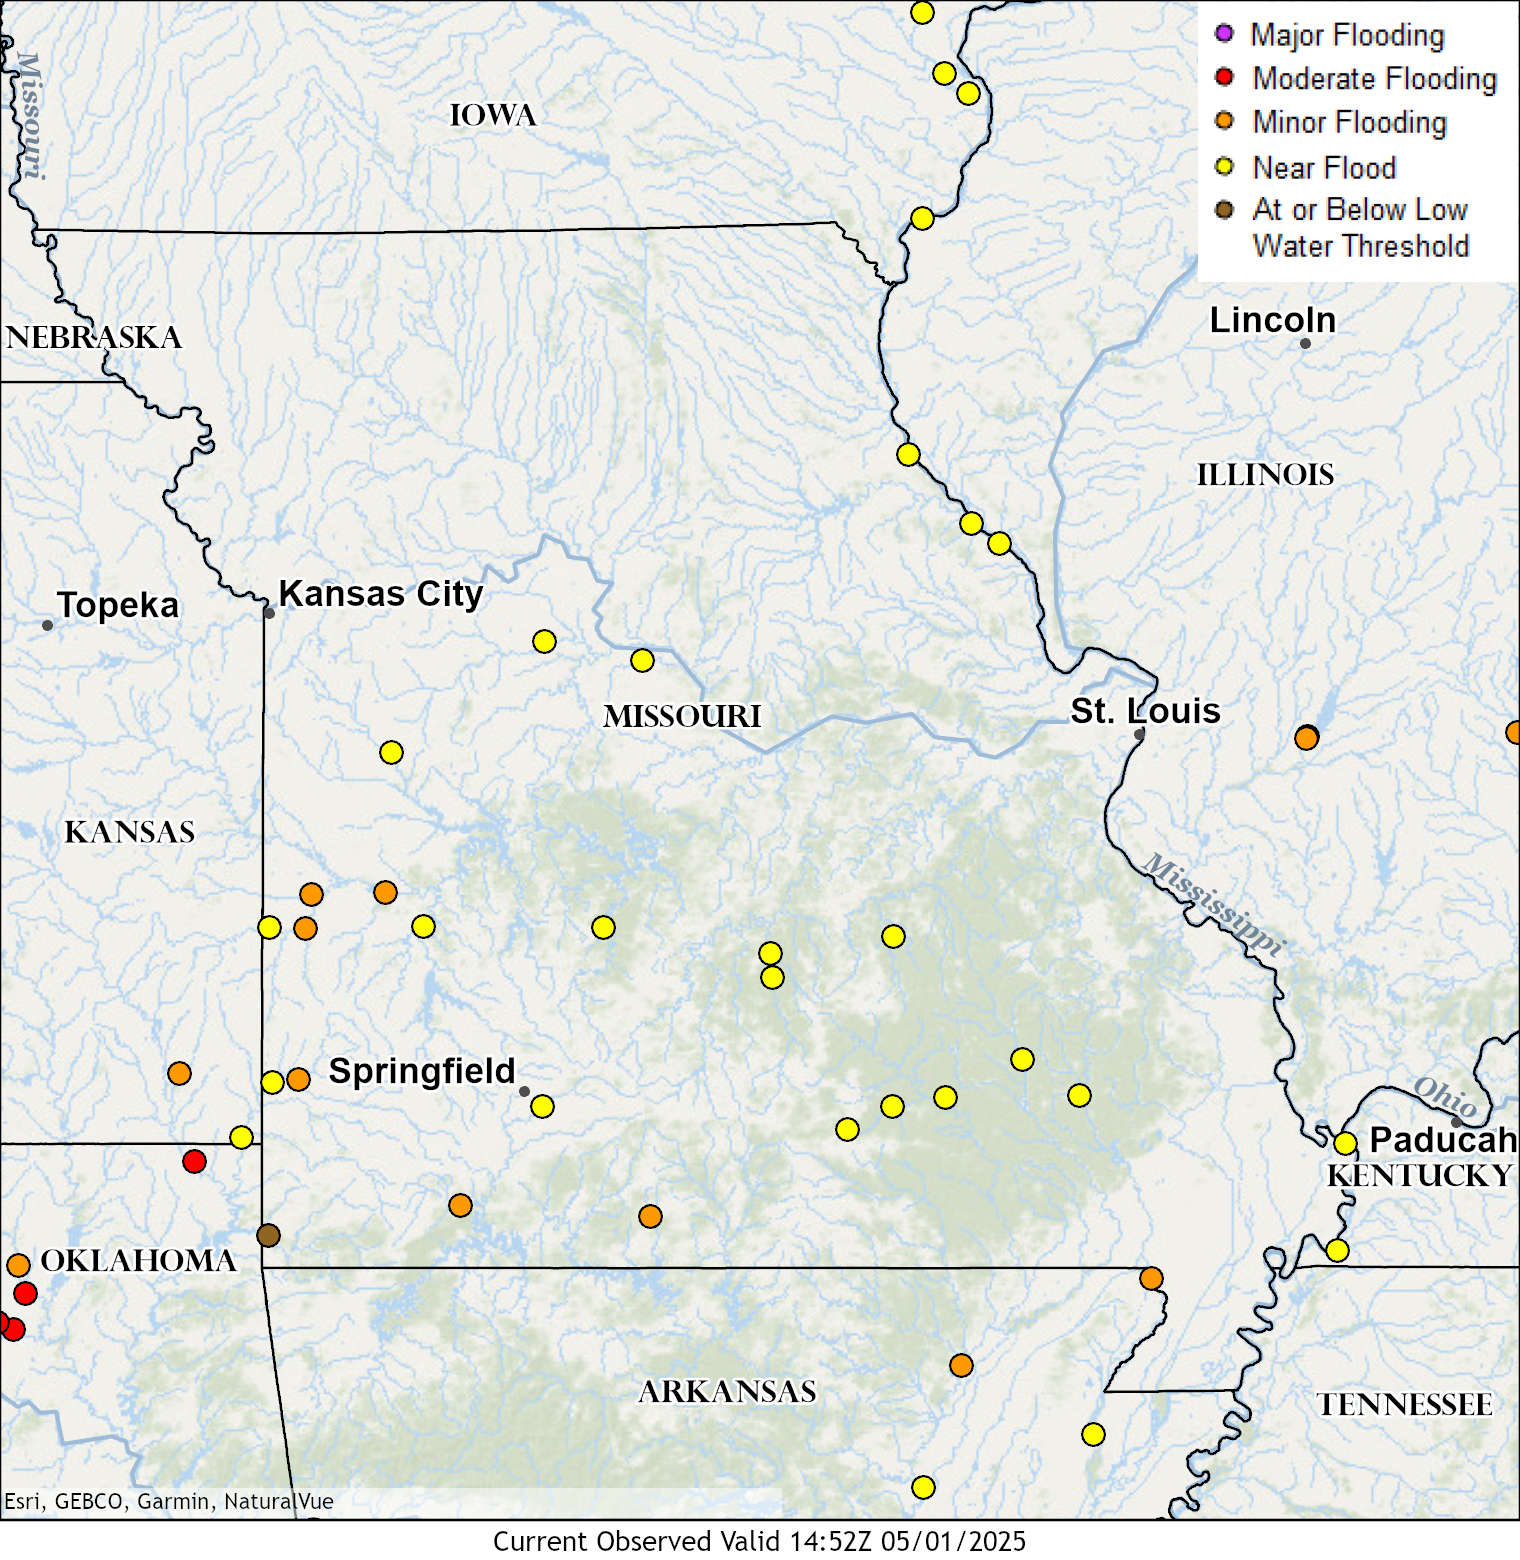
River Forecasts
 |
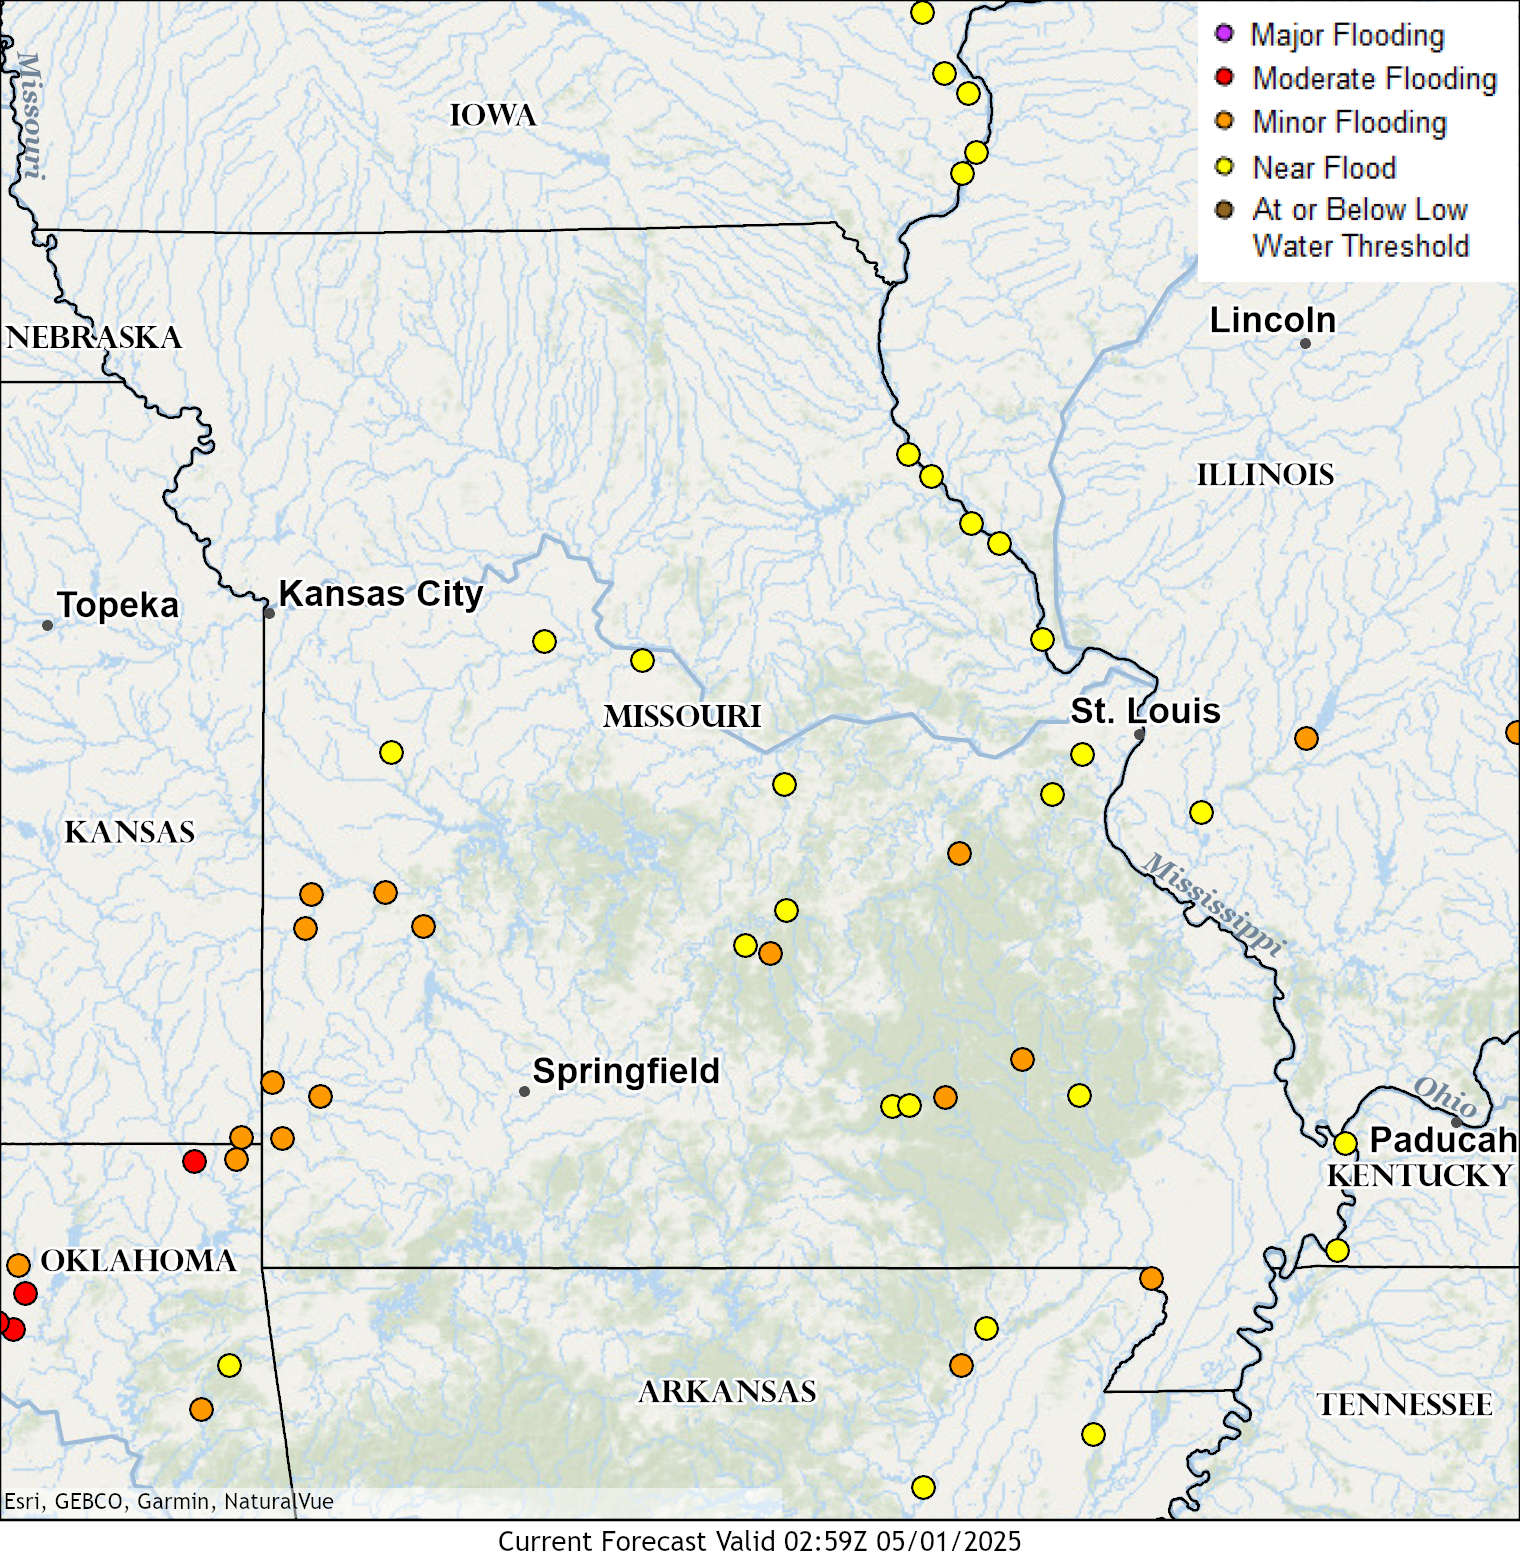 |
Missouri River Forecast Points (National Water Prediction Service) |
| Observed River Flooding (Missouri) [Updated every 1-2 hours from 9AM through 9PM] | Forecasted River Flooding (Missouri) [Updated every 1-2 hours from 9AM through 9PM] |
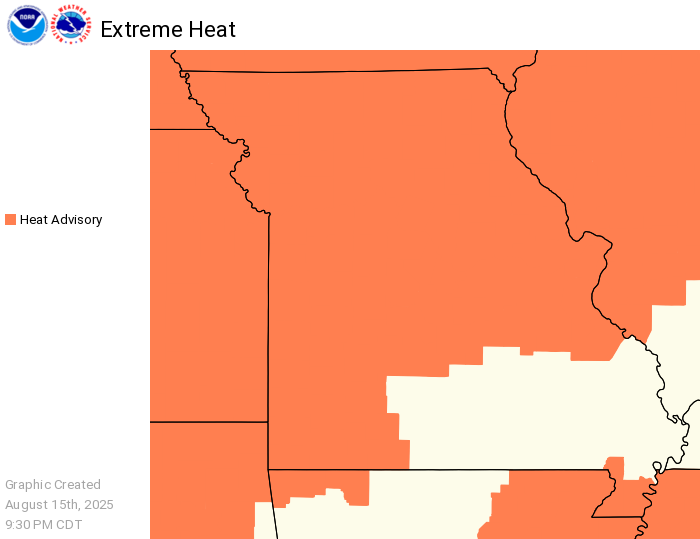
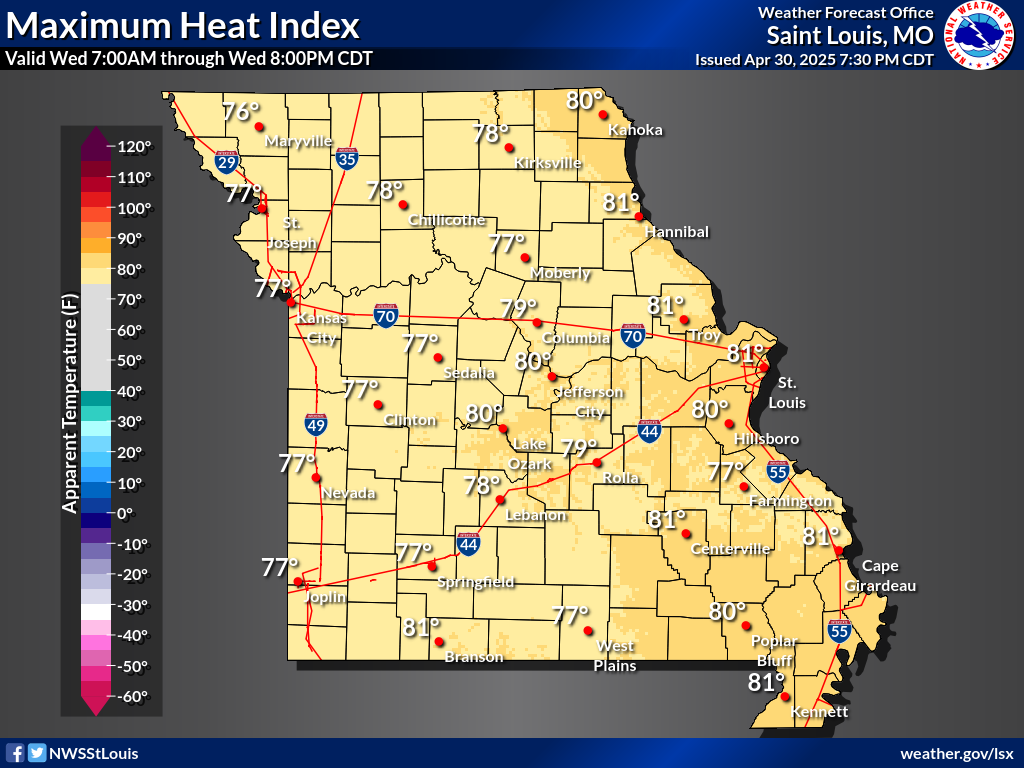
Heat
Days 1-7 Temperature and Heat Index Forecast
|
|
|
|
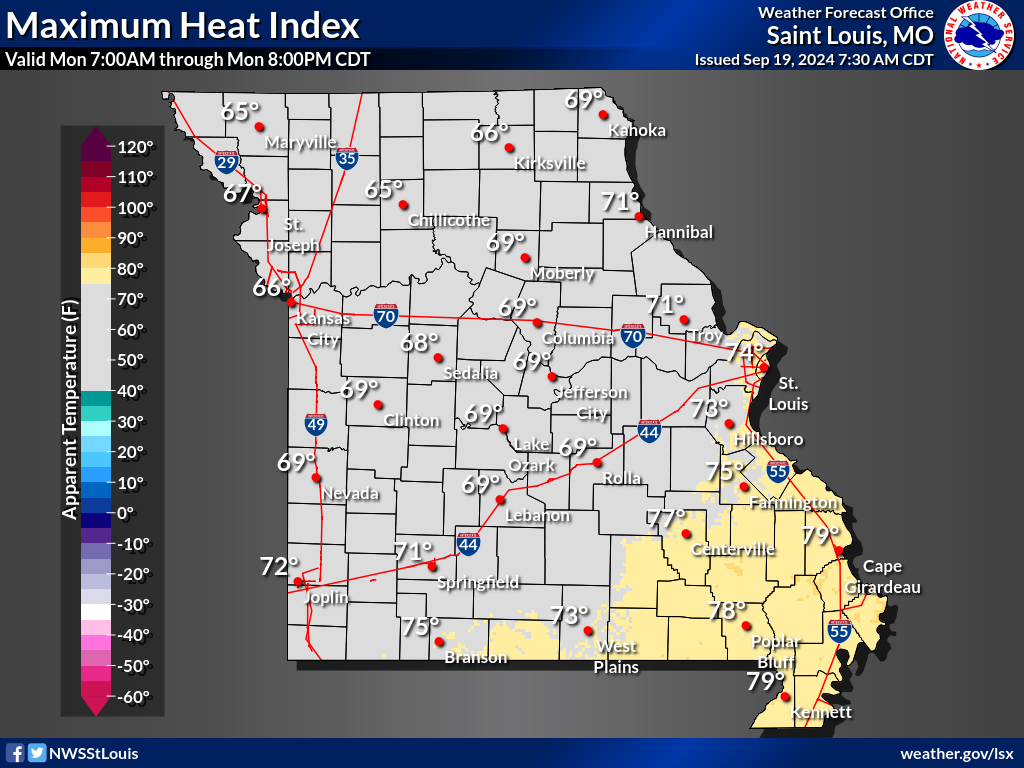
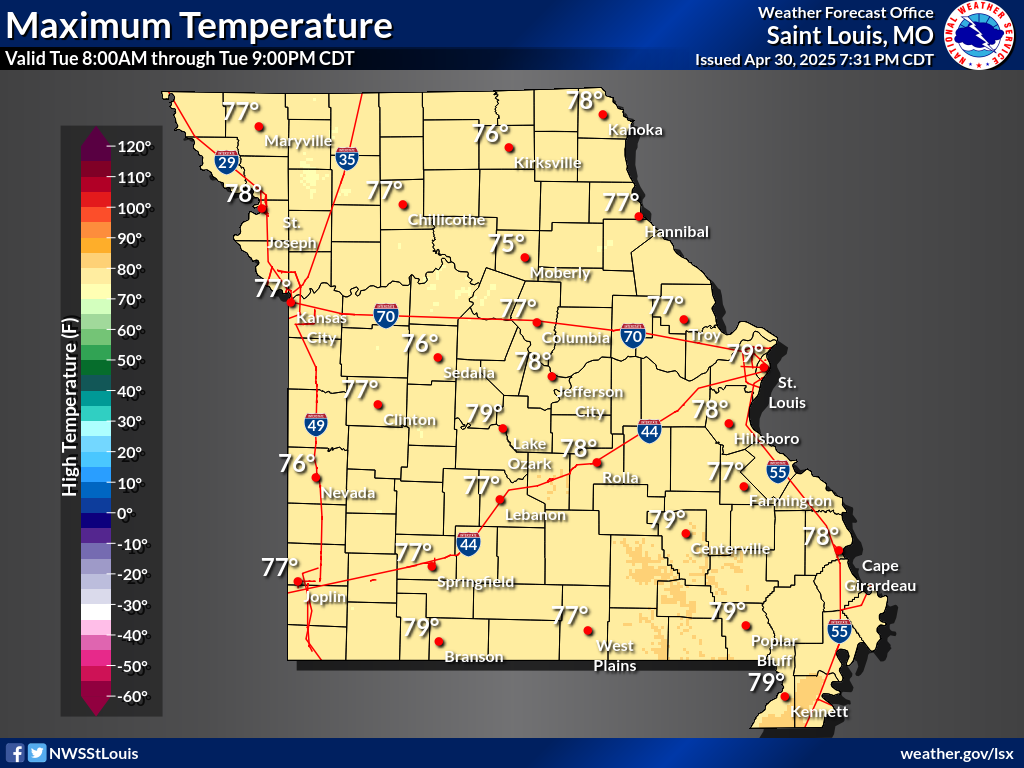
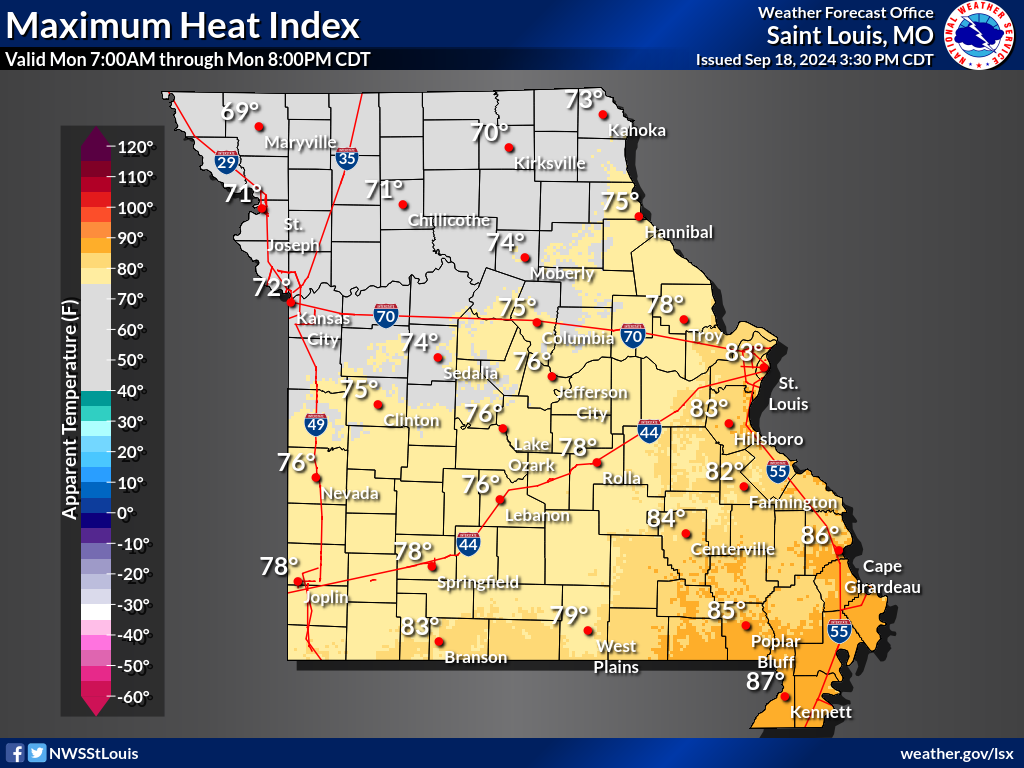
| Day 1 Maximum Temperature | Day 1 Heat Index | Day 2 Maximum Temperature | Day 2 Heat Index |
|
|
 |
 |
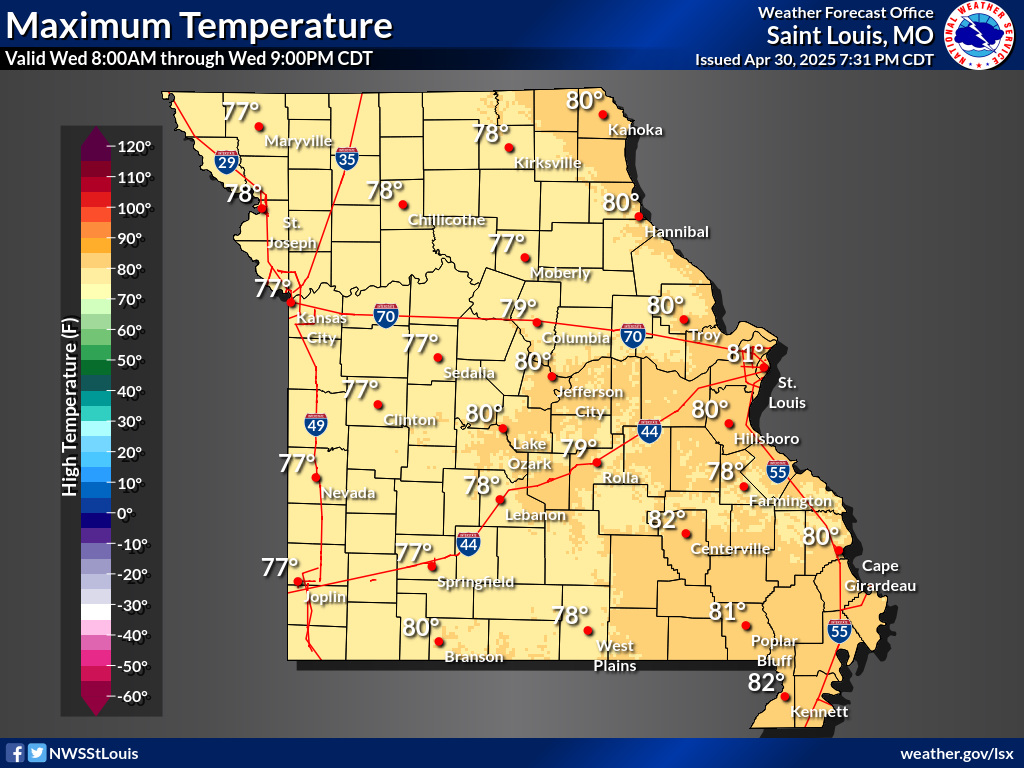
| Day 3 Maximum Temperature | Day 3 Heat Index | Day 4 Maximum Temperature | Day 4 Heat Index |
 |
 |
 |
 |
| Day 5 Maximum Temperature | Day 5 Heat Index | Day 6 Maximum Temperature | Day 6 Heat Index |
 |
 |
||
| Day 7 Maximum Temperature | Day 7 Heat Index |
Temperature Outlooks
 |
 |
 |
 |
| Next Week's Risk of Hazardous Temperatures | 6-10 Day Temperature Outlook | 8-14 Day Temperature Outlook | 3-4 Week Temperature Outlook |
 |
 |
||
| One Month Temperature Outlook | Three Month Temperature Outlook |
Fire Weather
Fire Weather Outlooks
 |
 |
 |
 |
| Fire Weather Outlook: Day 1 | Fire Weather Outlook: Day 2 | Fire Weather Outlook: Day 3 | Fire Weather Outlook: Day 4 |
 |
 |
 |
 |
| Fire Weather Outlook: Day 5 | Fire Weather Outlook: Day 6 | Fire Weather Outlook: Day 7 | Fire Weather Outlook: Day 8 |
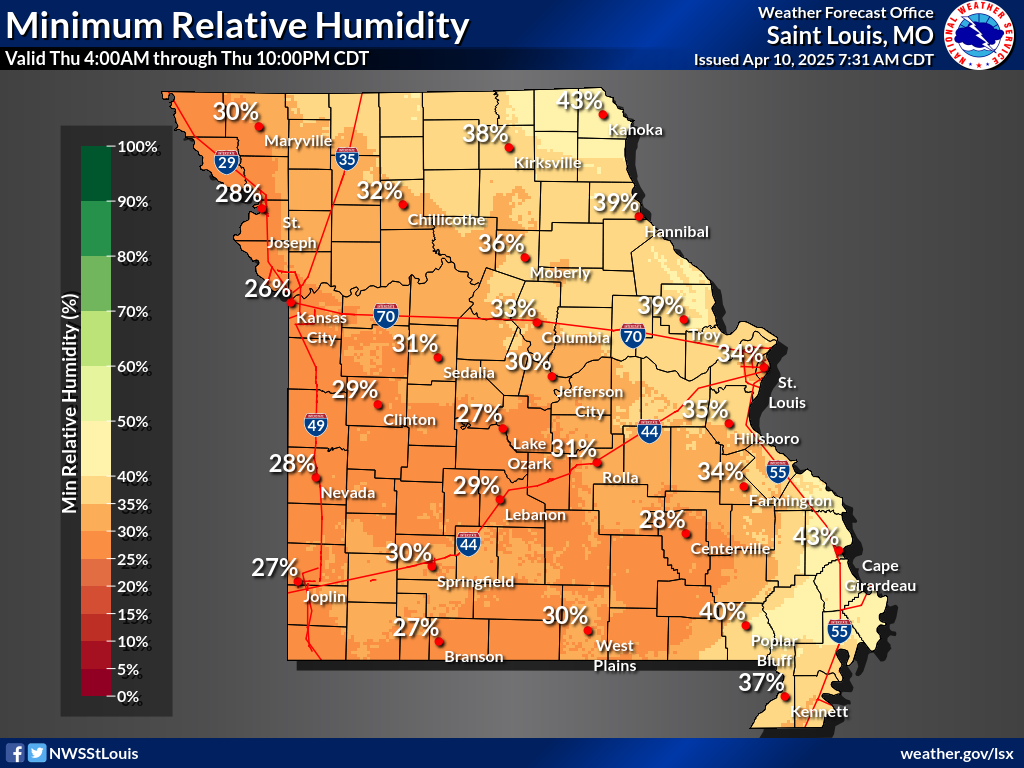
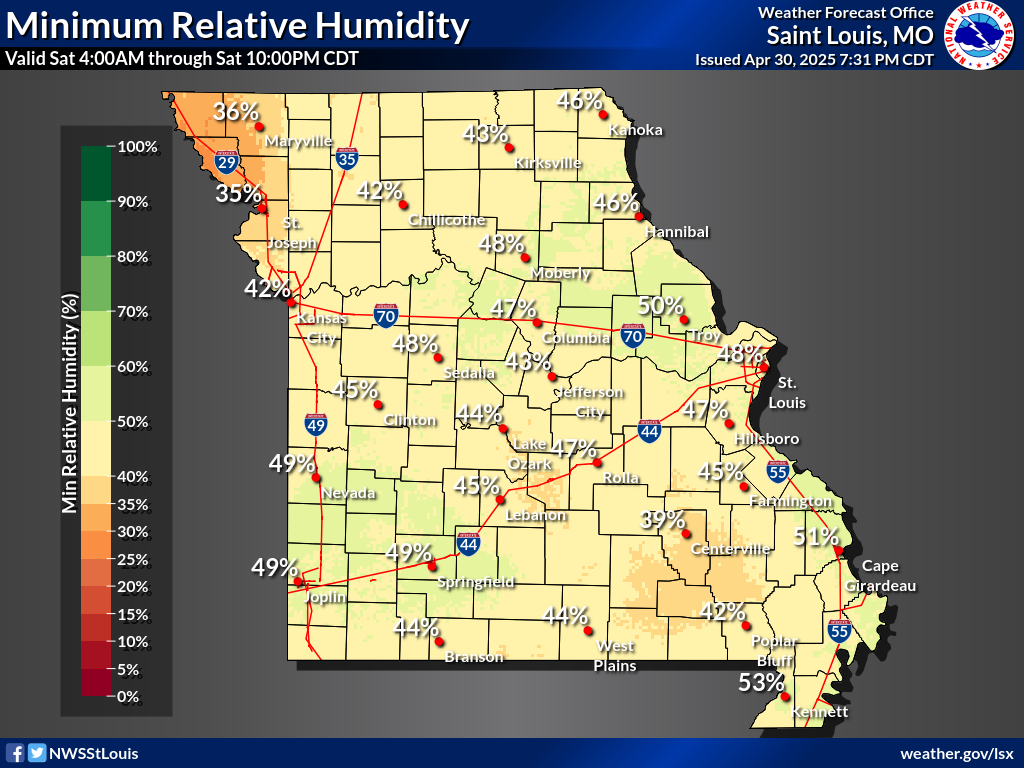
Fire Weather Guidance
 |
|
 |
|
| Day 1 Minimum Relative Humidity (RH) | Day 1 Maximum Wind Gust | Day 2 Minimum Relative Humidity (RH) | Day 2 Maximum Wind Gust |
 |
|
|
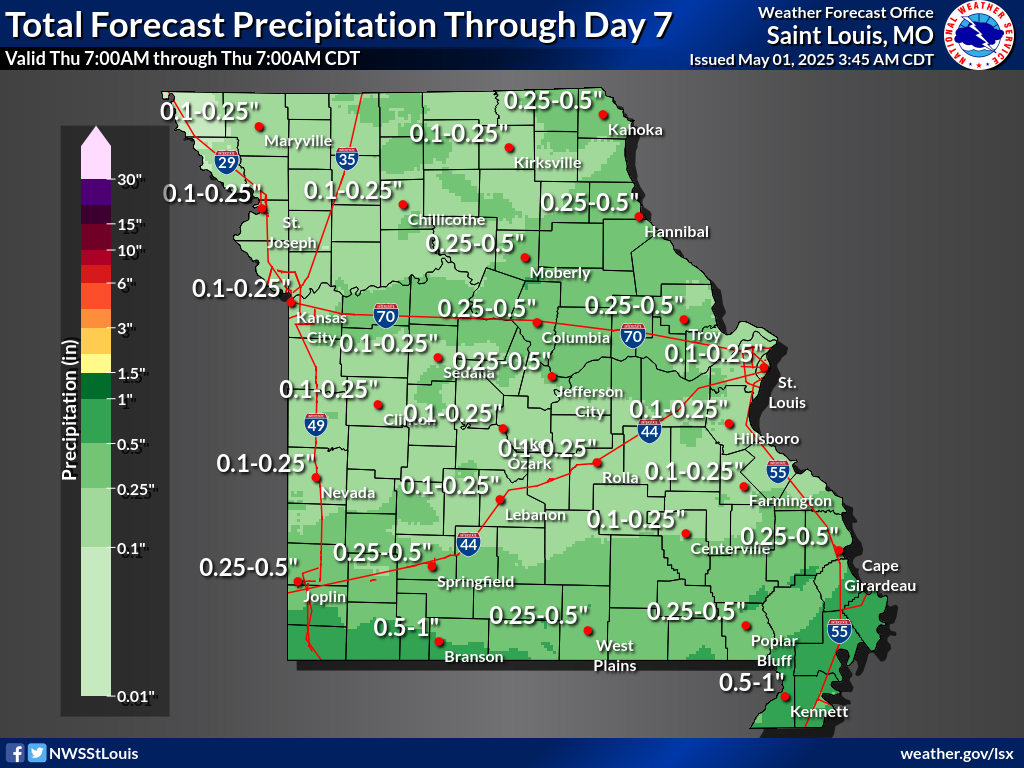 |
| Day 3 Minimum Relative Humidity (RH) | Day 3 Maximum Wind Gust | Estimated 24 Hour Past Precipitation | Total Forecasted Precipitation Days 1-7 |
Fire Weather Indices
 |
 |
 |
|
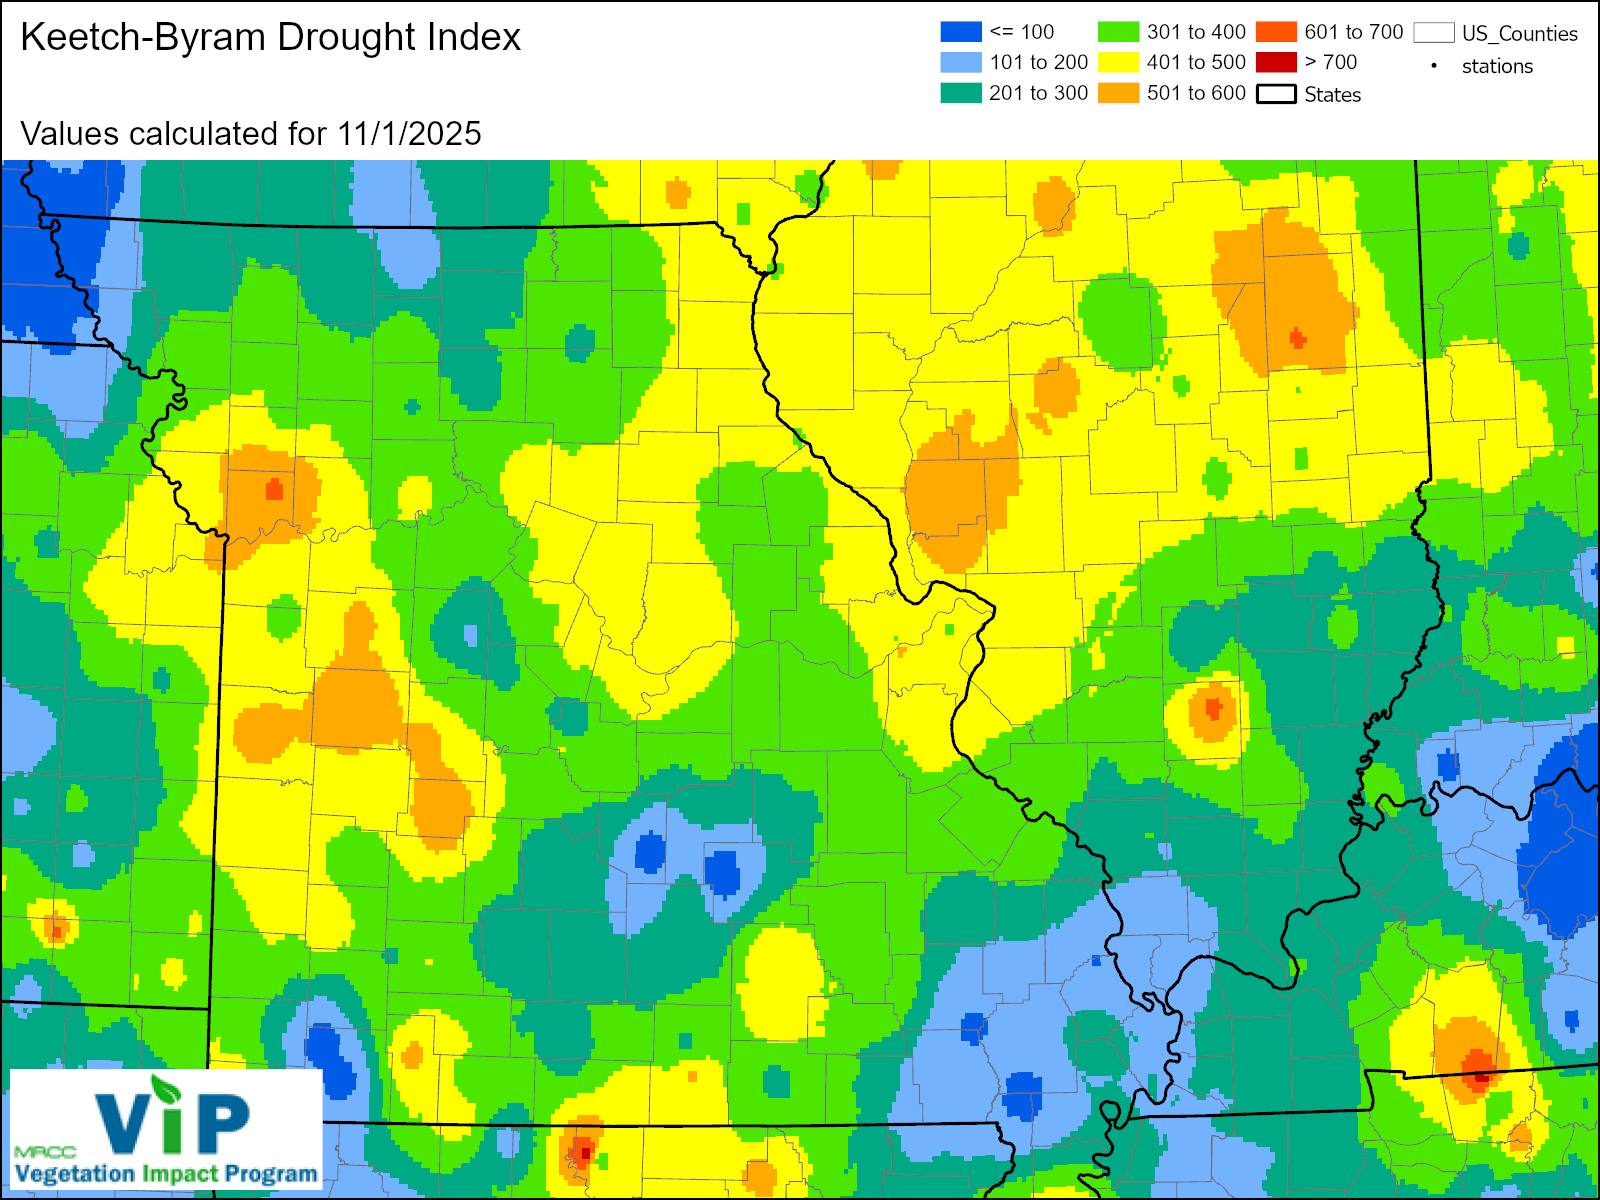
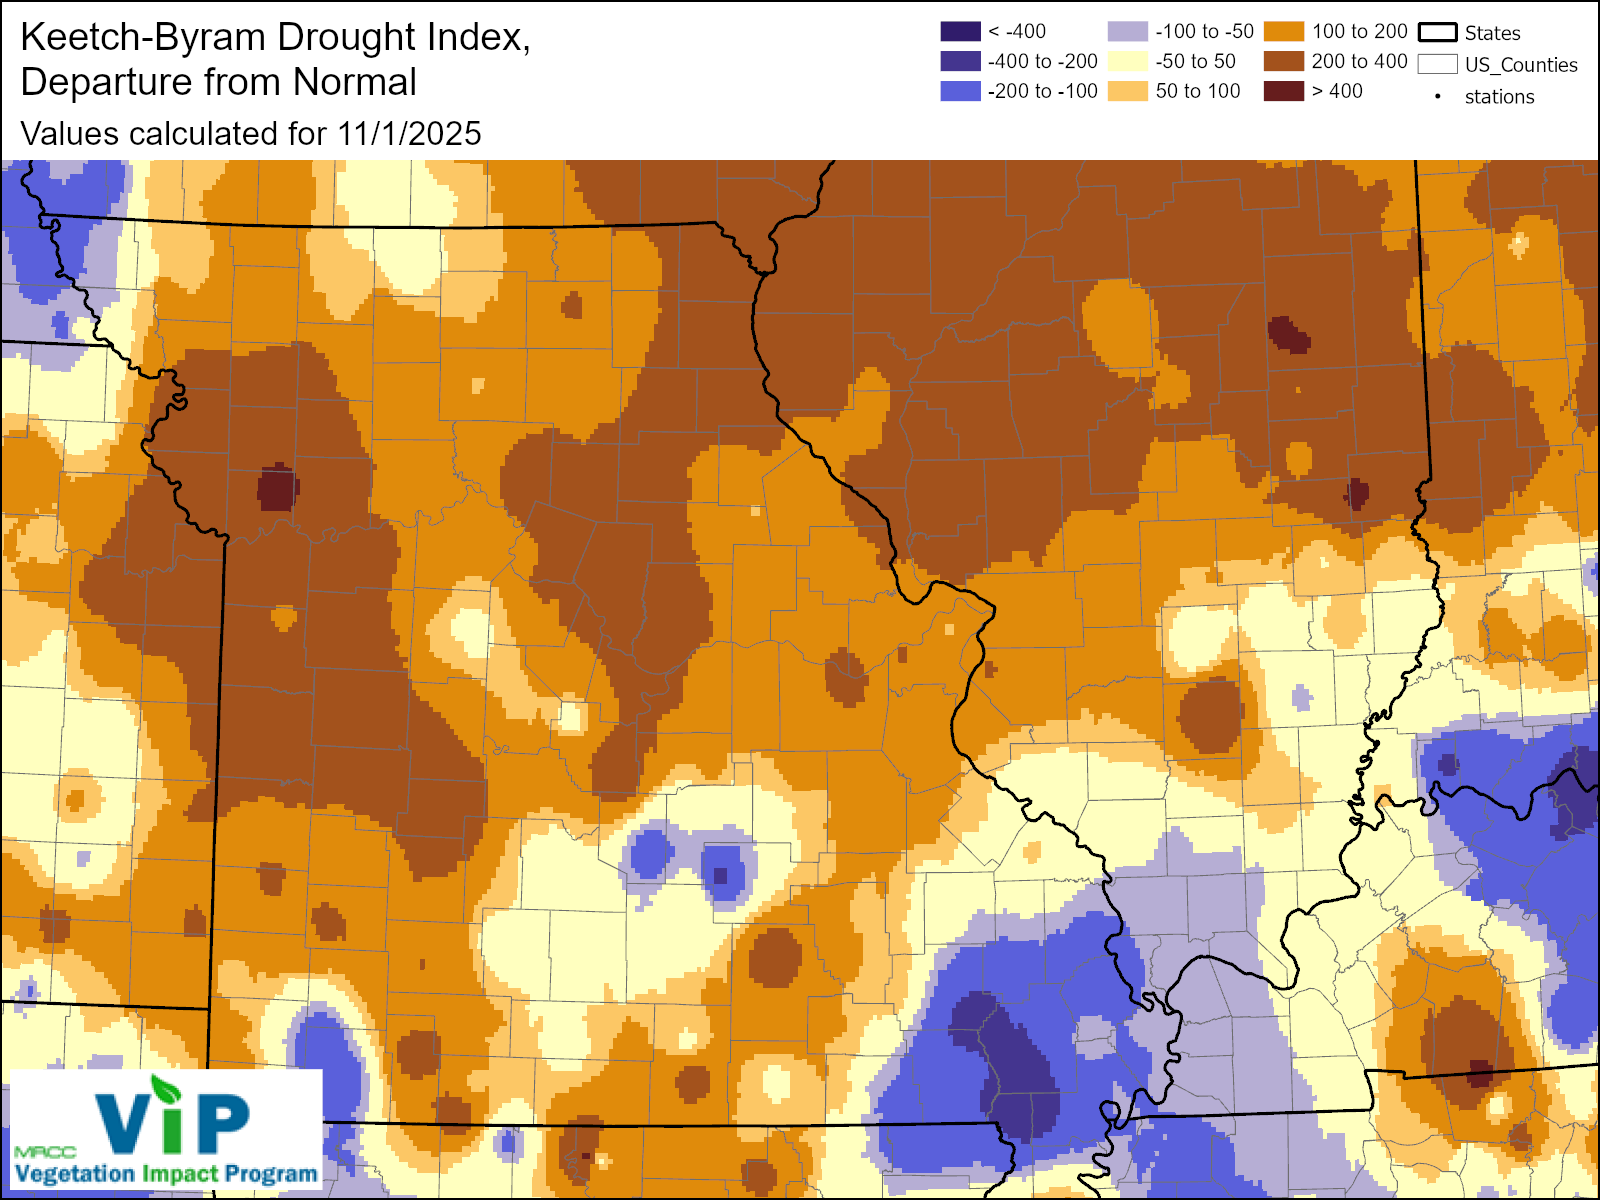
| Drought Monitor: Missouri | Keetch-Byram Drought Index | KBDI Departures from Normal | |
 |
 |
 |
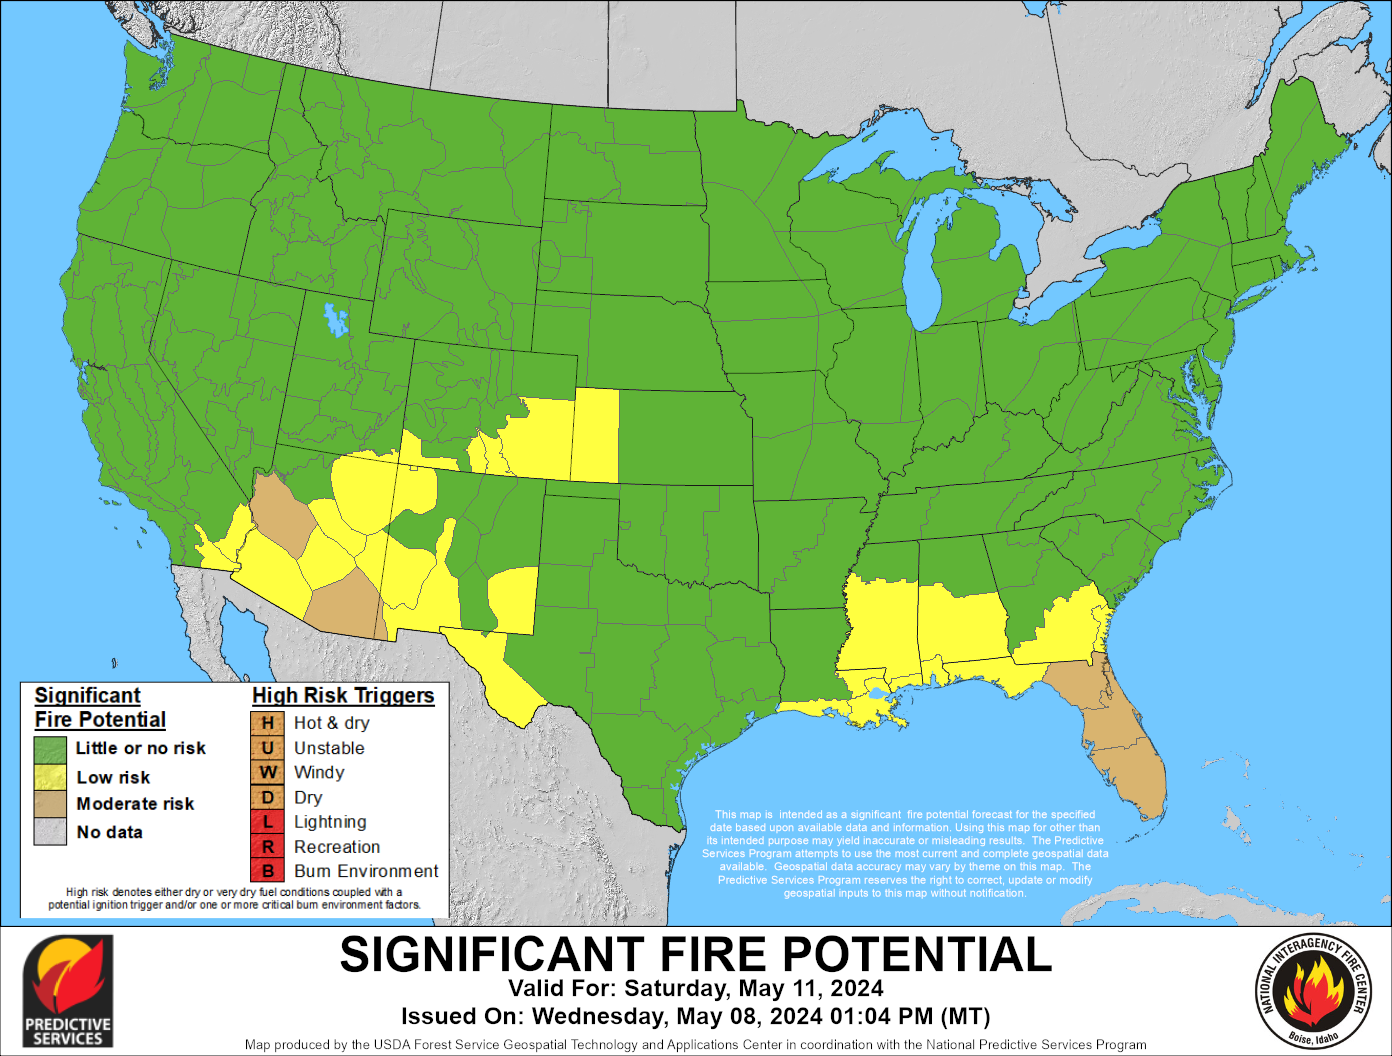 |
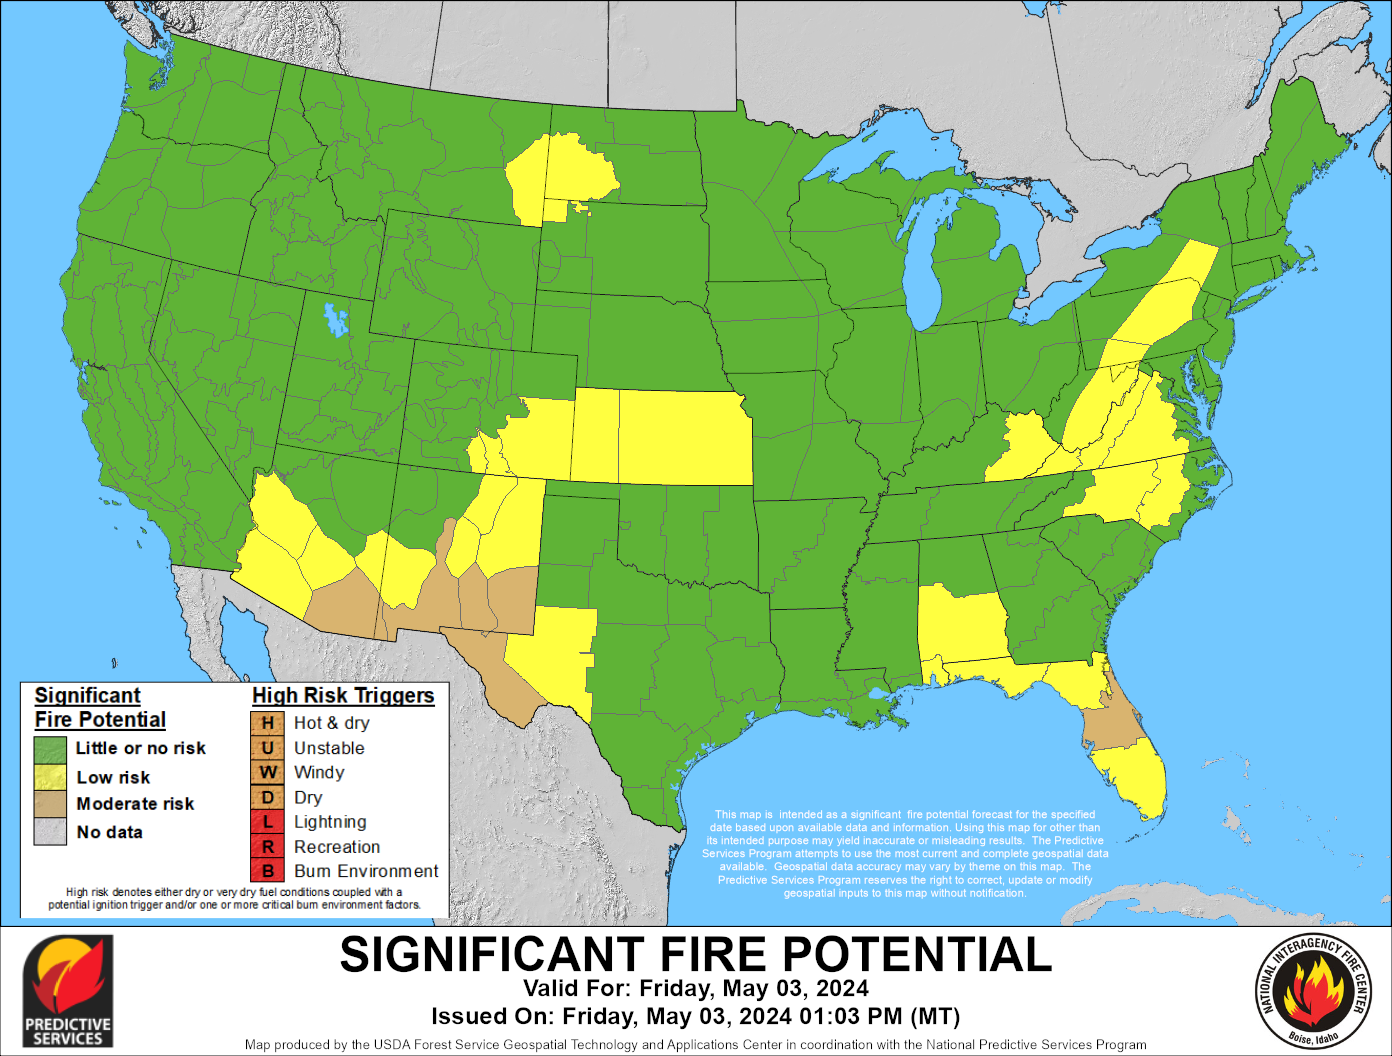
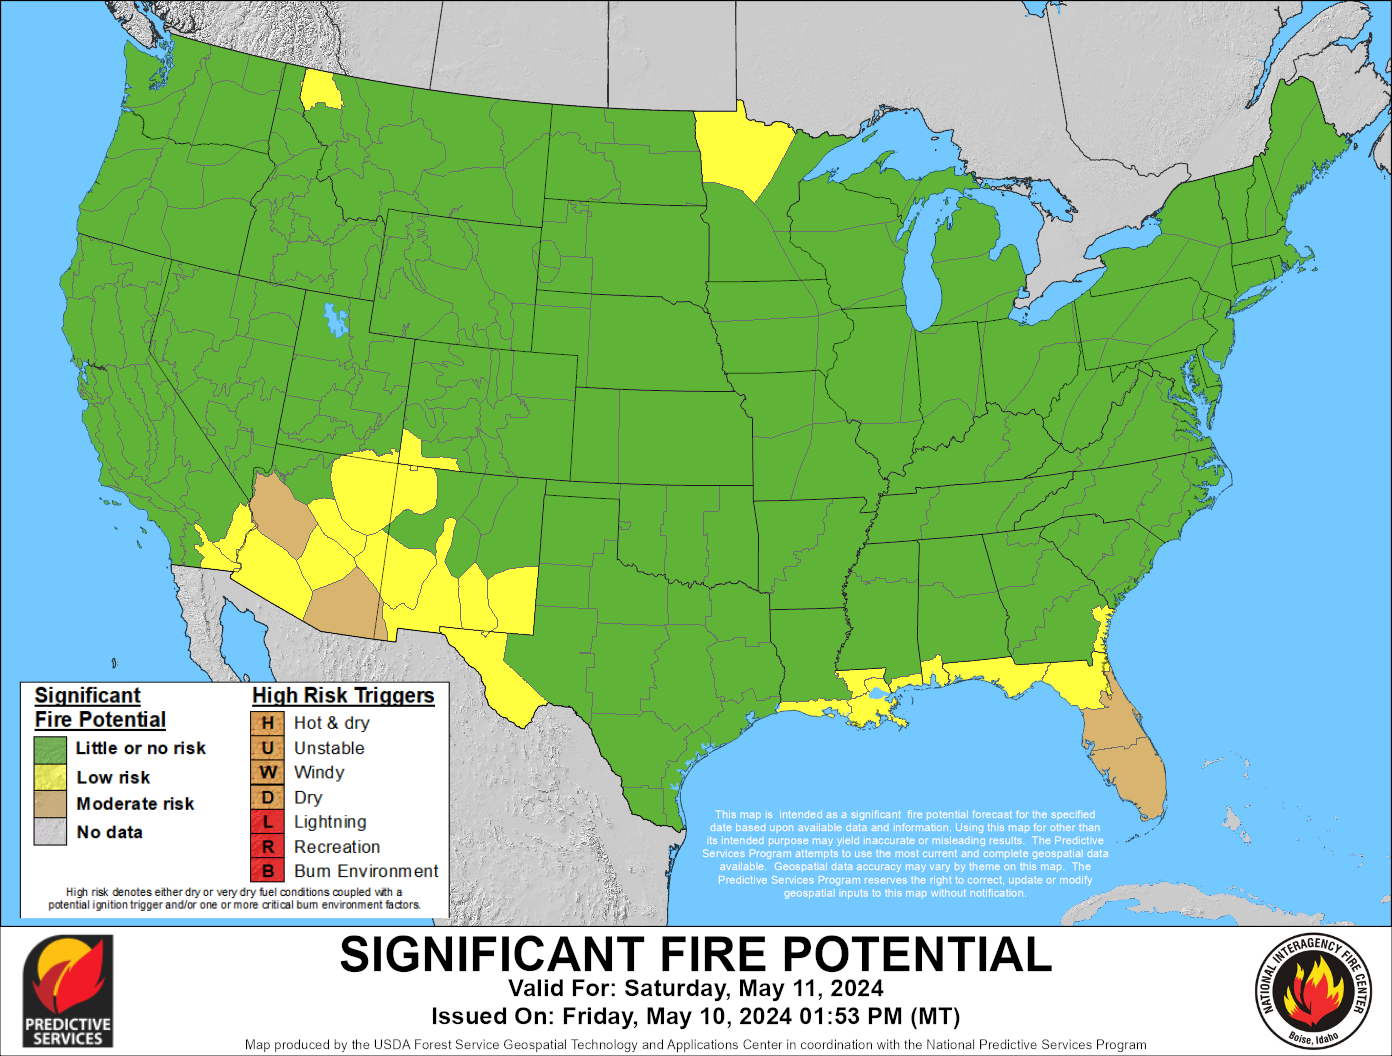
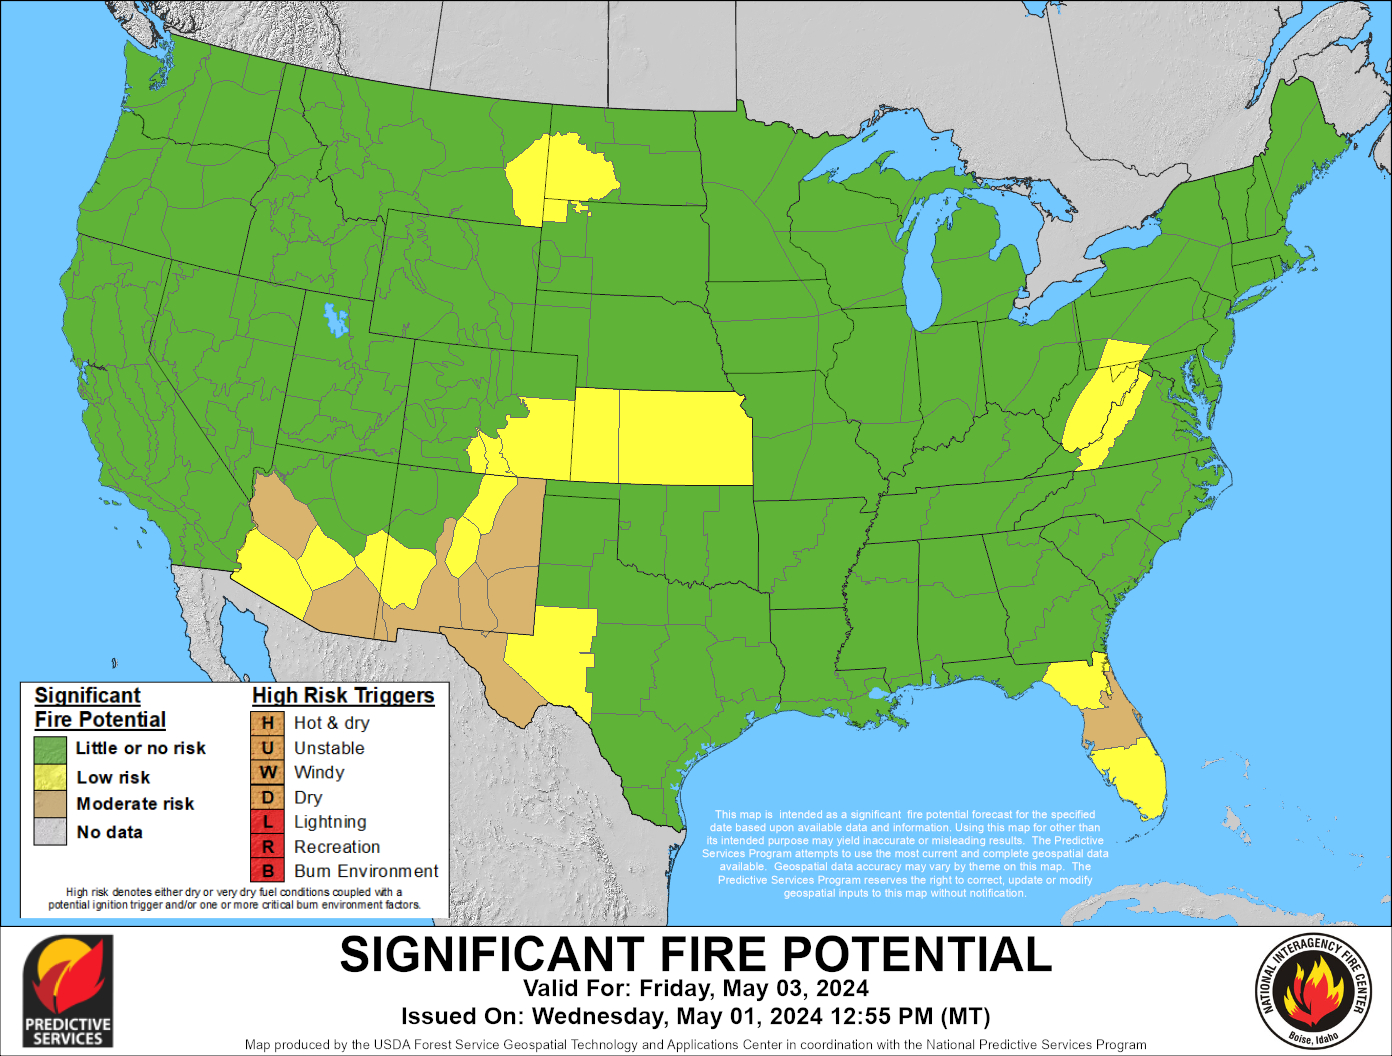
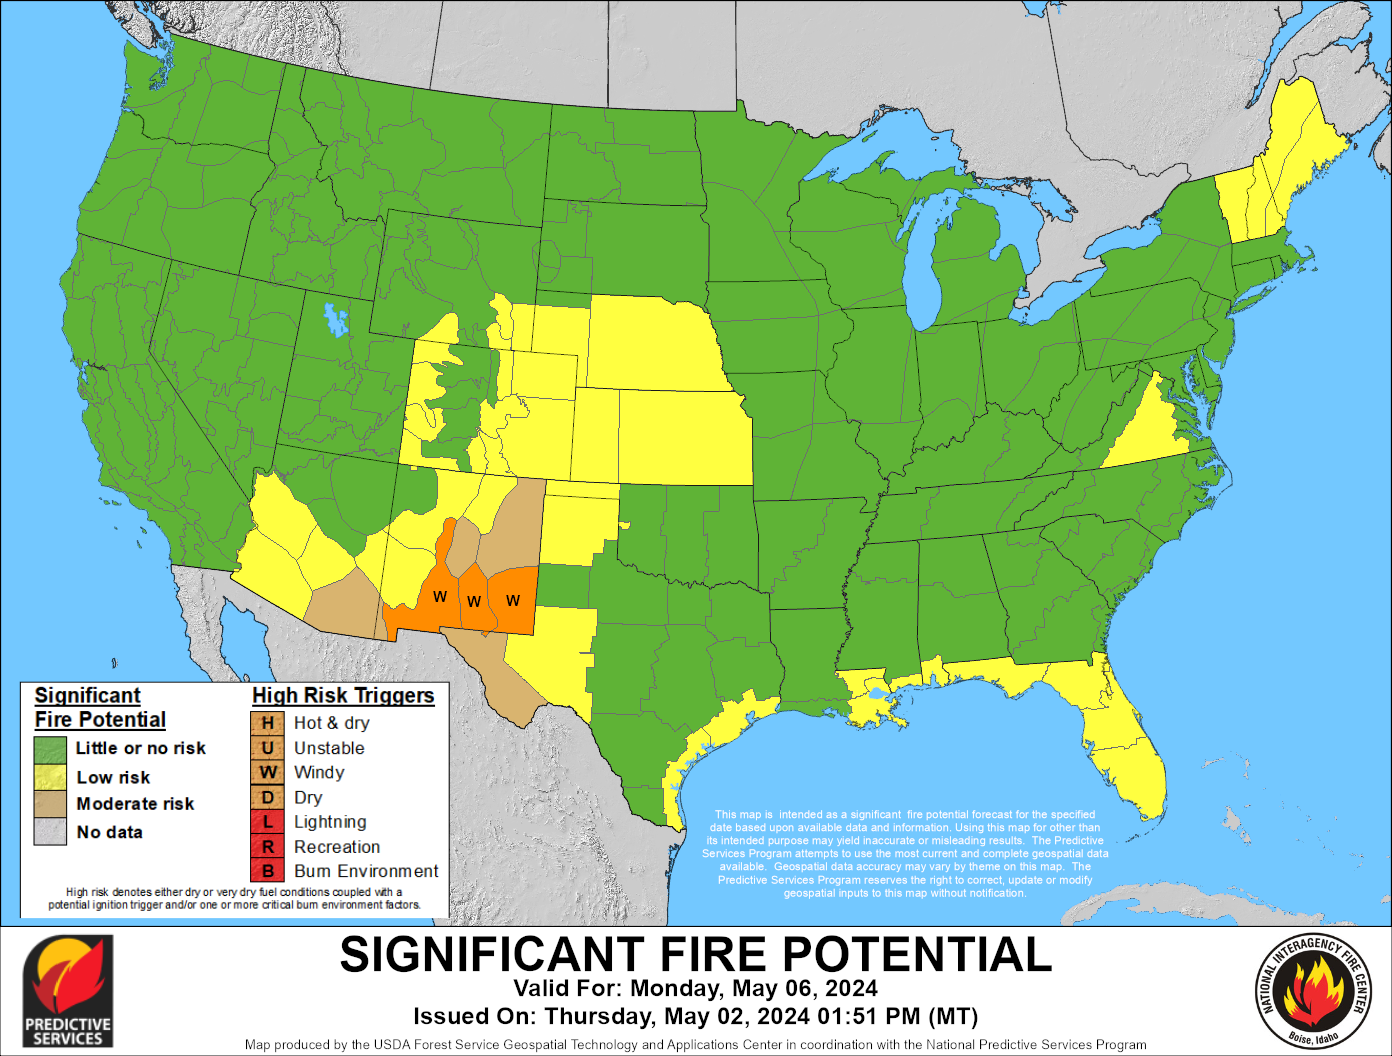
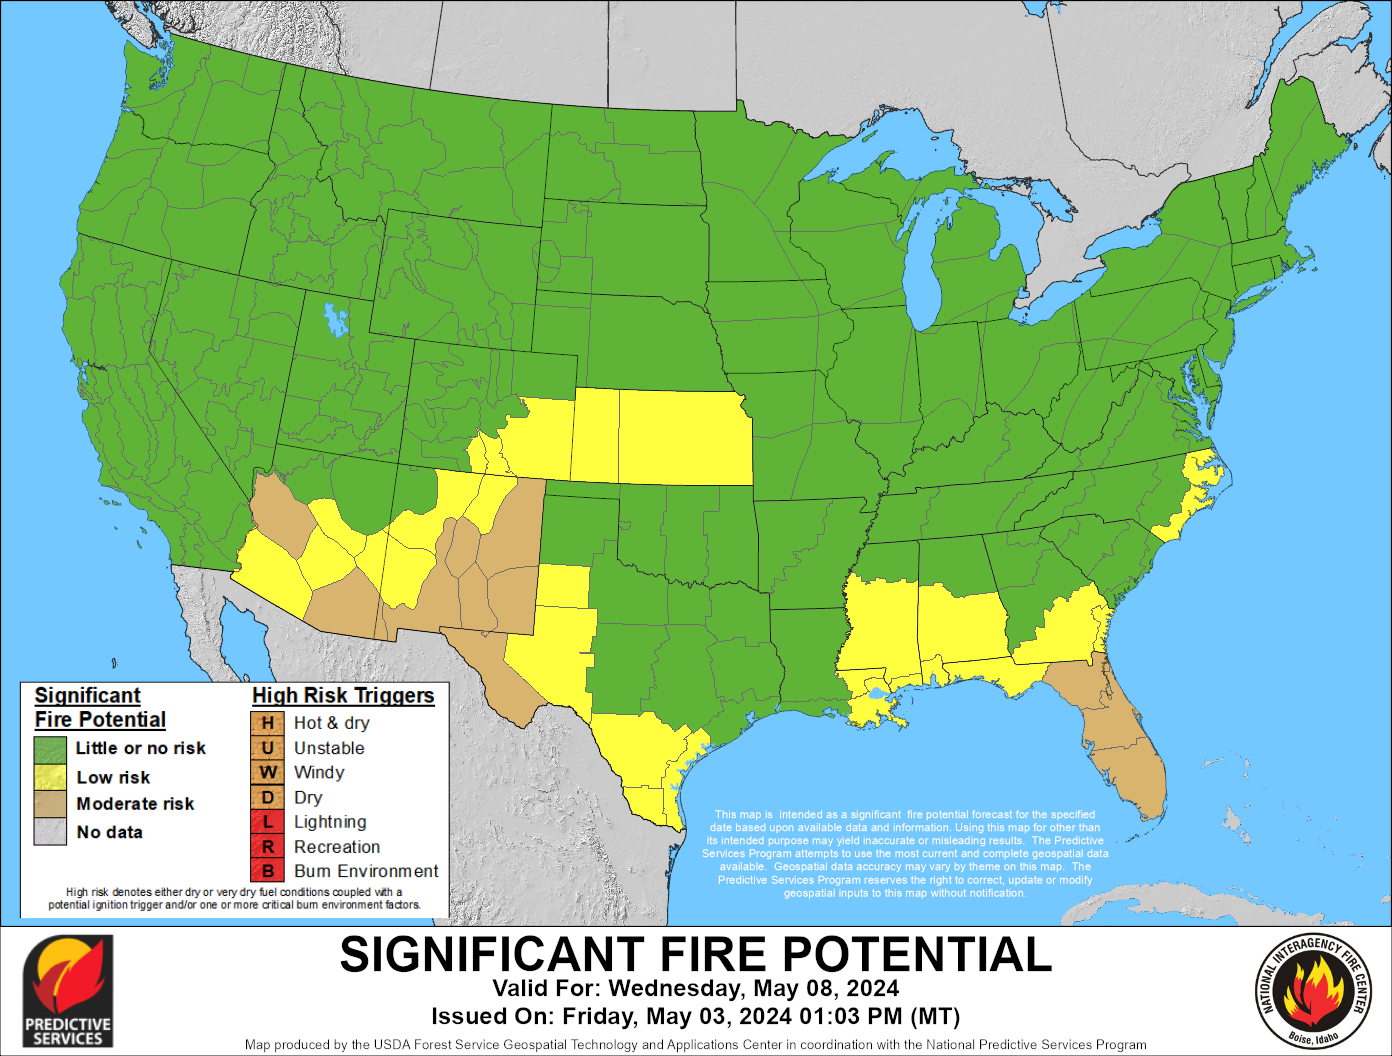
| Day 1: Significant Fire Potential | Day 2: Significant Fire Potential | Day 3: Significant Fire Potential | Day 4: Significant Fire Potential |
 |
 |
|
Fire Environment Mapping System |
| Day 5: Significant Fire Potential | Day 6: Significant Fire Potential | Day 7: Significant Fire Potential |
Climate Guidance (CPC)
|
|
|
|
| Next Week's Risk of Heavy Precipitation | 6-10 Day Precipitation Outlook | 8-14 Day Precipitation Outlook | 3-4 Week Precipitation Outlook |
 |
 |
|
|
| 1 Month Temperature Outlook | 1 Month Precipitation Outlook | 3 Month Temperature Outlook | 3 Month Precipitation Outlook |
Location Specific Forecasts for Mark Twain National Forecast
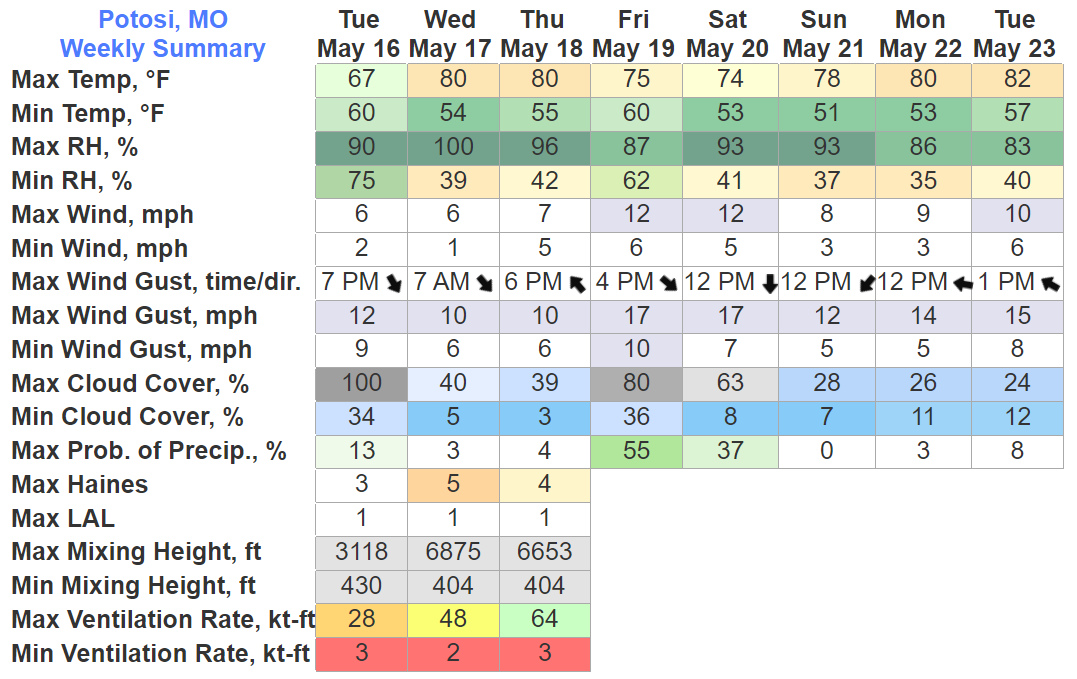 |
Zone 1: Potosi, MOZone 2: Doniphan, MOZone 3: Eagle Rock, MO |
Zone 3: Ava, MOZone 3: Ashland, MOZone 3: Ft. Leonard Wood, MO |
Drought Conditions
Drought Monitor
|
|
|
Evaporative Demand Drought Index (EDDI) |
| Drought Monitor: Missouri | Keetch-Byram Drought Index | KBDI Departures from Normal | The Evaporative Demand Drought Index is an experimental drouht monitoring and early warning duiance tool. It analyzes the atmospheric evaporative demand ("thirst of the atmosphere) over space and time and can be used to identify areas that will see increased moisture loss from evaporation (but does not take additional rainfall into account). |
 |
 |
 |
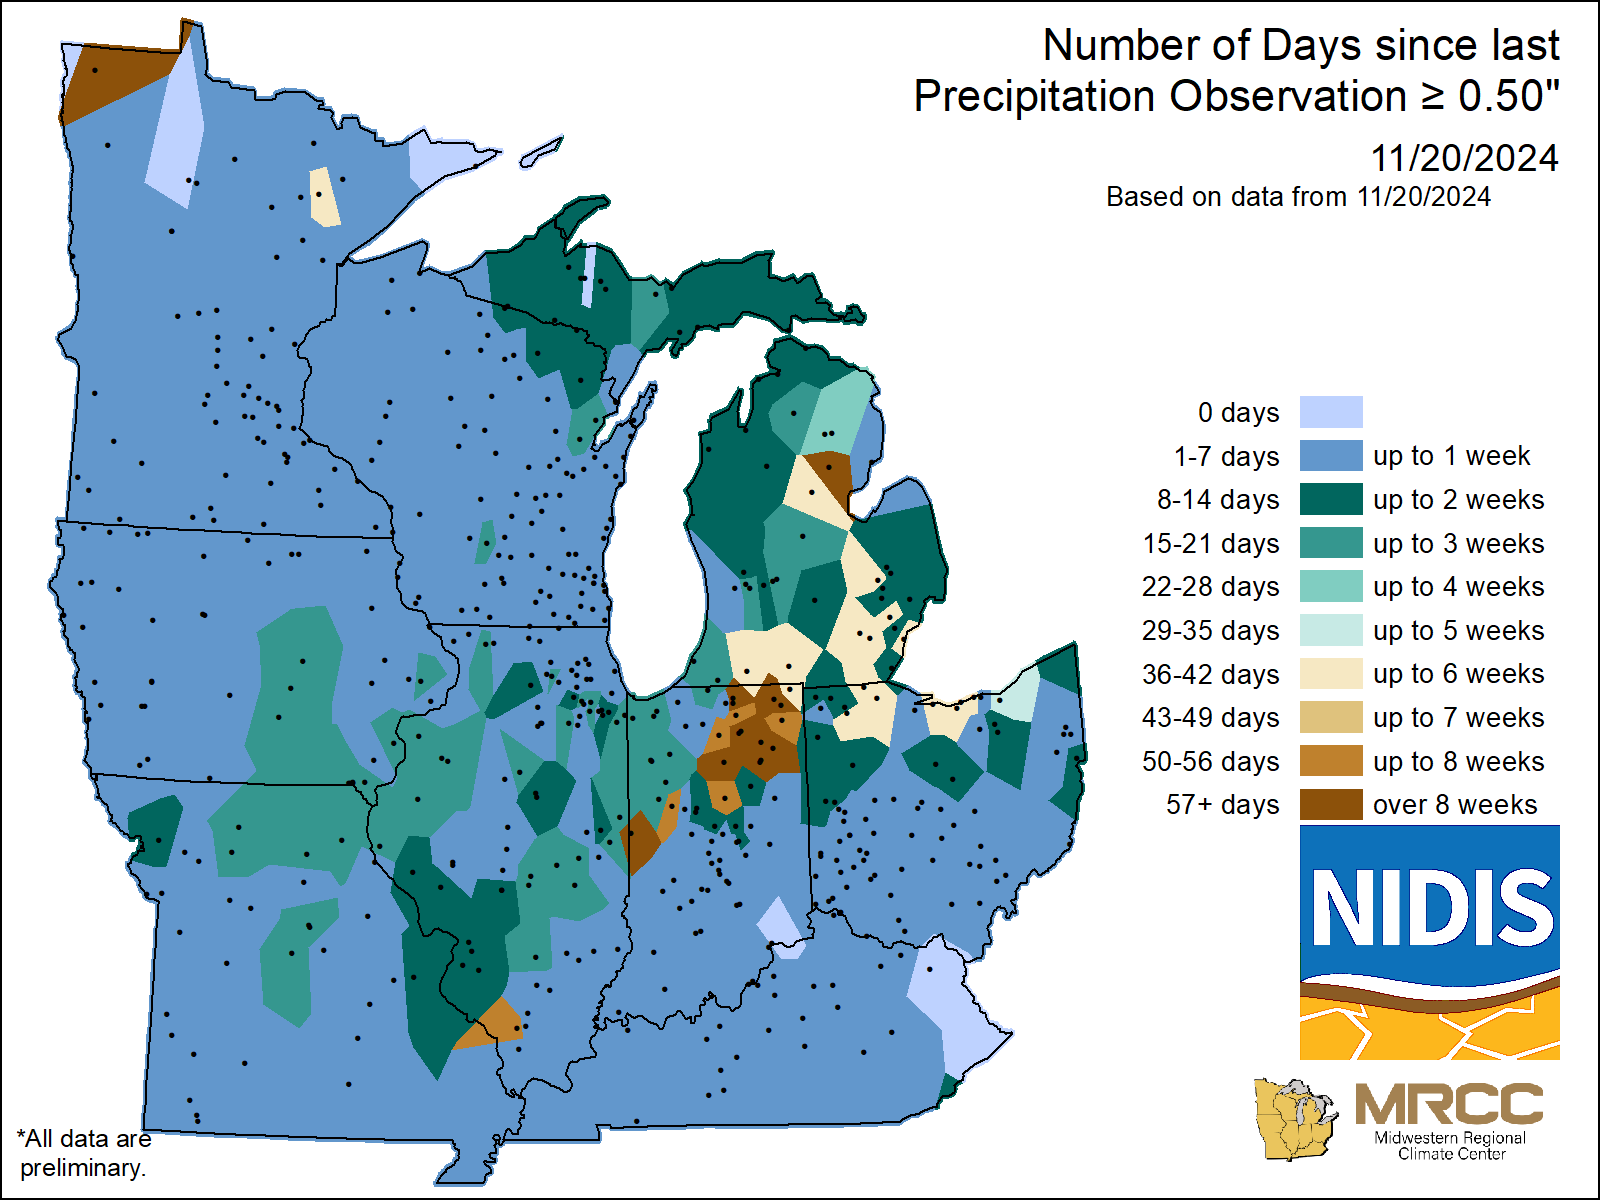 |
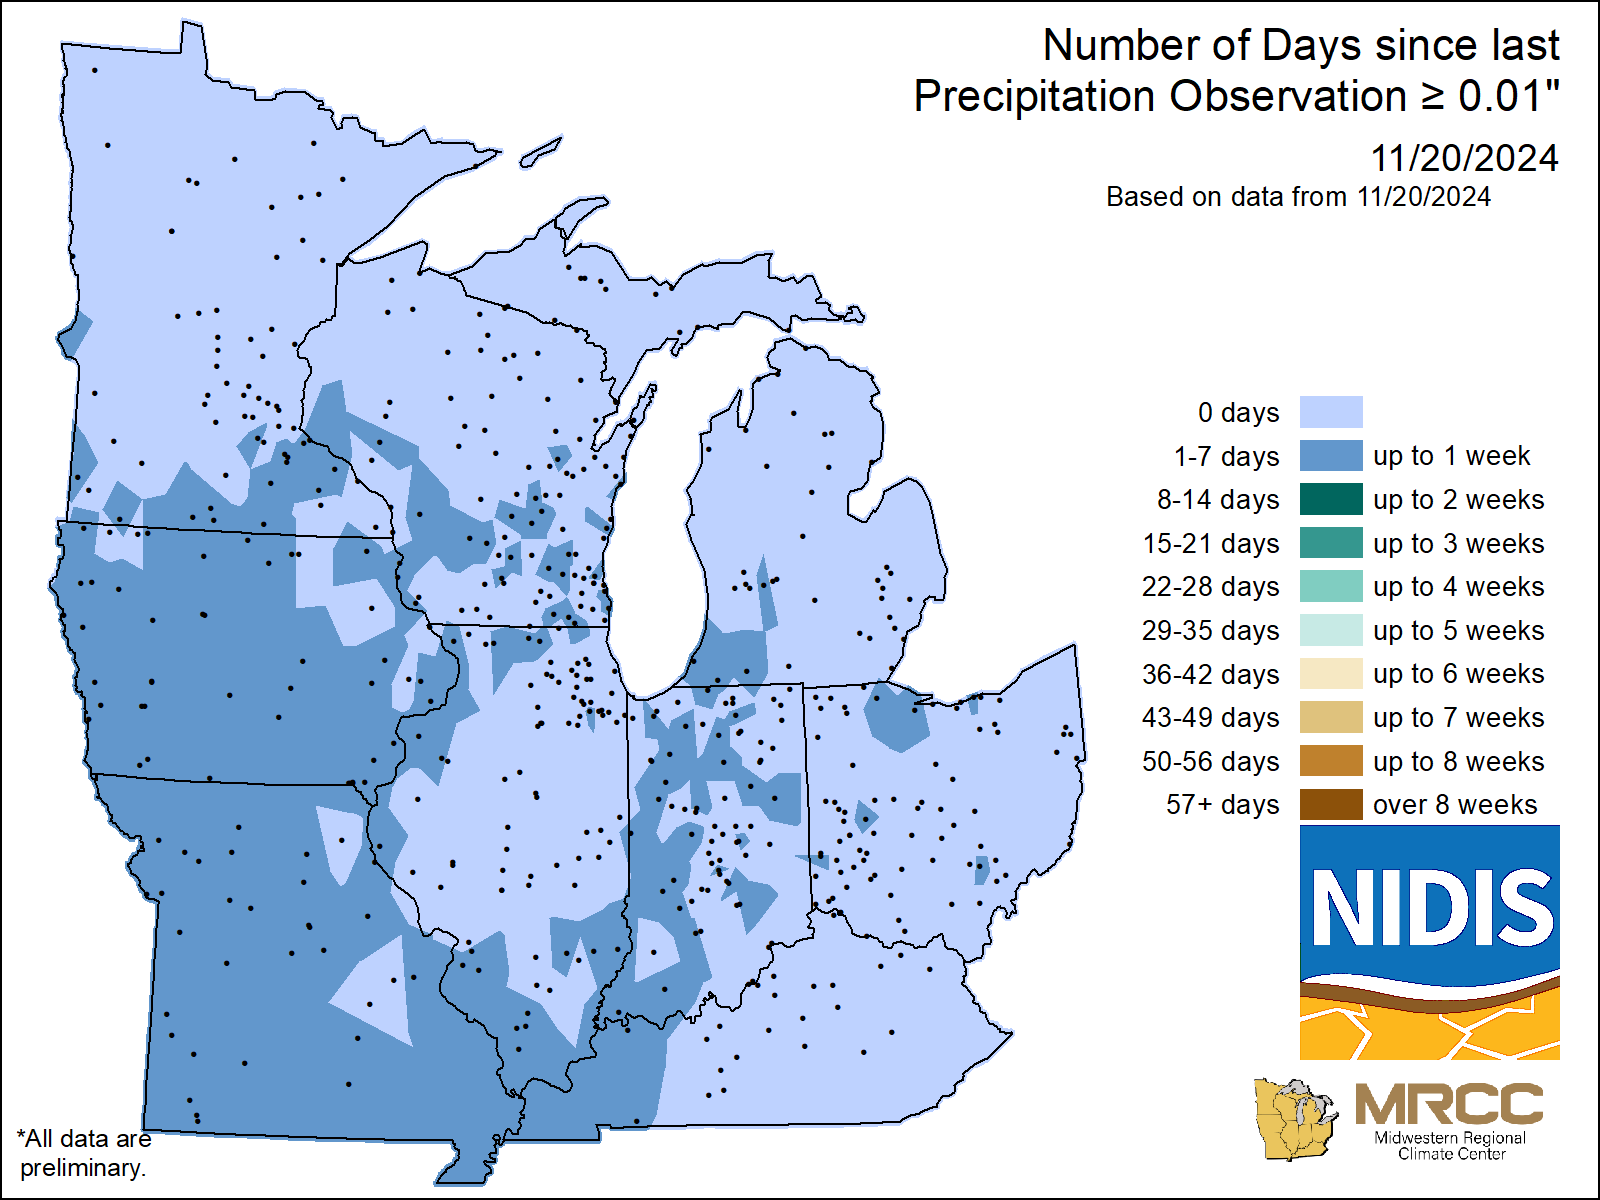
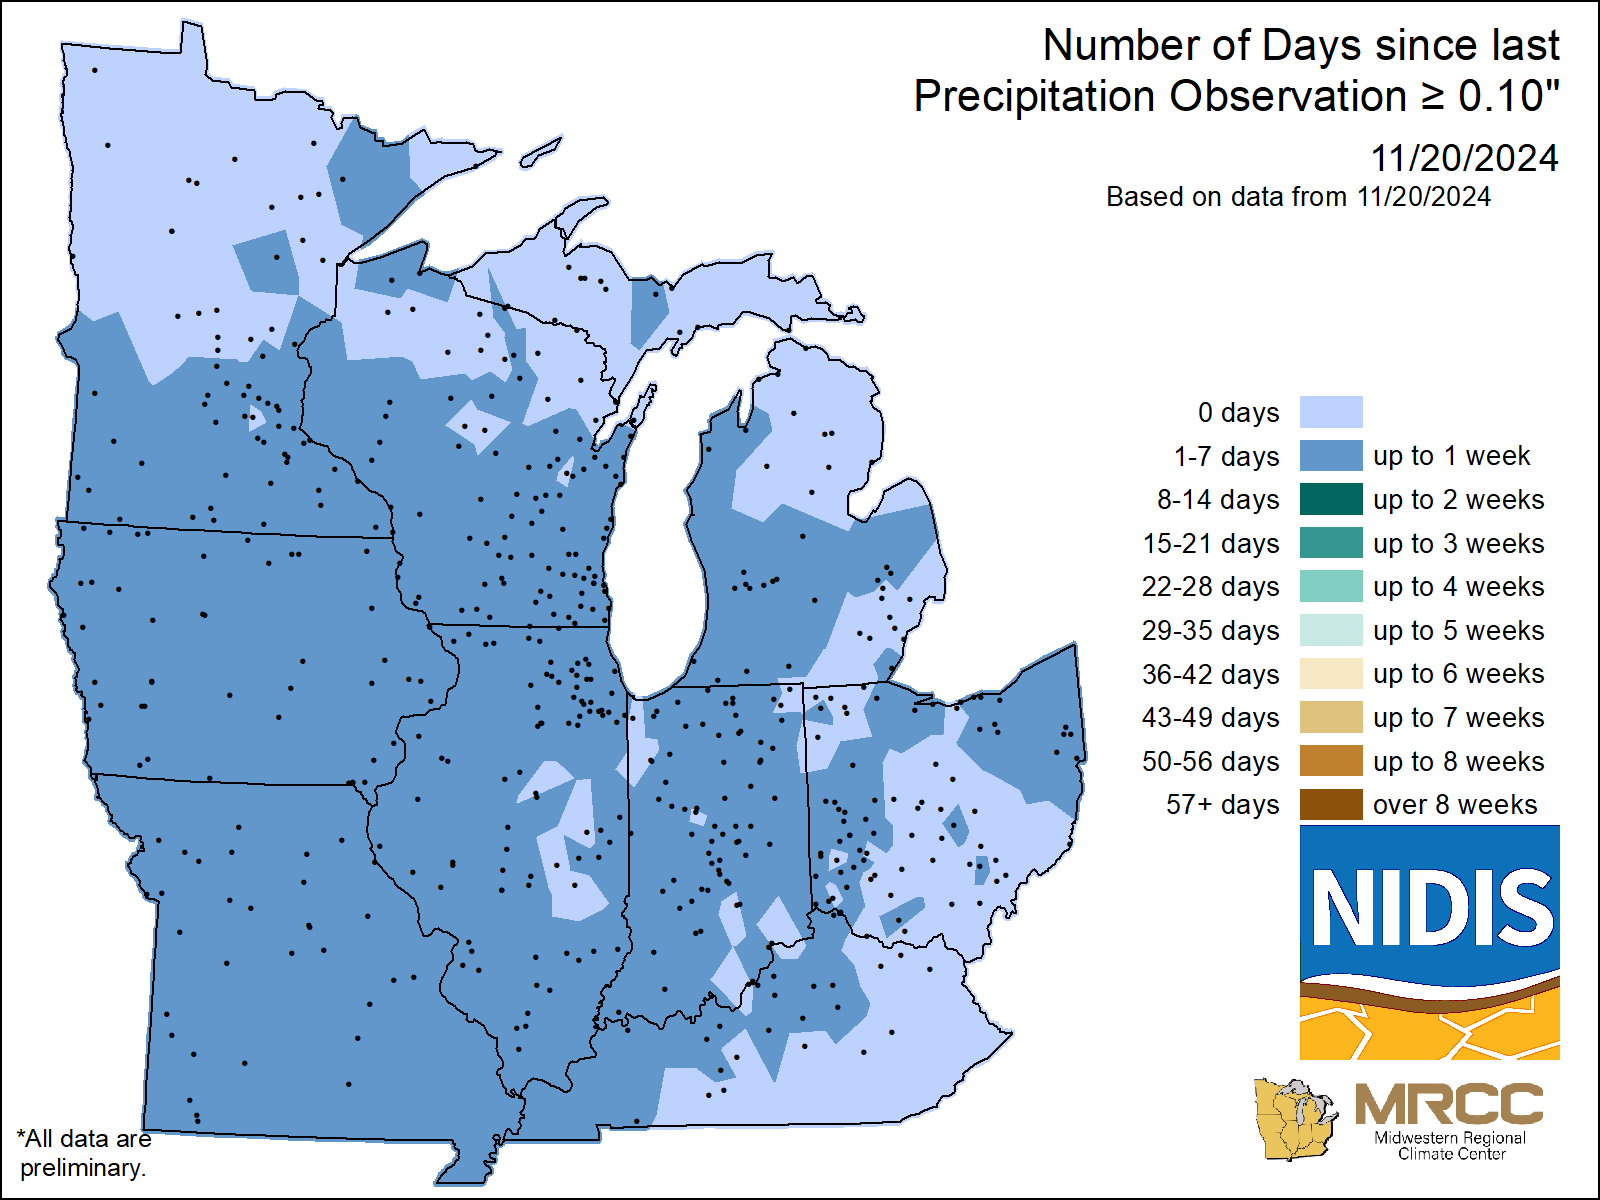
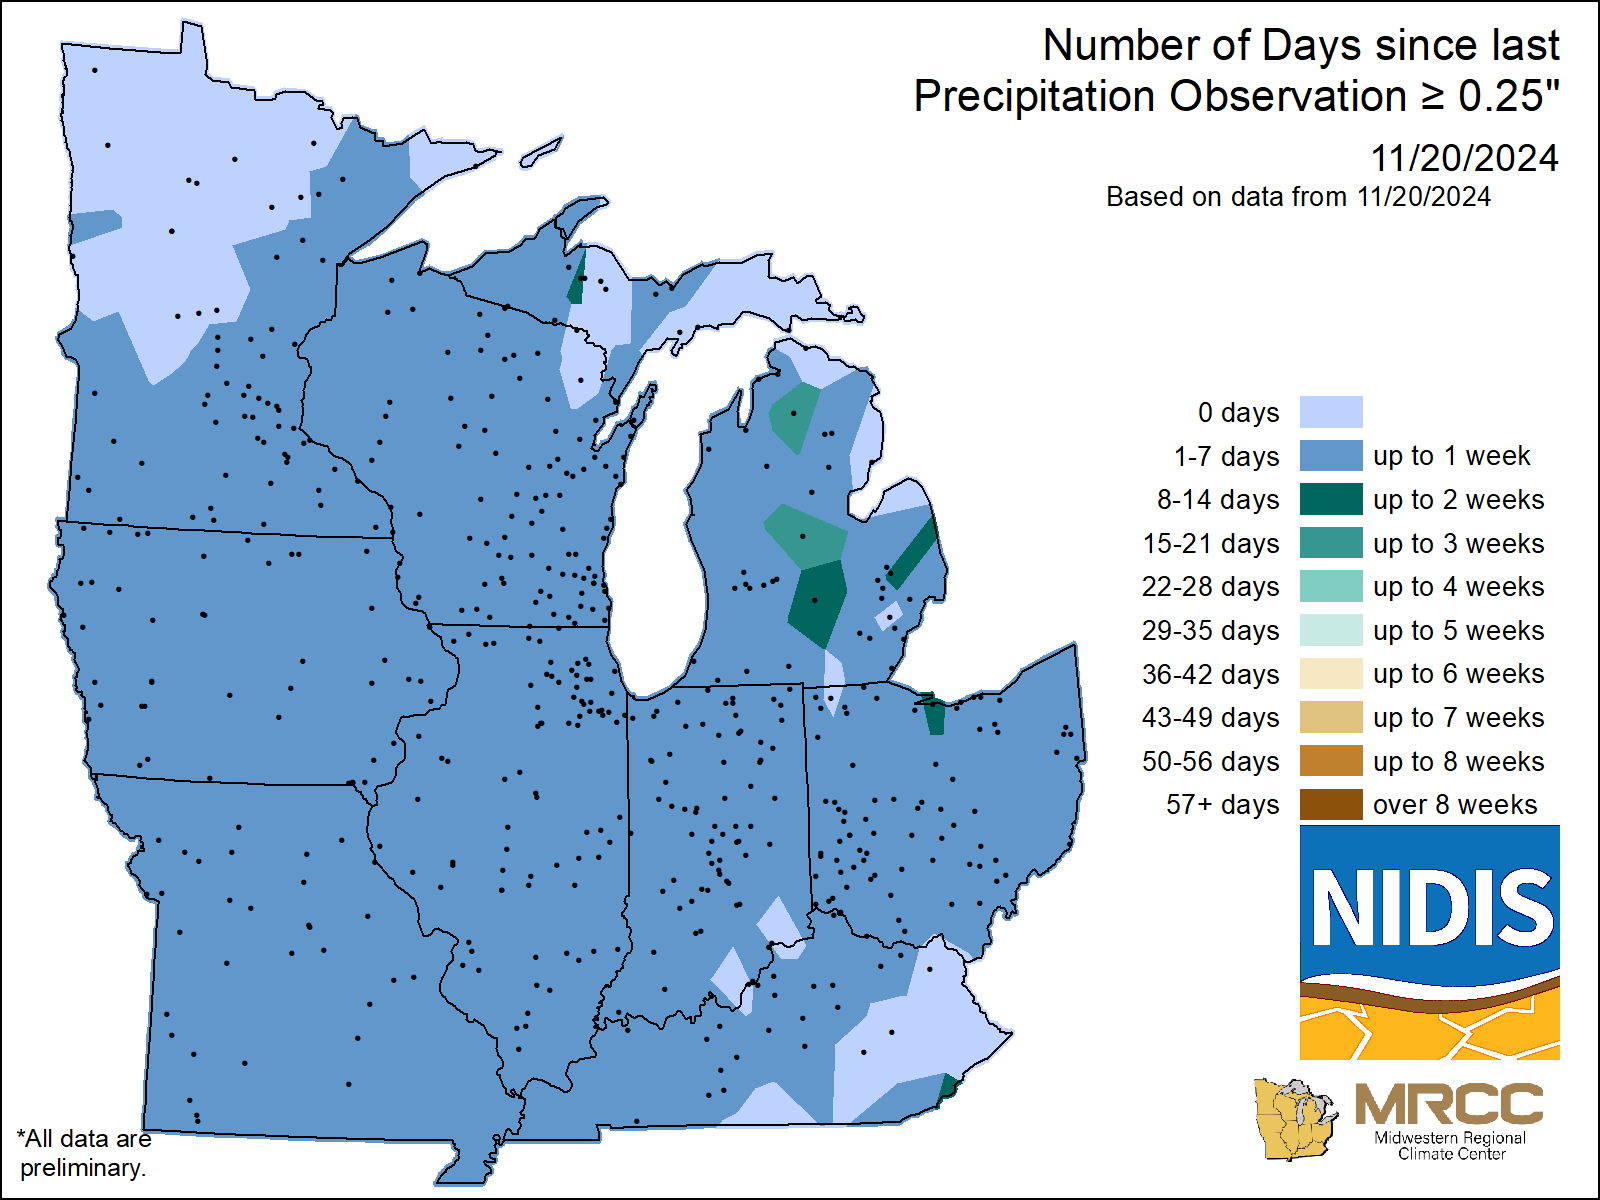
| Number of Days Since Last Observed Precipitation >0.01" | Number of Days Since Last Observed Precipitation >0.10" | Number of Days Since Last Observed Precipitation >0.25 | Number of Days Since Last Observed Precipitation >0.50 |
 |
|||
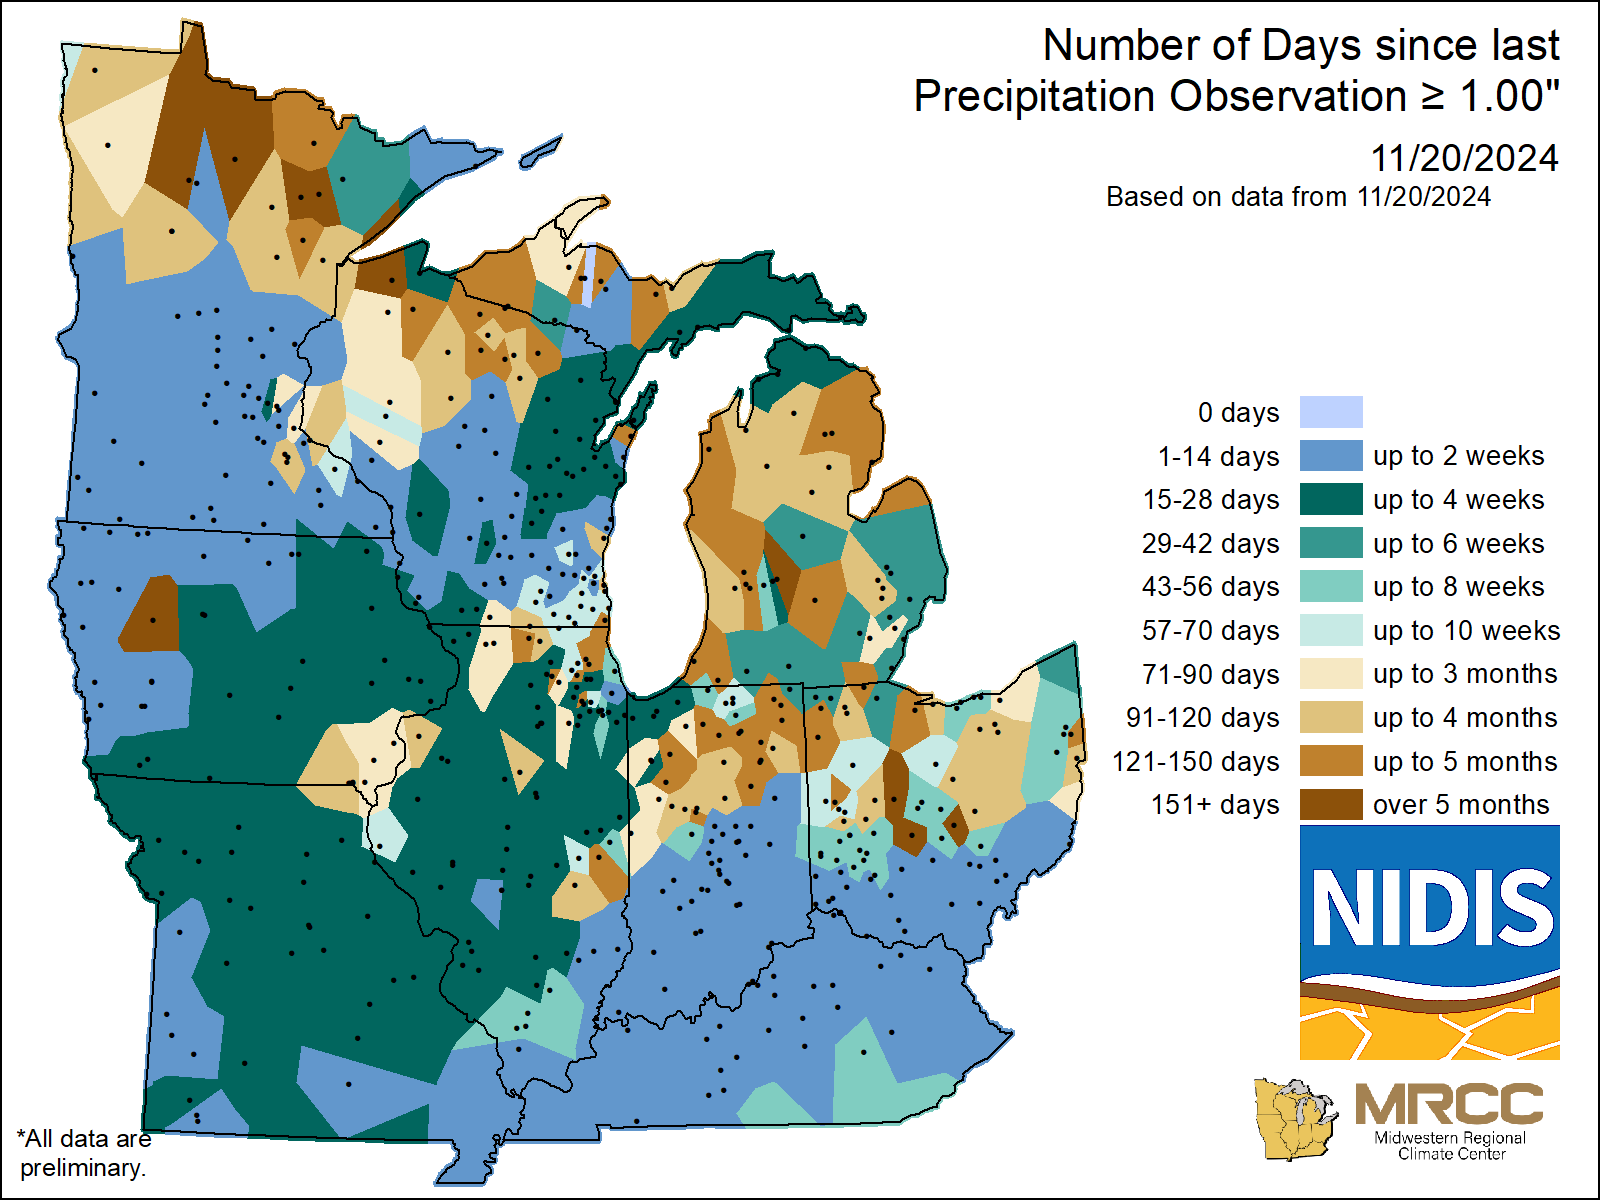
| Number of Days Since Last Observed Precipitation >1.0" |
Climate Guidance (CPC)
|
|
|
|
| Next Week's Risk of Heavy Precipitation | 6-10 Day Precipitation Outlook | 8-14 Day Precipitation Outlook | 3-4 Week Precipitation Outlook |
|
|
|
|
| 1 Month Temperature Outlook | 1 Month Precipitation Outlook | 3 Month Temperature Outlook | 3 Month Precipitation Outlook |
Cold Weather
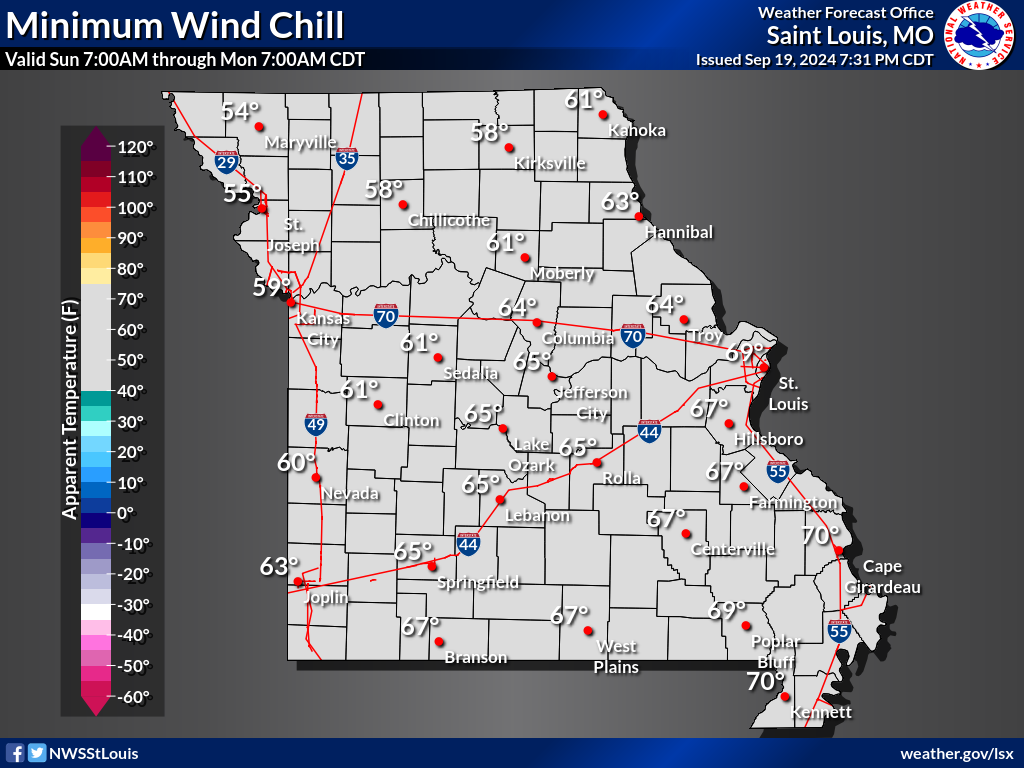
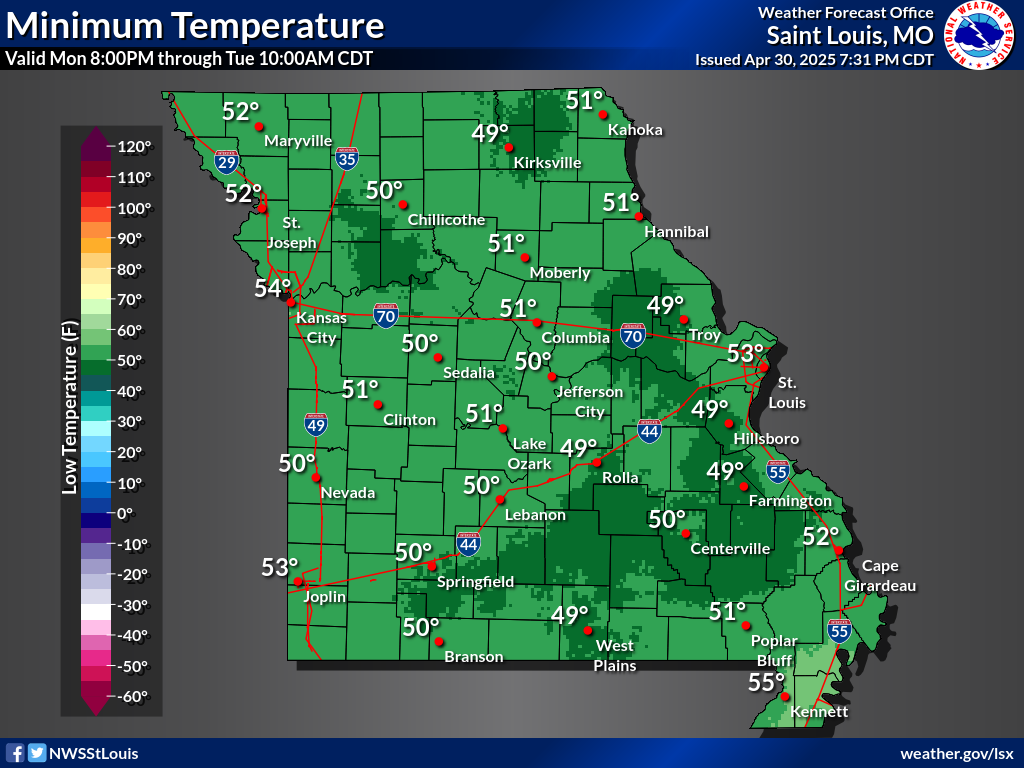
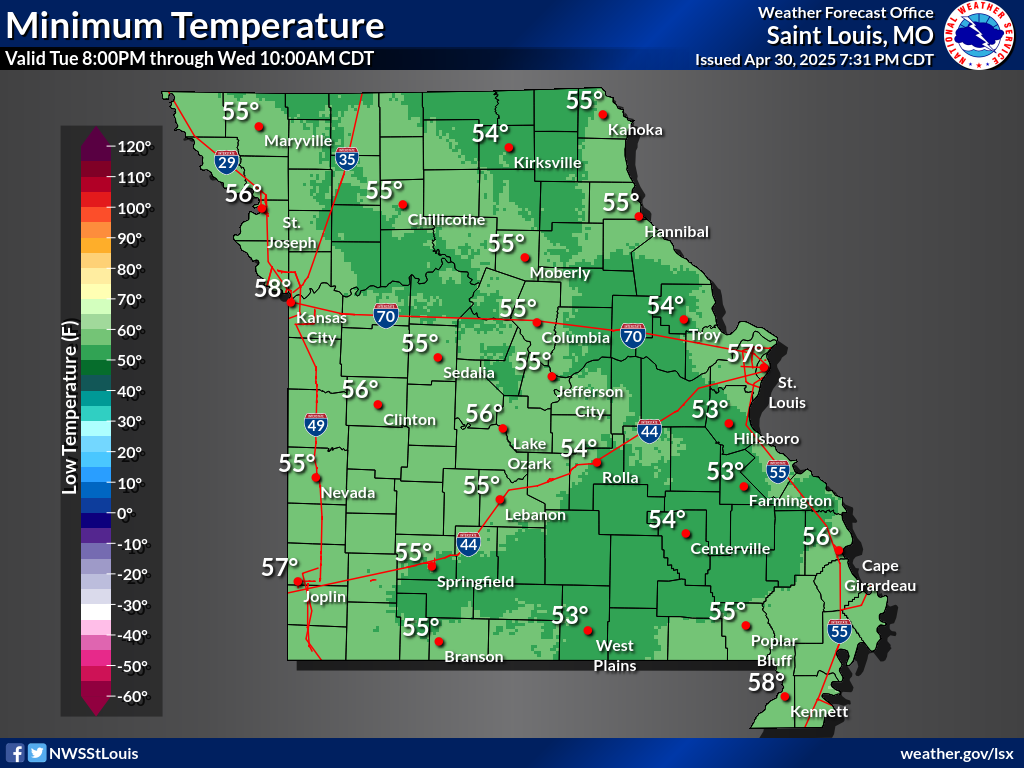
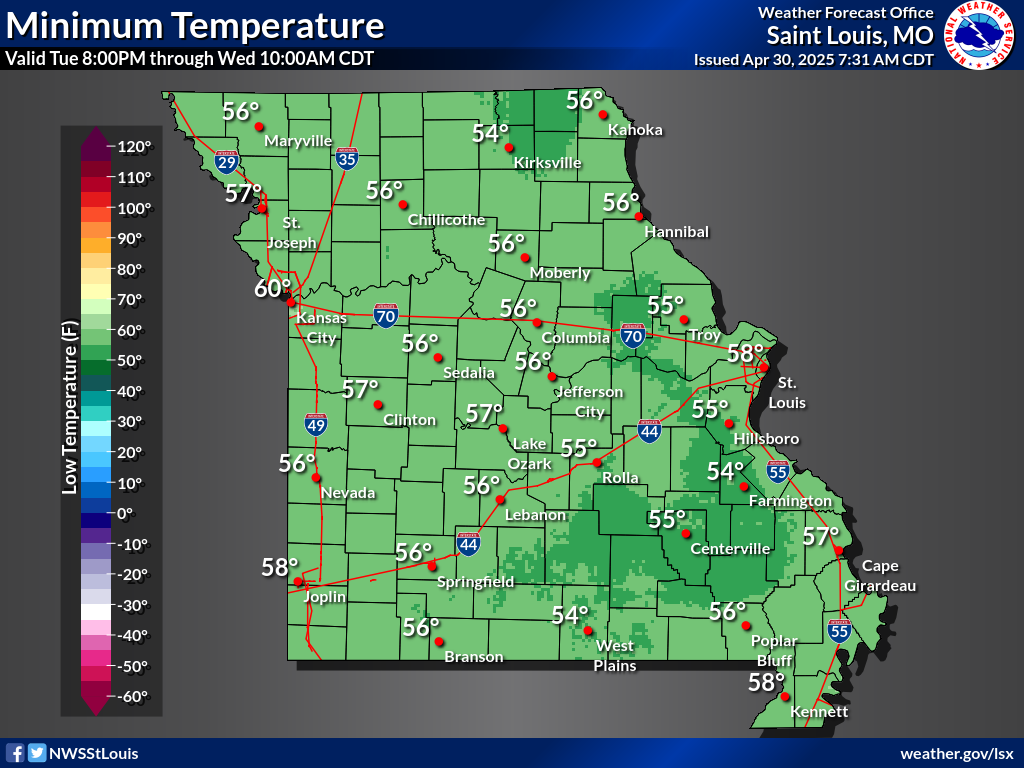
Day 1-7 Minimum Temperature and Wind Chill Forecast
|
|
|
|
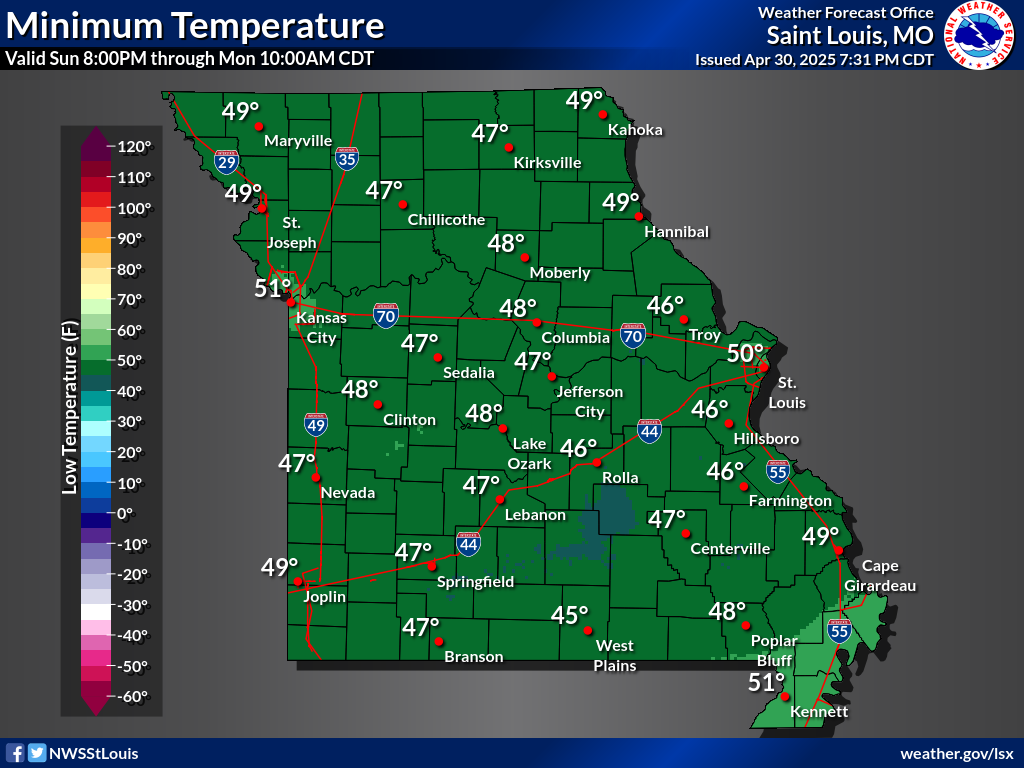
| Day 1 Minimum Temperature | Day 1 Wind Chill | Day 2 Minimum Temperature | Day 2 Wind Chill |
|
|
 |
 |
| Day 3 Minimum Temperature | Day 3 Wind Chill | Day 4 Minimum Temperature | Day 4 Wind Chill |
 |
 |
 |
 |
| Day 5 Minimum Temperature | Day 5 Wind Chill | Day 6 Minimum Temperature | Day 6 Wind Chill |
 |
 |
||
| Day 7 Minimum Temperature | Day 7 Wind Chill |
Temperature Outlooks
|
|
|
|
| Next Week's Risk of Hazardous Temperatures | 6-10 Day Temperature Outlook | 8-14 Day Temperature Outlook | 3-4 Week Temperature Outlook |
|
|
||
| One Month Temperature Outlook | Three Month Temperature Outlook |
Temperature Resources
Hours Below Freezing |
Winter Weather
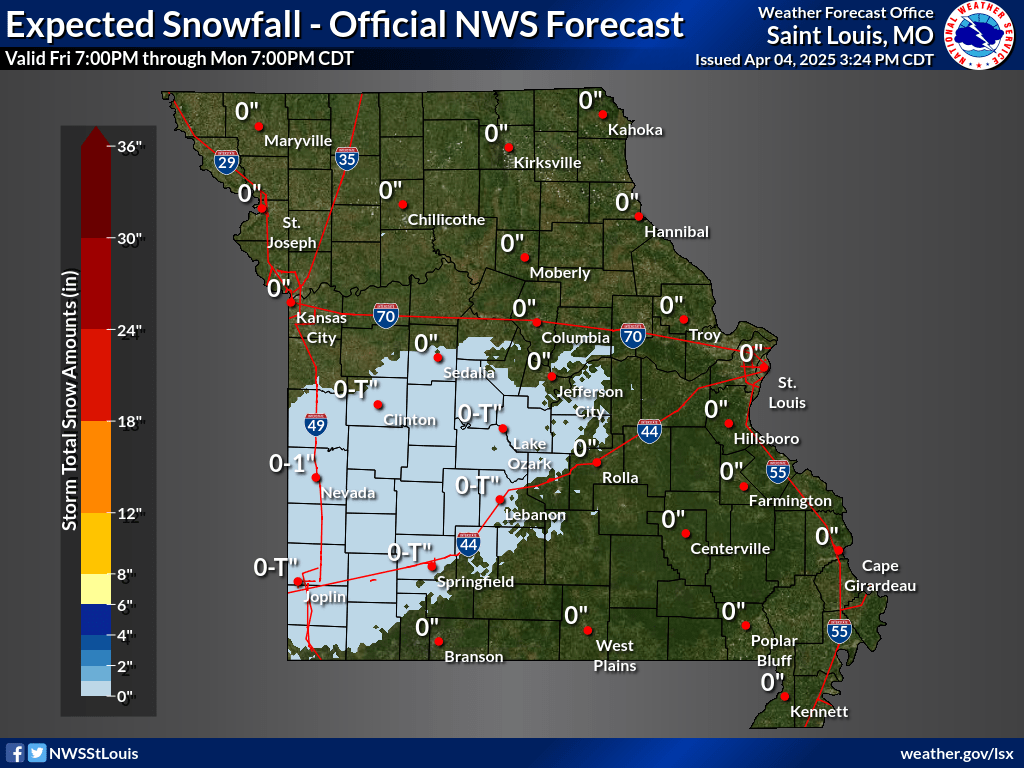
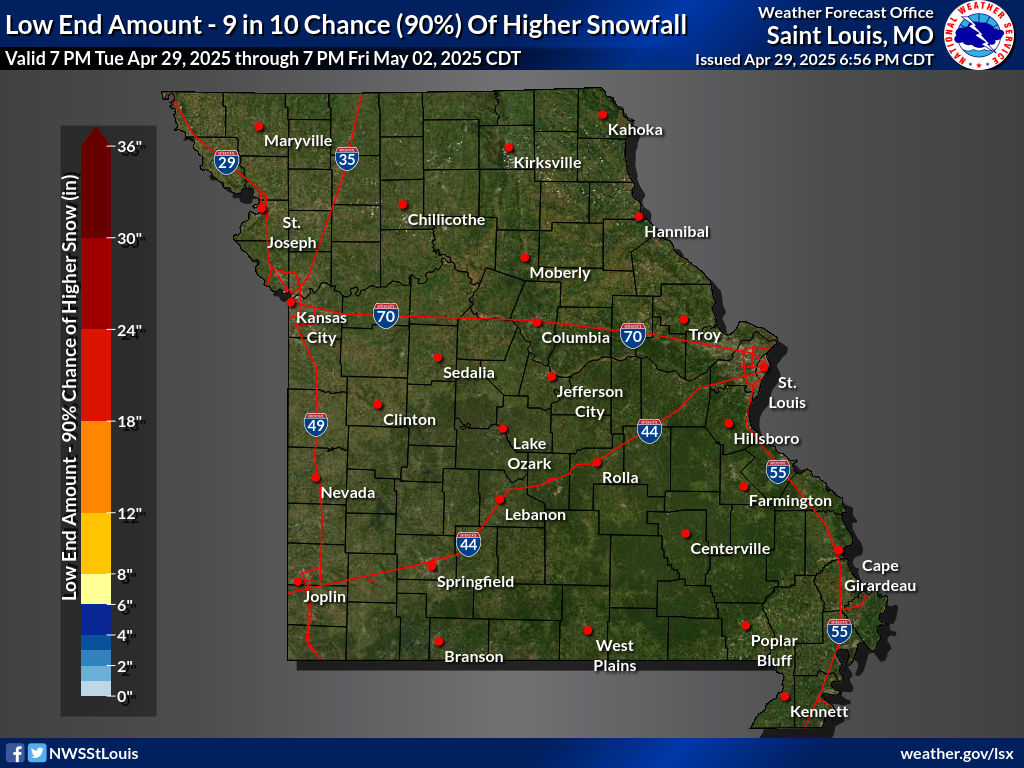
Missouri Probabilistic Snowfall and Ice Forecast
 |
|
 |
 |
| Day 1-3 Storm Total Snow Forecast | Day 1-3 Storm Total Ice Forecast | Day 1-3 Probability of 1 in 10 Chance (10%) of Higher Snowfall | Day 1-3 Probability of 9 in 10 Chance of (90%) of Higher Snowfall |
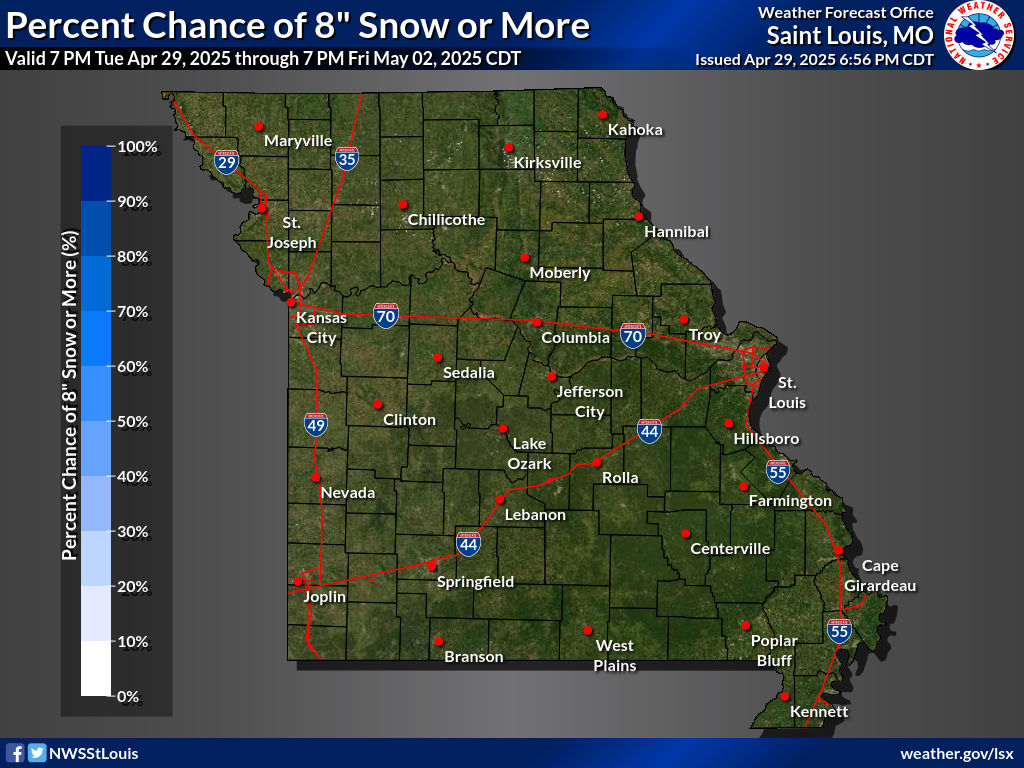
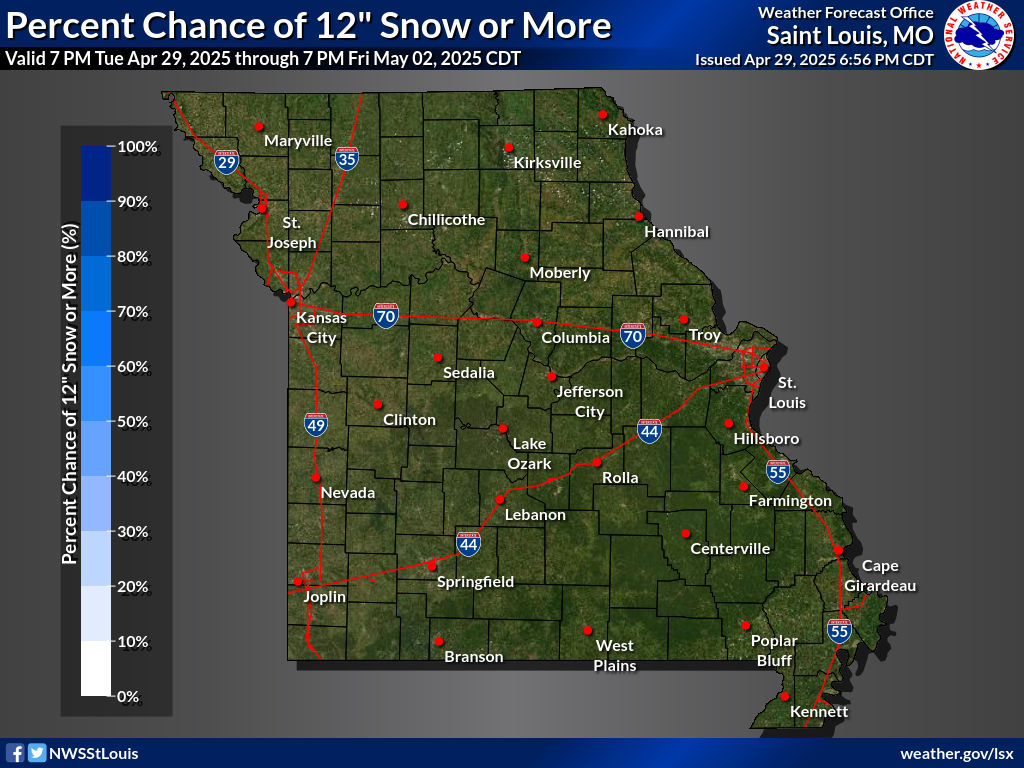
Probability of Exceedance Snowfall Forecast
 |
 |
 |
 |
| Day 1-3 Percent Chance of 0.1+" Snow | Day 1-3 Percent Chance of 1+" Snow | Day 1-3 Percent Chance of 2+" Snow | Day 1-3 Percent Chance of 4+" Snow |
 |
 |
 |
 |
| Day 1-3 Percent Chance of 6+" Snow | Day 1-3 Percent Chance of 8+" Snow | Day 1-3 Percent Chance of 12+" Snow | Day 1-3 Percent Chance of 18+" Snow |
National Probability of Snowfall Forecast
 |
 |
 |
|
| Probability of at Least 4 Inches of Snow: Day 1 | Probability of at Least 4 Inches of Snow: Day 2 | Probability of at Least 4 Inches of Snow: Day 3 | |
 |
 |
 |
 |
| Probability of Exceeding 0.25 Inches of Snow: Day 4 | Probability of Exceeding 0.25 Inches of Snow: Day 5 | Probability of Exceeding 0.25 Inches of Snow: Day 6 | Probability of Exceeding 0.25 Inches of Snow: Day 7/td> |
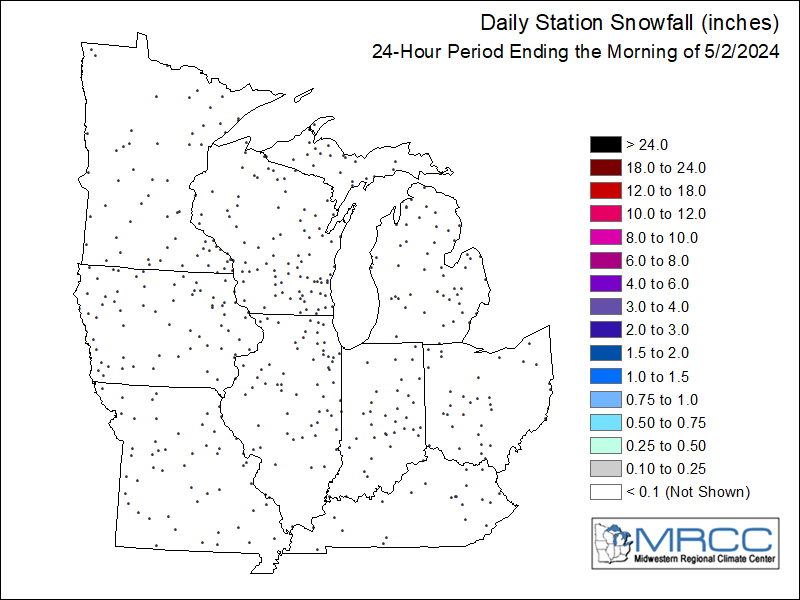
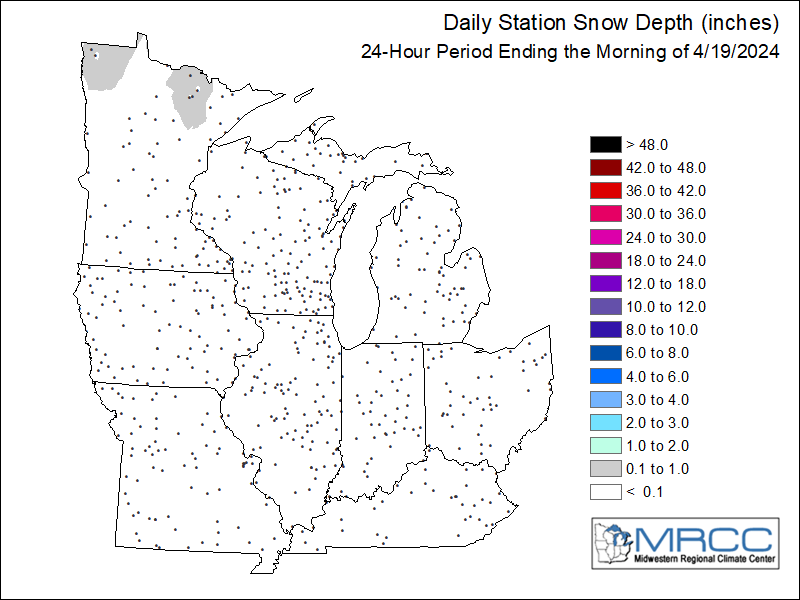
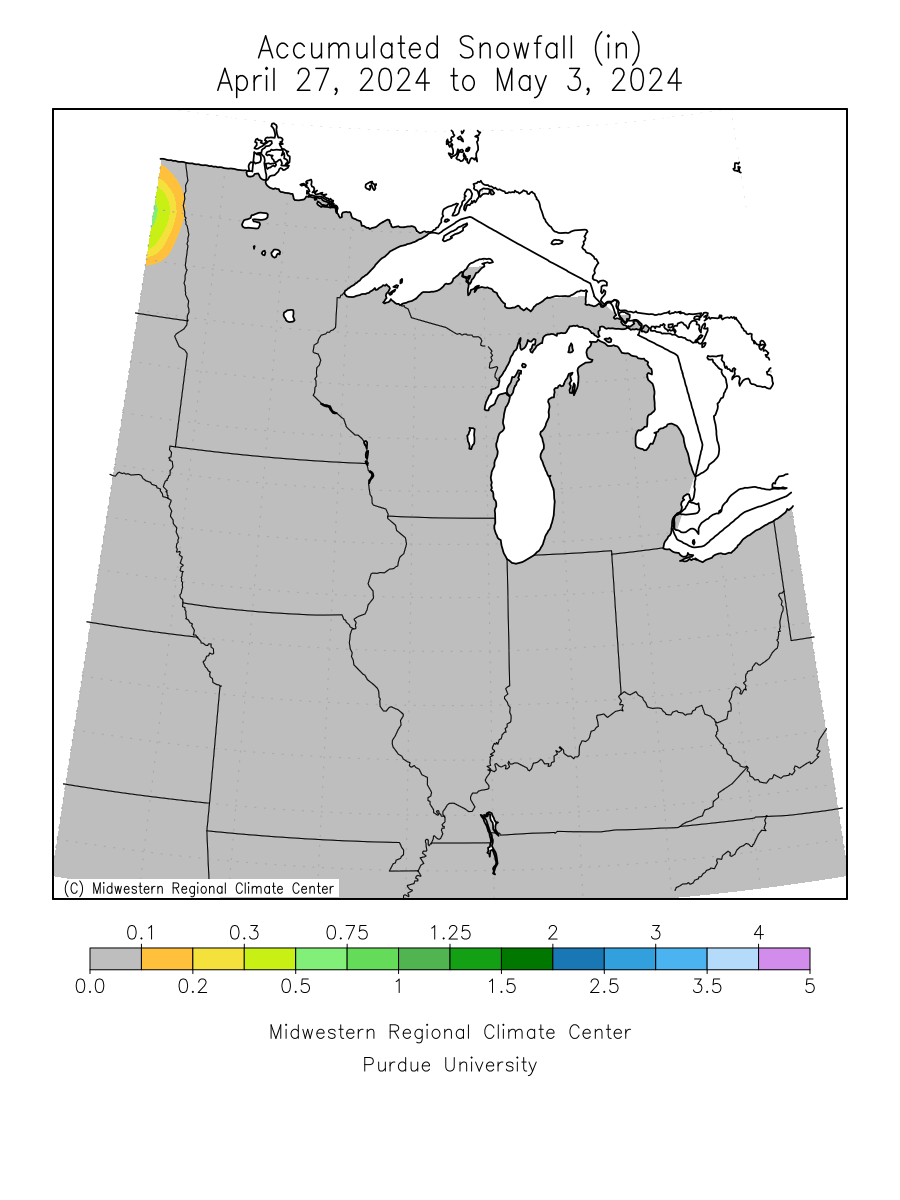
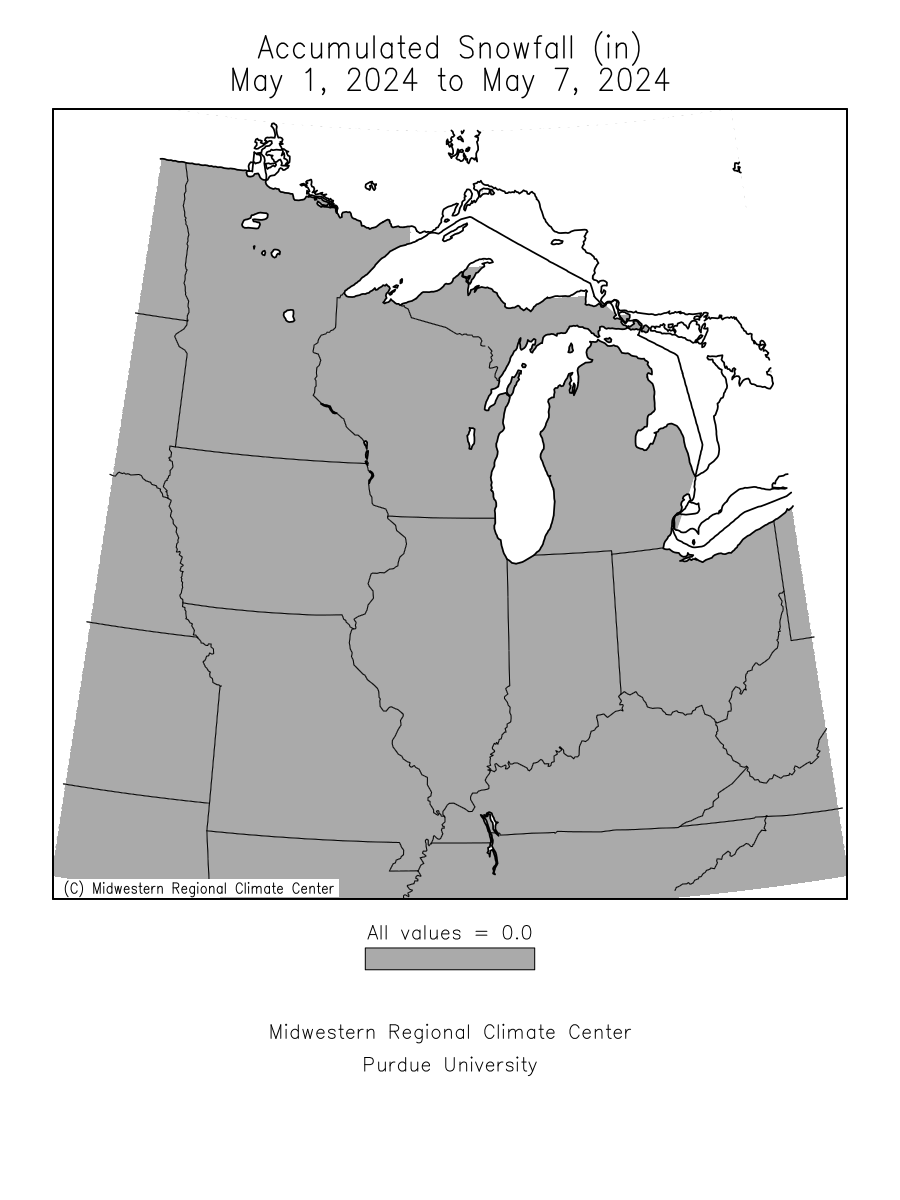
Observed Snowfall
 |
 |
 |
 |
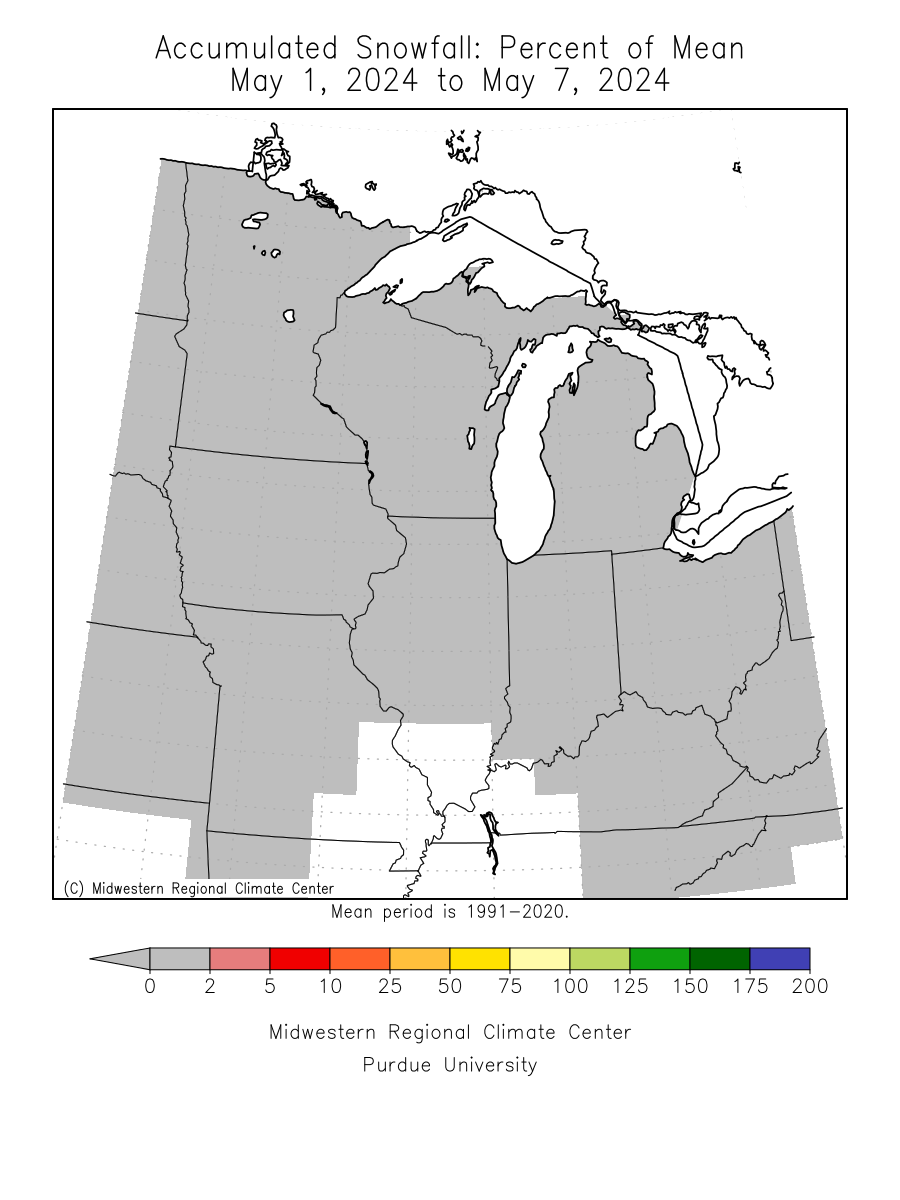
| 24 Hour Observed Snowfall | 24 Hour Observed Snow Depth | 7 Day Total Snowfall | 7 Day Total Snowfall Percent of Mean |
 |
 |
 |
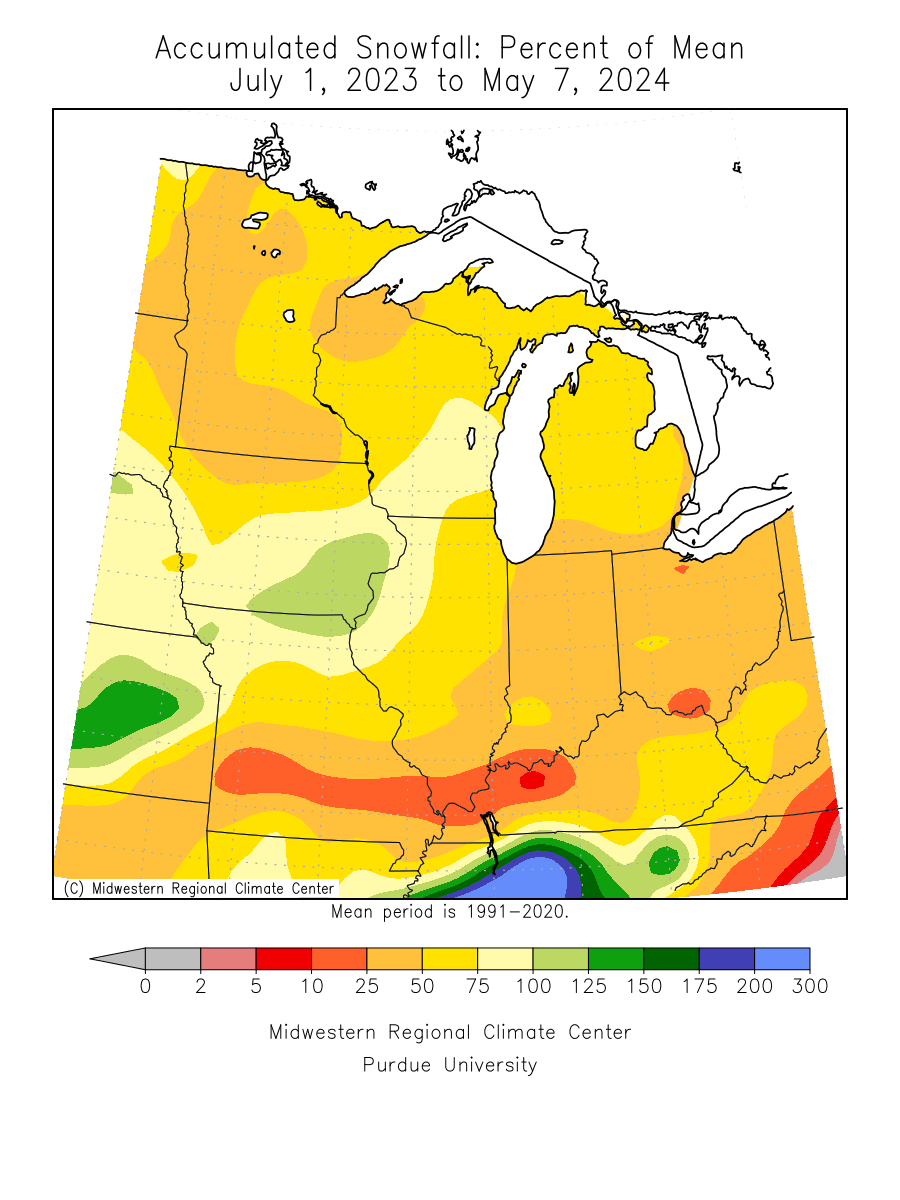 |
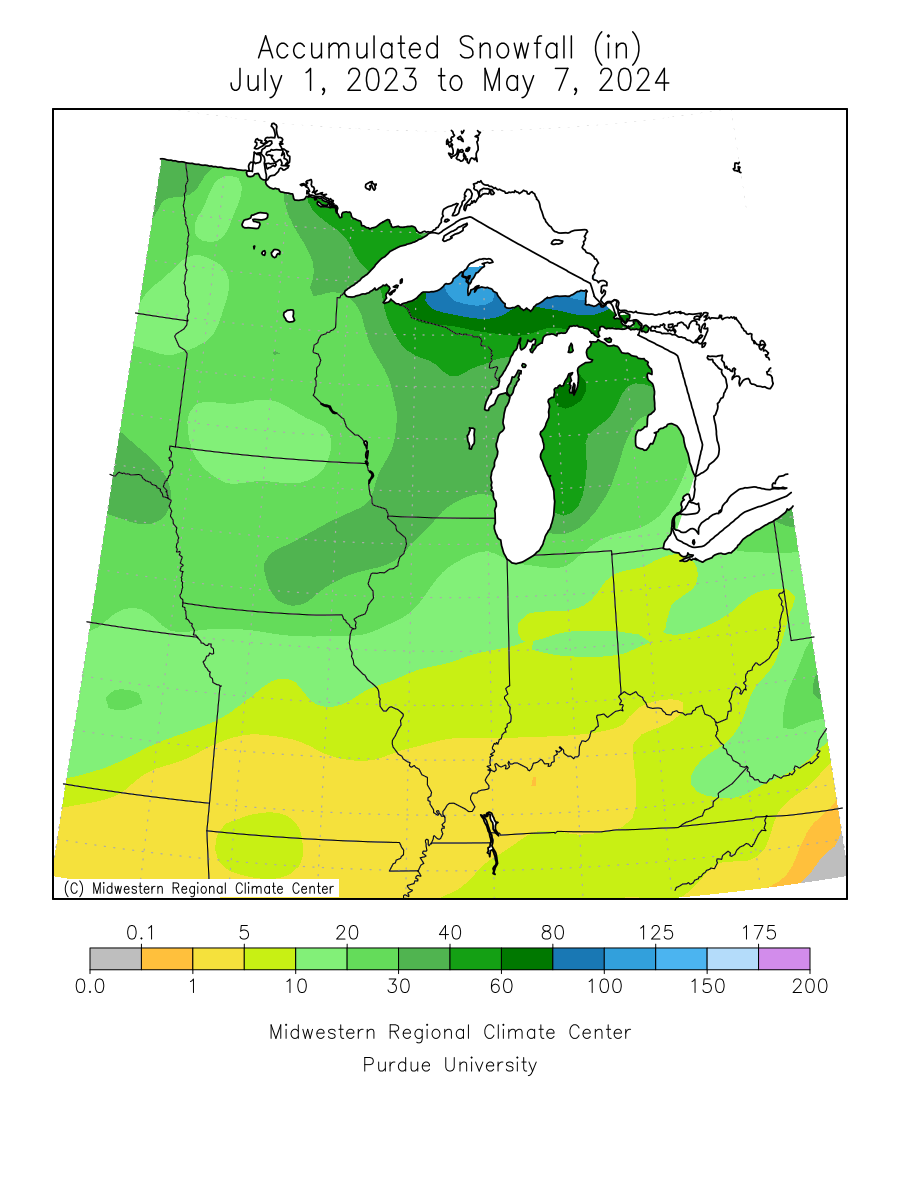
| Month to Date Accumulated Snowfall | Month to Date Accumulated Snowfall Percent of 1991-2020 Normals | Season to Date Accumulated Snowfall | Season to Date Accumulated Snowfall Percent of 1991-2020 Normals |
 |
 |
||
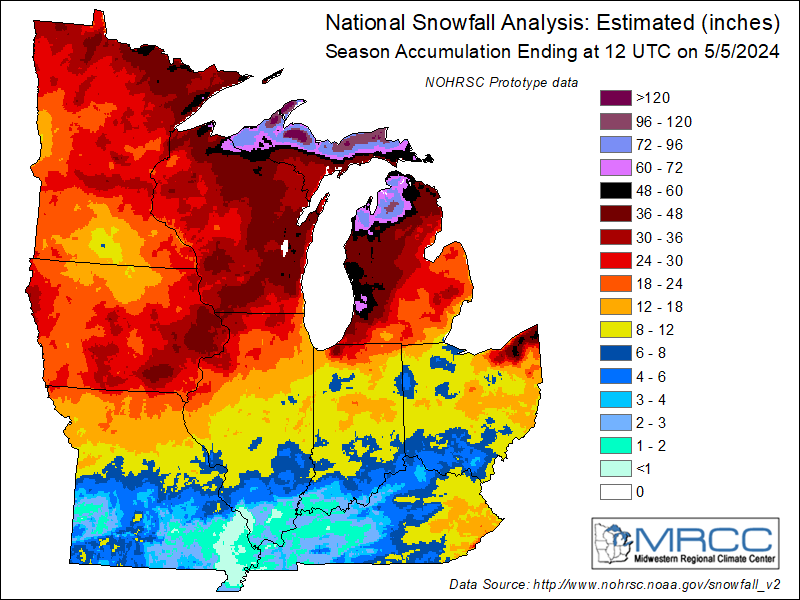
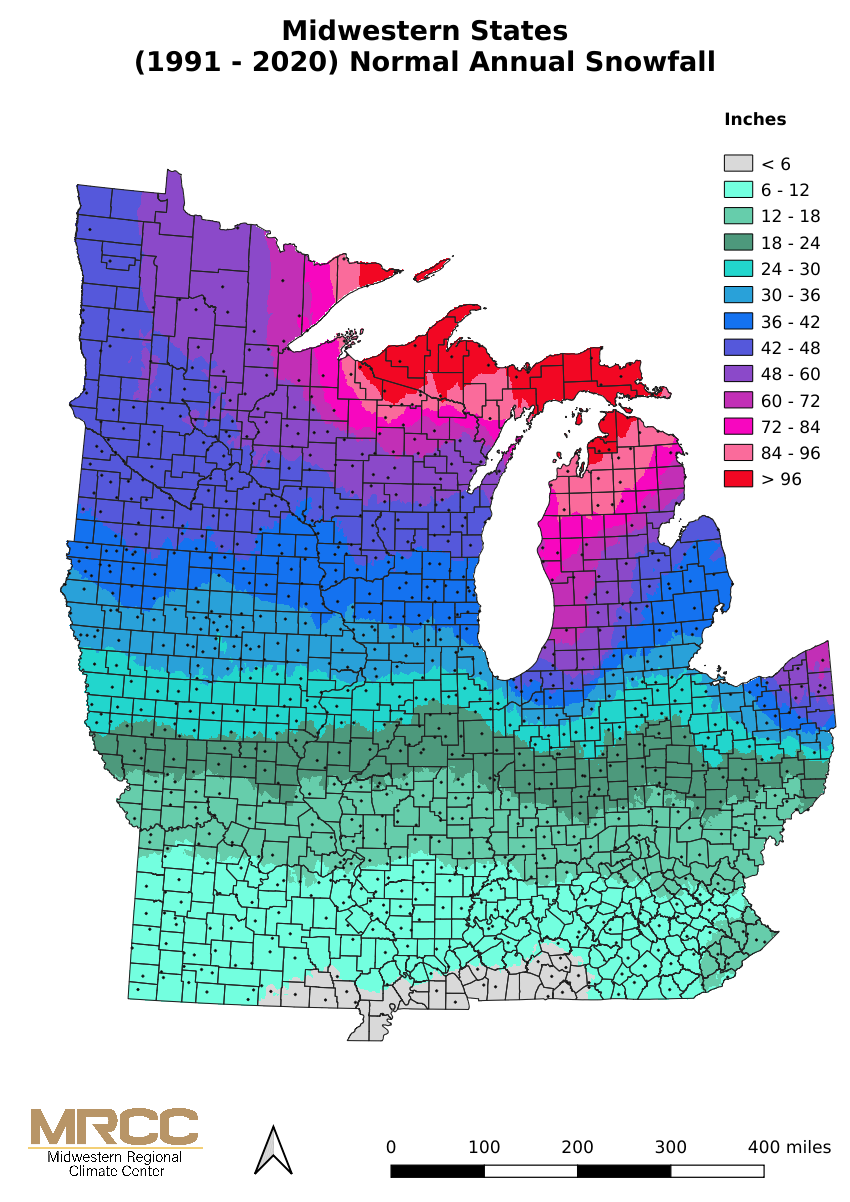
| Midwest Seasonal Snowfall Analysis (Estimated) | Midwest Normal Annual Snowfall (1991-2020) |
 Weather Story
 Weather Map
 Local Radar