
Tropical Depression Two is expected to gradually strengthen and could bring tropical storm conditions to the Florida Panhandle beginning late Monday. Areas of flash flooding will be possible through Thursday along the eastern and central Gulf Coast. Severe thunderstorms will develop and move along a cold front crossing the Upper Midwest Monday, and through the Ohio Valley/Mid-Atlantic on Tuesday. Read More >
UPDATED! Experimental Winter Storm Threat Graphics
Looking at our region's winter storm threat 3-to-7 days in the future
This page contains an explanation with examples
Click here to see the LIVE graphics.
For more details see the Product Description Document.
Would you like to know about possible winter storms several days ahead of time?
What: Starting December 5th 2016, we updated our set of experimental Winter Storm Threat graphics to highlight the winter storm threat 3-to-7 days in the future. We already provide detailed winter watches & warnings for storms that have become credible threats within the first 2 days. Until last year, with our introduction of the Days 4-to-7 Winter Storm Threat, much less had been said with potentially impactful winter storm threats beyond 2 days of the forecast. These graphics provide that information.
Where: These graphics are contained within our winter weather webpage, between the near-term information & long-range forecasts.
When: Updated twice daily and available 24/7 until mid-April.
How does this help me?
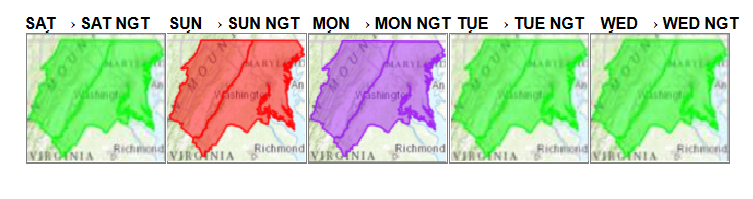
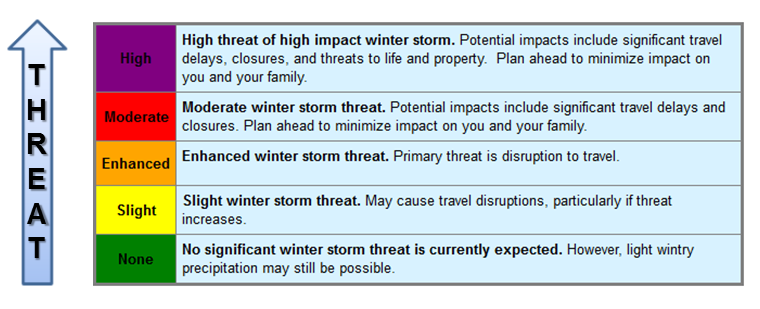
1) This gives a quick glance to see if there are any extended winter storm threats, using a simple, commonly-used color system. (green, yellow, orange, red, purple).
The graphics below are an example. Click here to see the current experimental graphics.
2) This allows you to click on a "day of interest" (for example Saturday on the graphic above) and see our level of confidence in having a storm, coupled with the level of potential impact from a storm. Taken together, the level of confidence & level of potential impact produce the colored level of threat for your area that is checked off as shown below.
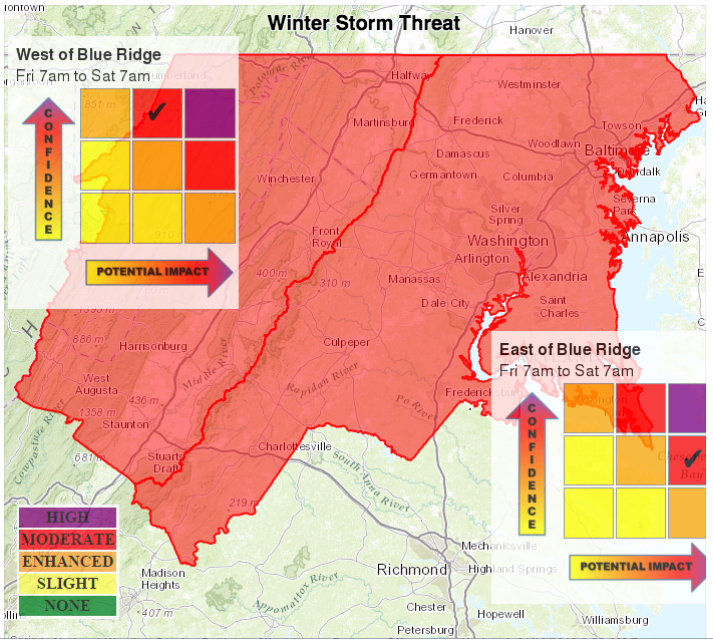
How does this work?
The system we have developed looks at the dozens of computer model simulations of the atmosphere that are available internationally (over 70!). When a few of them begin to show a chance of a winter storm, the threat level shown on these graphics ticks up. Over time, as more and more models agree that the region will be hit with a storm [confidence], and/or the strength of the possible storm rises [potential impact], the threat level shown will also rise.
Please let us know what you think!
To send a comment (good or bad), or potential improvements, please let us know. We will work together to ensure the area is getting the weather information it needs, in a way that is easy to understand and use.
Note: Since this is a prototype under development, you should not rely upon it for operational decision making.
National Weather Service - Baltimore/Washington Forecast Office


 Coastal Flood
 FAQ
FAQ