|
La Niña Winters in the Washington D.C.-Baltimore Area
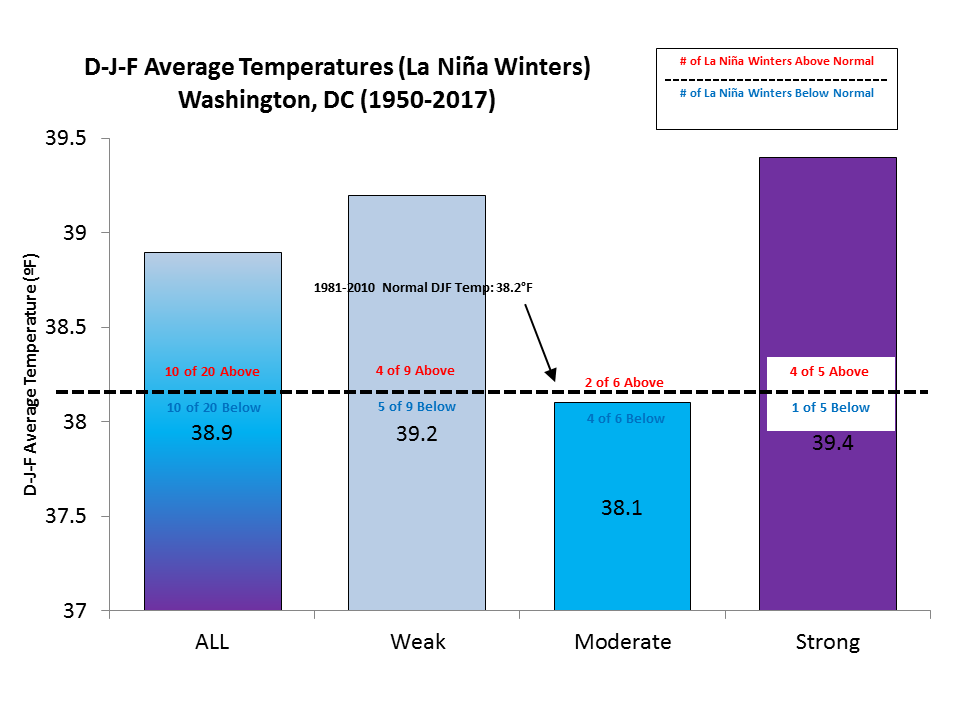
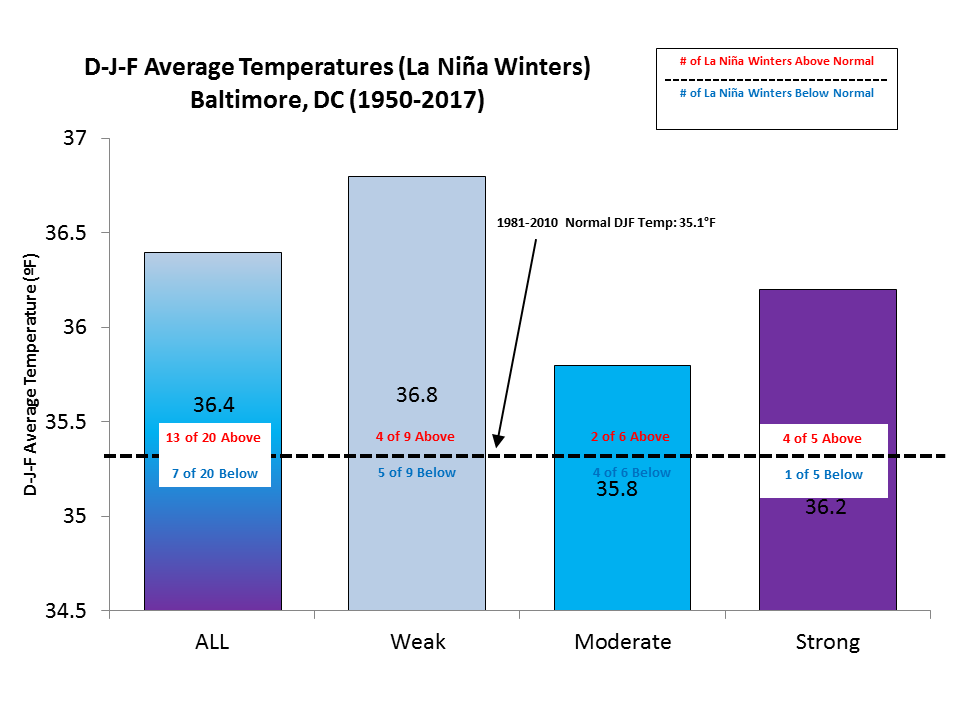
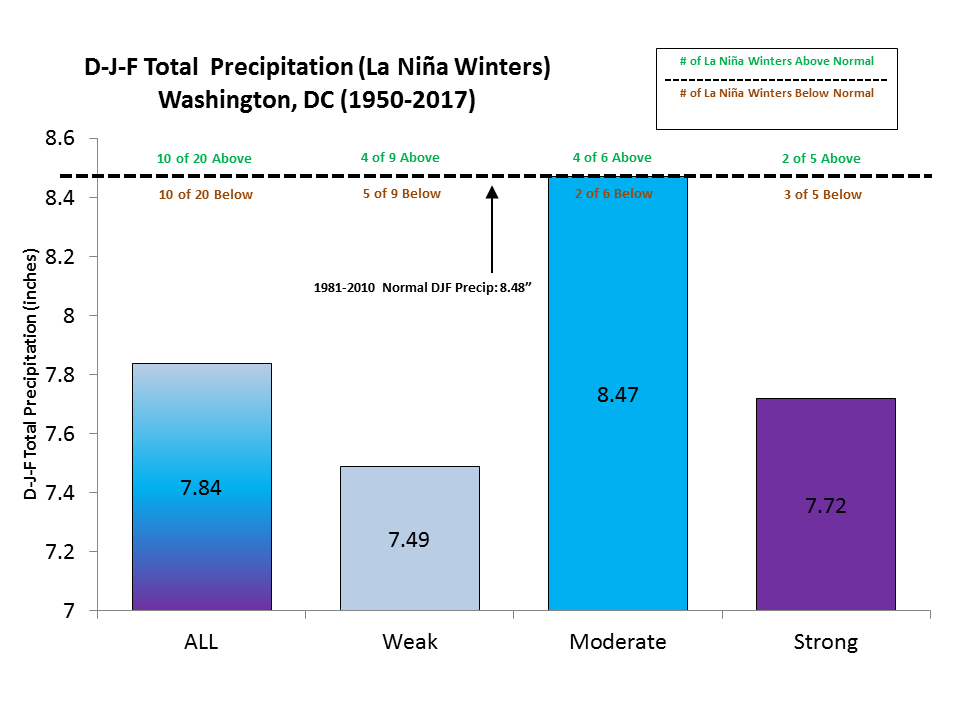
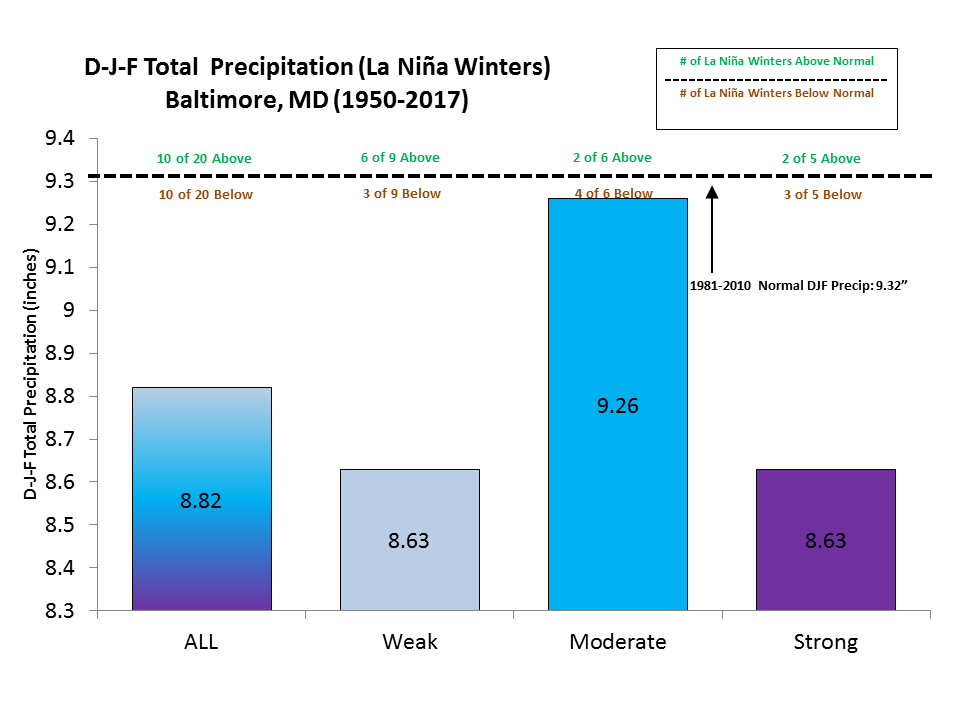
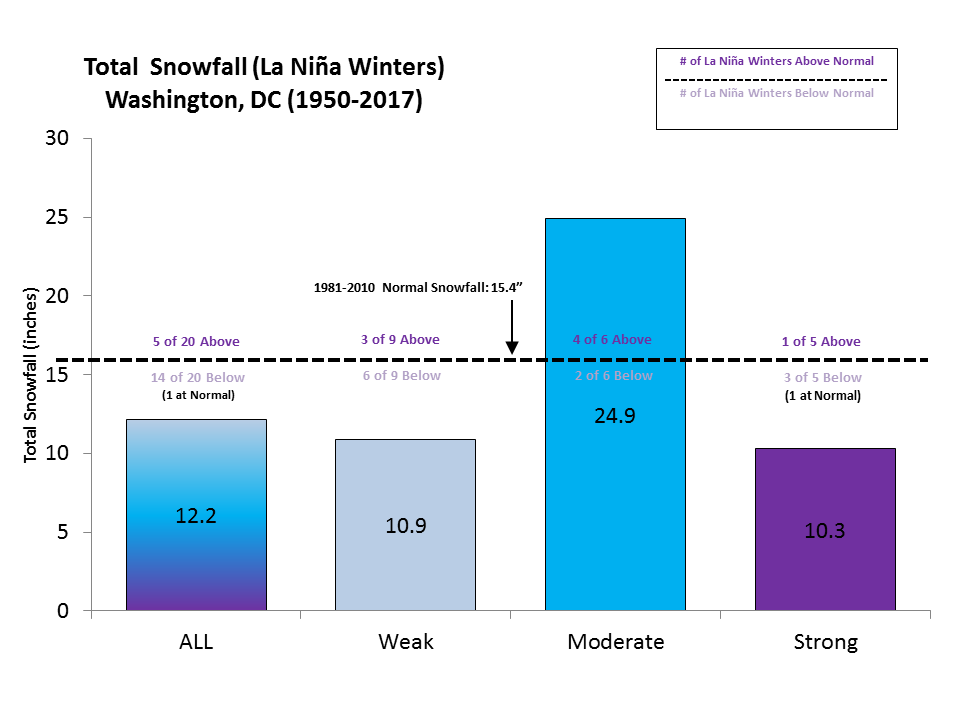
La Niña, which is a climate phenomenon characterized by unusually cool ocean temperatures in the tropical Pacific Ocean, influences the winter climate pattern across the United States. The figures below are composites of average December, January and February (DJF) temperatures and precipitation, as well as seasonal snowfall at Washington, D.C. and Baltimore. During La Niña years (independent of strength of episode), DJF temperatures averaged near to slightly above normal while DJF precipitation and seasonal snowfall averaged near to slightly below normal. These composites are further broken down by the strength (weak, moderate and strong) of the La Niña episode. Based on the small dataset, there appears to be some historical correlation between the strength of the La Niña episode and seasonal temperatures locally at Washington D.C. and Baltimore: the stronger the La Niña, the warmer the temperatures averaged. Winter precipitation averaged slightly drier than normal during all La Niña intensities. Seasonal snowfall during La Niña winters averaged below normal during moderate and strong episodes.
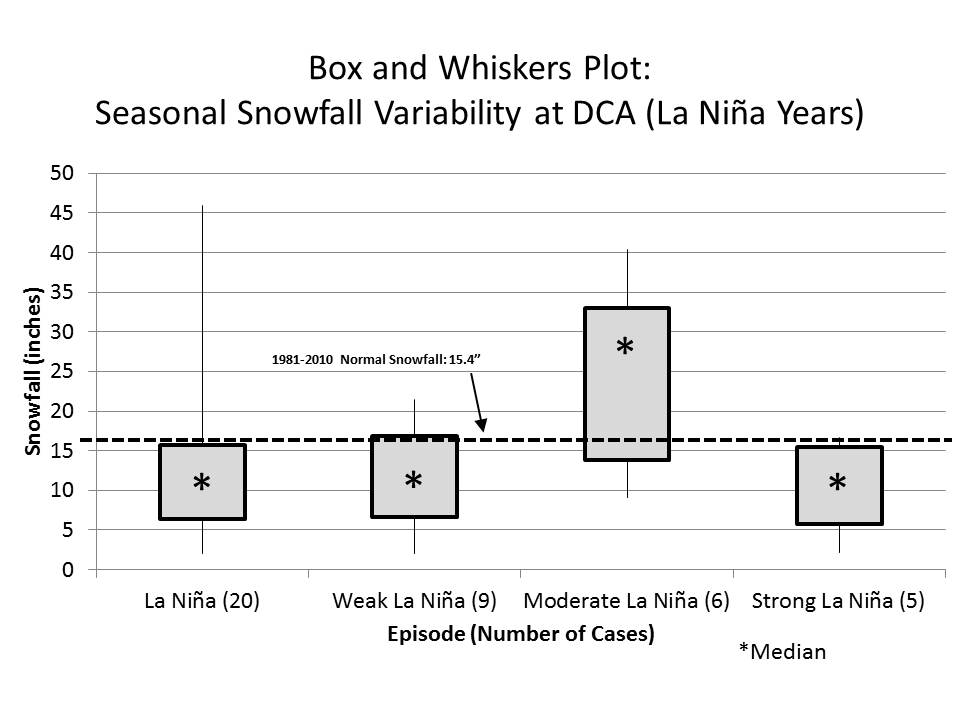
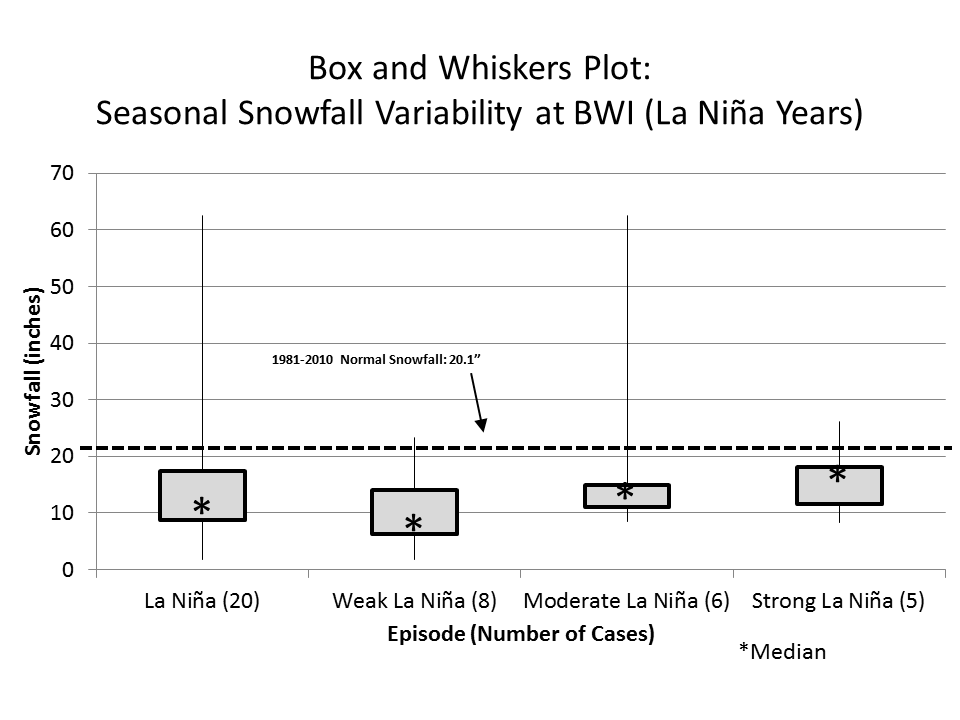
Not all La Niña winters are alike. Many other shorter- [e.g., North Atlantic Oscillation (NAO), Pacific-North American Pattern (PNA)] and longer-term climate patterns influence the local weather and climate. For example, while almost all of the La Niña episdoes are linked to near or below normal snowfall at Washington D.C. and Baltimore, the weak La Niña episode during the 1995-96 winter was an outlier in the dataset with well above normal snowfall for the season. In this case, the above normal snowfall was weighted heavily by the 6–8 January 1996 blizzard, when 17.1 (22.5) inches of snow fell at Washington D.C. (Baltimore). Aside from the 1996 blizzard, the only other big snowfall events with double digit snowfalls during a La Niña winter (since 1950) were the 10.2 inches recorded on 16–17 December 1973 at Washington D.C. and the 14.9 inches recorded on 25 January 2000 at Baltimore. The box and whisker plots below show the variability in snowfall during La Niña winters. The top of the boxes represent the 75th percentile value, meaning 75 percent of winters had snowfall amounts less than that value. The bottom of the boxes represent the 25th percentile, meaning 25 percent of winters had snowfall amounts less than that value. The top and bottom of the lines represent the maximum and minimum observed winter snowfall values, respectively. The stars show the median snowfall amounts.
|


 Coastal Flood
 FAQ
FAQ