April 2026 Climate Summaries
Mobile Alabama and Pensacola Florida Area
National Weather Service Mobile Alabama
May 4th, 2026
April 2026 in Review - Outside of a couple brief cool snaps during the month, April 2026 was one to three degrees above normal in the averages of highs, lows and means. The month was uneventful as far as temperatures are concerned with no records reached at both Mobile and Pensacola.
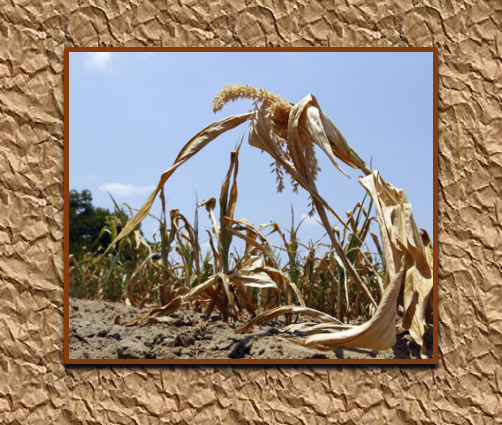
High intensity drought continued as a top weather story and worsened to close out the month; this drought event has been one of the most notable since 2000. Still a ways though from the historical droughts to impact the local area, with the longest duration of severe drought and higher occurring in late 2010 and continuing through Summer of 2012. The most intense (extreme to exceptional) drought as far as areal coverage is concerned developed in the Summer continuing into late Fall 2000.
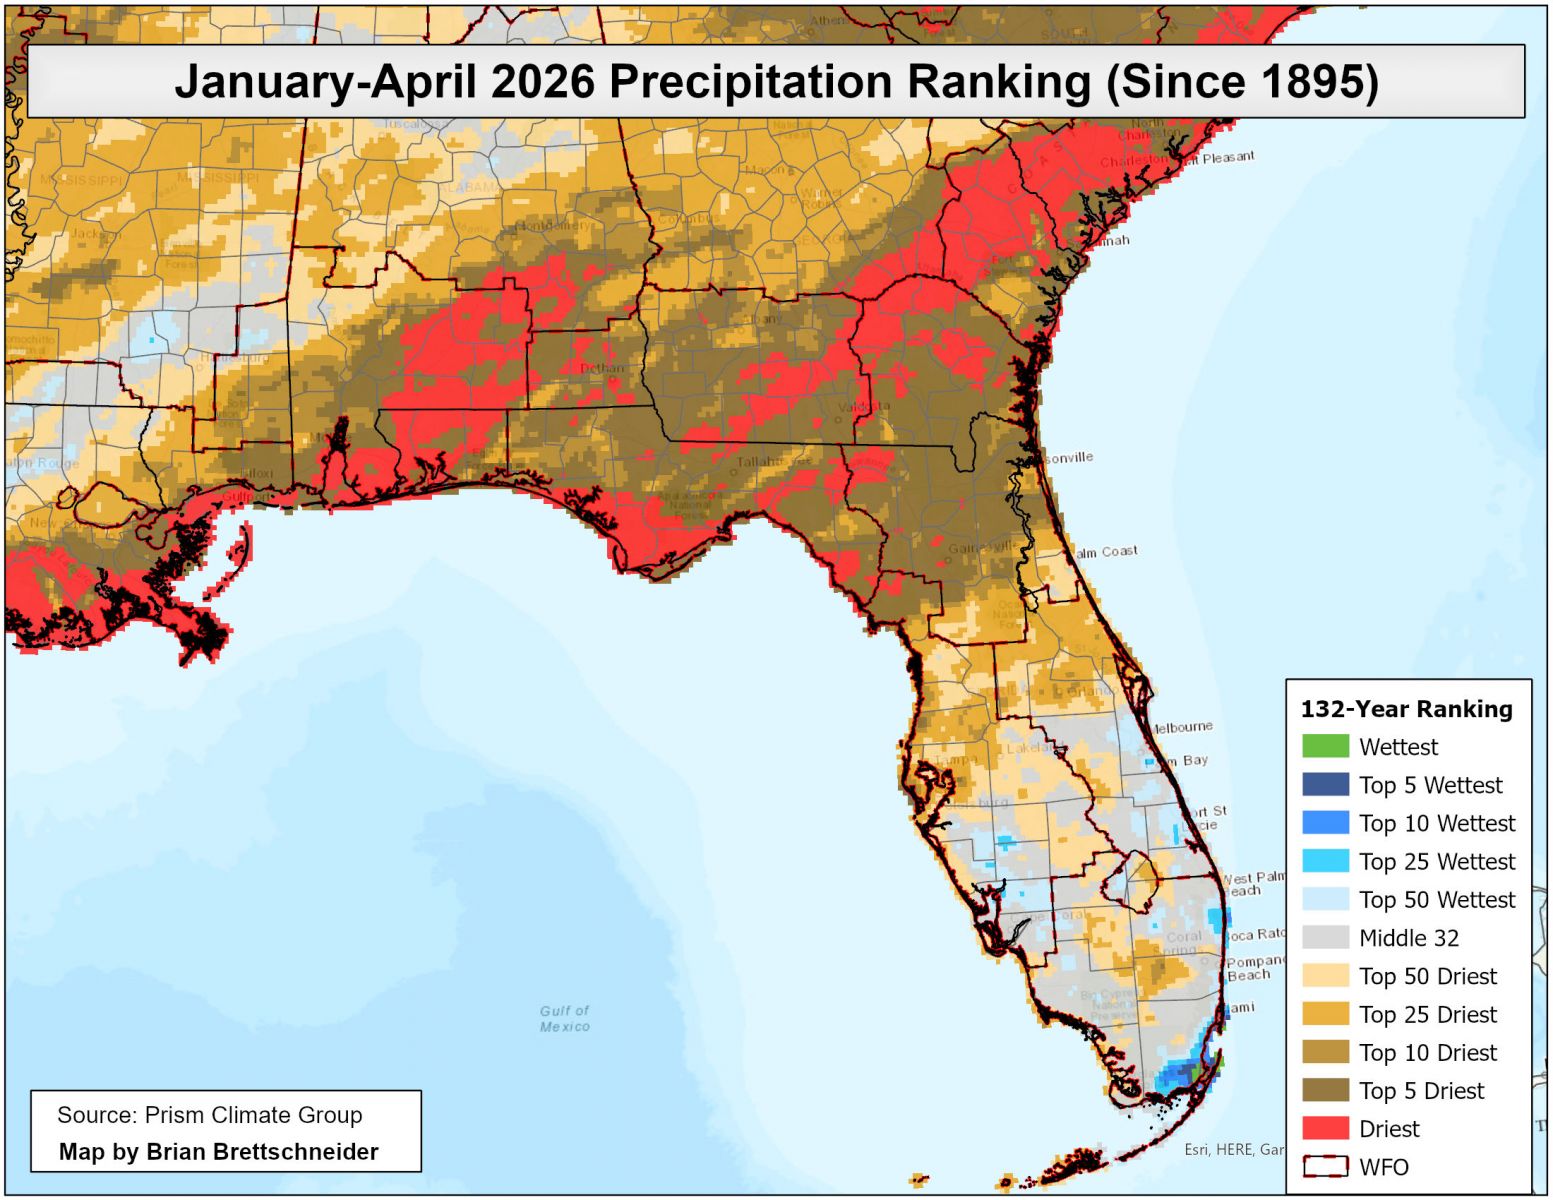
For April 2026, Mobile saw a little under two and half inches of rain and Pensacola just a bit over one inch and several inches short of normal April rains at both locations. Remarkably, at the close of April, both Mobile and Pensacola still has not reached the 10" year to date total rainfall measurement. That puts both sites in the top ten driest January through April periods on record.
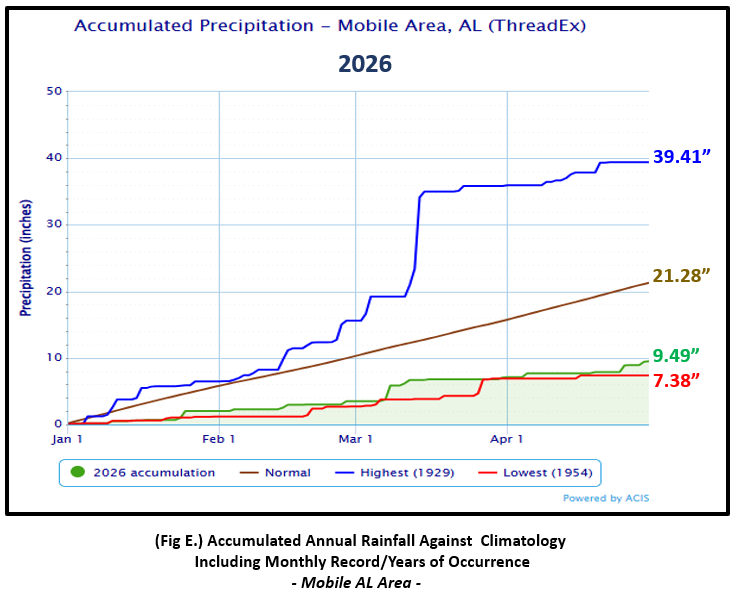
Mobile Alabama Area [Climate Normal Period 1991-2020, Climate Record Period 1872 to Present]- The average monthly high of 80.4° was 2.6° above normal. The average monthly low was 58.2° or 2.2° above normal. The average monthly temperature of 69.3° was 2.4° above normal. The highest temperature for the month, 86° on the 27th, was 6° above the normal daily high temperature for this date. The lowest temperature for the month, a chilly 44° on the morning of the 20th was 13° below the normal daily low temperature on this date. No record temperatures were reached. (Fig. A) shows a bar graphical representation of how the Mobile area daily temperatures compared to the seasonal normal daily highs and lows. The extremes are also shown. Bar graphs reflecting the daily high/low temperature departures from normal are provided in the table below (Figs. B and C). The rain gauge collected only 2.44" for the month, 3.27" below normal (Fig. D). Annual rainfall (Fig. E) is just a little north by 2.11" from being the all time driest first third of the year on record. Deficits have surged to well over 11" below normal to date with rainfall to date at only 9.49", standing tall at 5th driest period on record.
April top records for the month during the Period of Record for the Mobile Area:
Click on the Mobile Alabama area climate graphics below to expand:

|

|

|

|
|
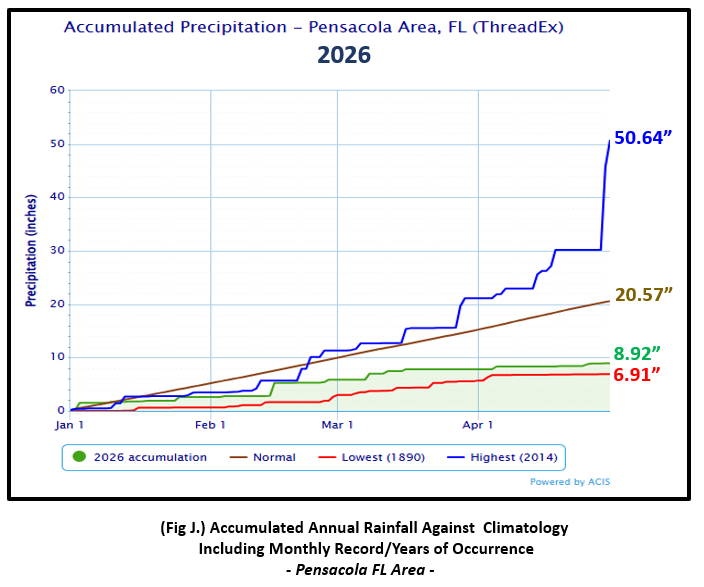
Pensacola Florida Area [Climate Normal Period 1991-2020, Climate Record Period 1879 to Present] - The average monthly high of 78.9° was 1.3° above normal. The average monthly low was 61.6° or 2.6° above normal. The average monthly temperature of 70.3° was 1.9° above normal. The highest temperature for the month, 82° was reached on the 16th, 26th, 27th and the 29th. The lowest temperature for the month, 51° occurred on the morning of the 20th, 9° below the normal daily low temperature on this date. No record temperatures were reached at Pensacola. (Fig. F) shows a bar graphical representation of how the Pensacola area daily temperatures compared to the seasonal normal daily highs and lows. The extremes are also shown. (Figs. G and H) shows the daily high/low temperature departures from normal. The rain gauge measured a meager 1.11", 4.41" below normal for April (Fig. I). Annual rainfall (Fig. J) is just a little north by 2.01" from being the all time driest first third of the year on record. Deficits have surged to well over 11" below normal to date with rainfall to date at only 8.92", standing at 7th driest period on record..
April top records for the month during the Period of Record for the Pensacola Area:
Click on the Pensacola Florida area climate graphics below to expand:

|

|

|

|
|
Additional April 2026 Climatology and Topics
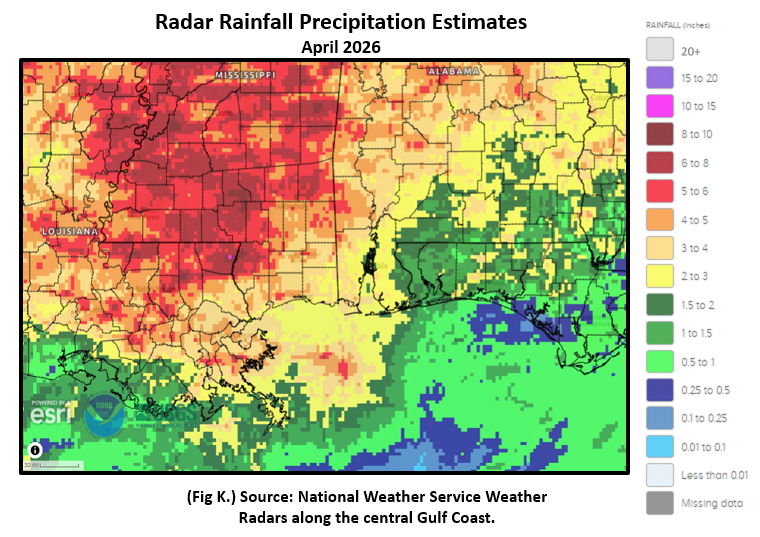
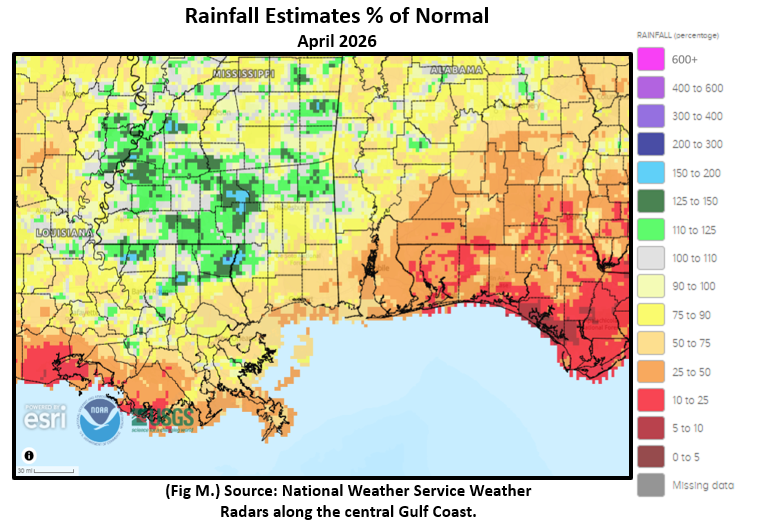
Overall, the northwest part of the local area saw close, to a bit above normal April rainfall while east and southeast across the I-65 corridor to the Gulf coast saw growing deficits. (Fig. K) shows the areal monthly rainfall total, (Fig. L) shows the areal rainfall departures from normal and (Fig. M), the areal percent of normal rainfall. Since January, the central Gulf Coast to the Southeast has been within the top five driest periods on record with large embedded footprints of being the top driest. Close to home, east of I-65, southward to much of the coastal counties has been the top driest for the four month period. (Fig. N). (Fig. O) Shows all six of NWS Mobile's Automated Surface Observing System (ASOS) Precipitation departures to date spanning Jan 1st to Apr. 30th ranging between 10 and 12" below normal to date. Extreme drought expanded westward and covered nearly 65% of the local area by the end of April. (Fig. P)
|

|
|
|
|

|

|
May 2026 Climatology, Seasonal Climatology and Outlooks:
The outlook for May calls for equal chances of above or below normal temperatures over the local area. Temperatures leaning above normal are favored over the Florida Peninsula. There is a signal for the westerlies and storm tracks to be become displaced more southward from Texas to the Deep south favoring May's precipitation leaning above normal. This may lead to some improvements in drought through the month. For the very latest on current drought, short term, and seasonal outlooks, please refer to the Drought Information in the table below.
Hurricane season is about to start. Be on the lookout for NOAA's official hurricane season outlook coming by the middle of May.
Click on the snap shots below to expand:
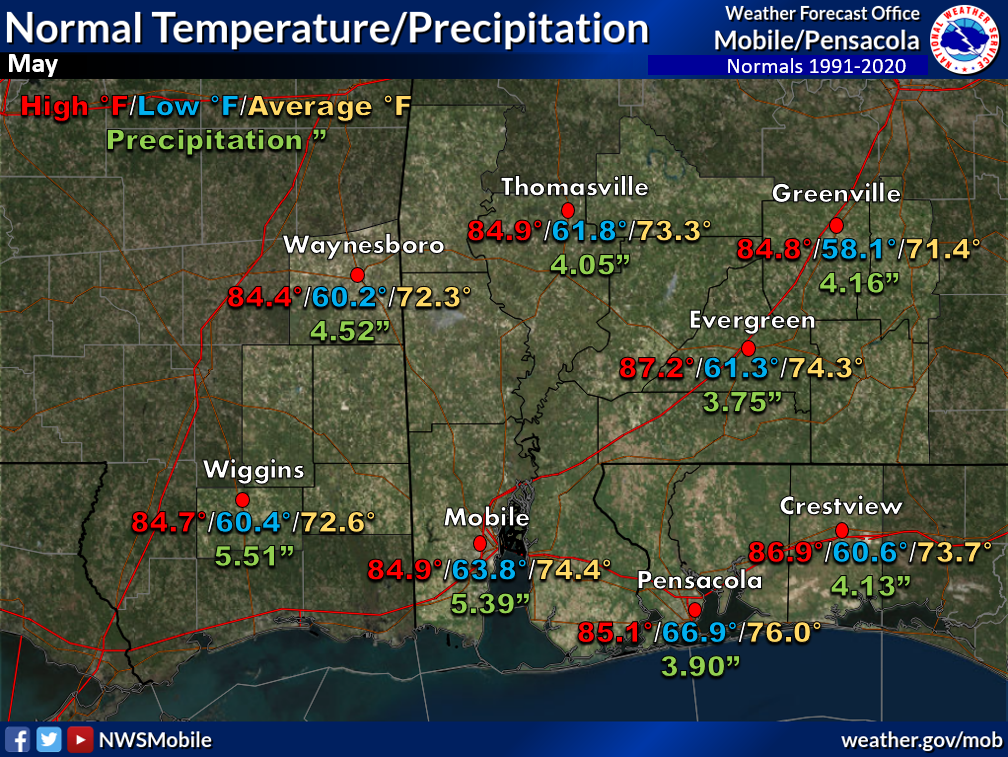 May Normals May Normals |

|

Outlook |
|
Additional Climate Links:
The National Weather Service Mobile Alabama's Climate and Past Weather page provides climate data at your fingertips for many observation points in the local forecast area by accessing the NOWData tab as well as many other climate resources. The Climate Prediction Center Link provides short and longer range climatic outlooks and education about the larger scale global circulations that impact temperatures and weather. With the large agriculture and farming presence along the central Gulf coast, the Drought Monitor link provides updates on drought trends and impacts. Another very helpful resource is the Community Collaborative Rain Hail and Snow (CoCoRaHS) network, which is a large group of volunteers working together to measure and map precipitation (rain, hail, and snow). The aim of CoCoRaHS is to provide the highest quality data for natural resource, education and research applications. You can be a part of the CoCoRaHS team by becoming a volunteer rainfall observer.


