December 2023 Climate Summaries
(Including Annual ReCap)
Mobile Alabama and Pensacola Florida Area
National Weather Service Mobile Alabama
January 5, 2024
December 2023 in Review - Temperatures for the most part were generally around 2.0° or less above normal at both Mobile and Pensacola for the month. A couple of noticeable spikes to well above normal high and low temperatures occurred, the first being toward the end of the first week of the month and then the second, a somewhat lengthy period of above normal temperatures carrying through the Christmas Holidays. Mobile saw one record high temperature reached and Pensacola saw two record highs, all three of which tied with previous record high occurrences. Shortly after the Christmas holidays, the passage of a strong cold front sent low temperatures dropping off to the coldest of the month during the last week of the month.
Very close to half the monthly total rainfall at Mobile occurred on December 2nd, when over three inches fell and set a new record daily rainfall for the date. Drought remained a top news story in our local weather. But with several inches of monthly rainfall, the Gulf Coast did experience a one class improvement to close out the month of December.
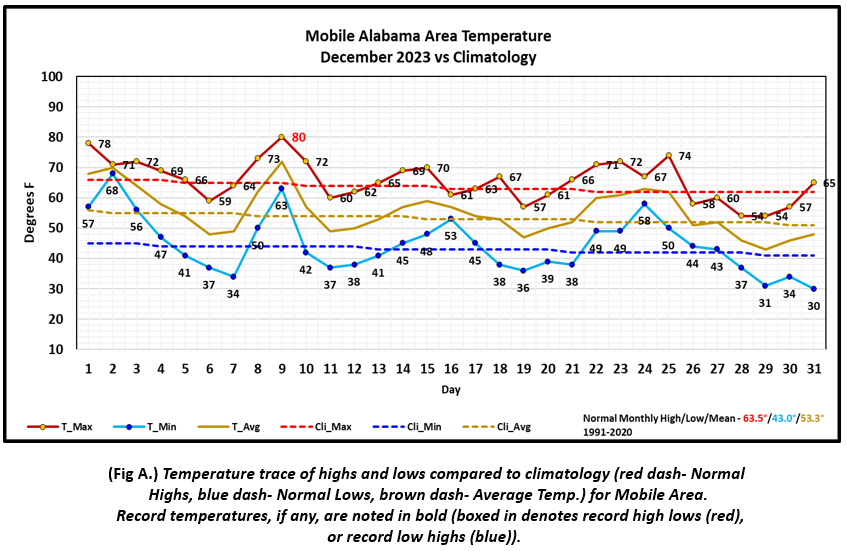
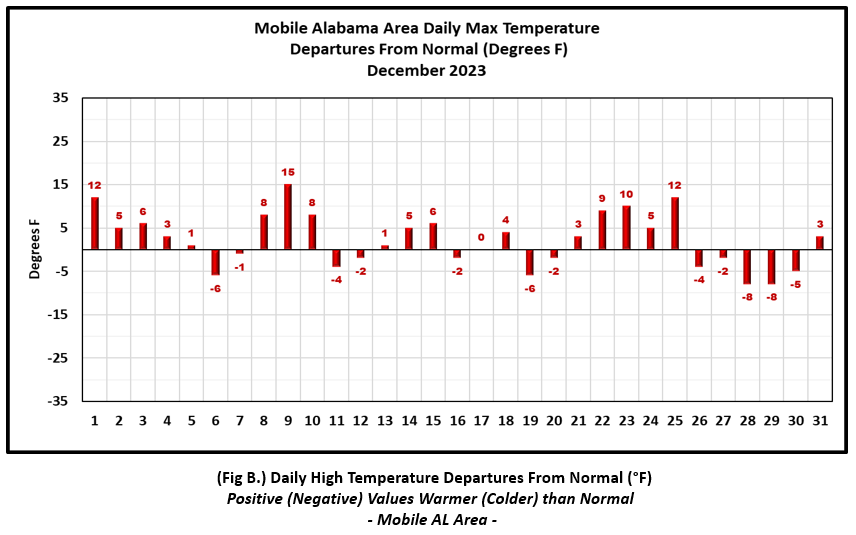
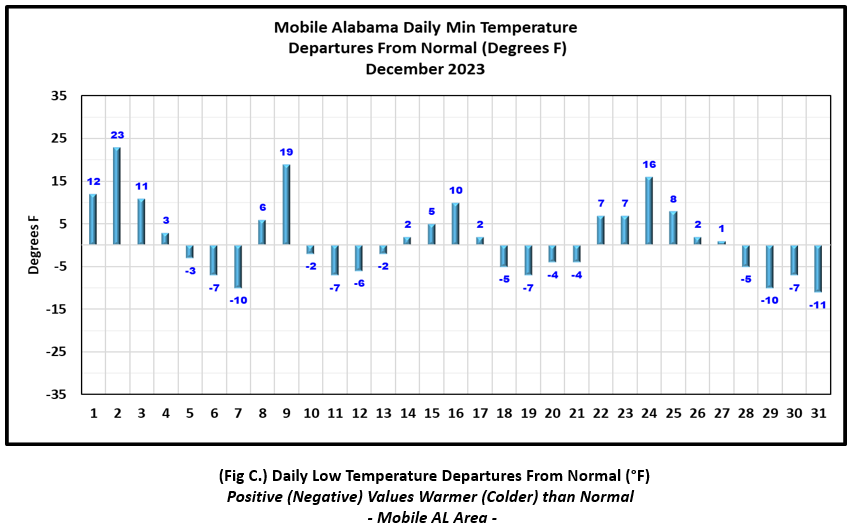
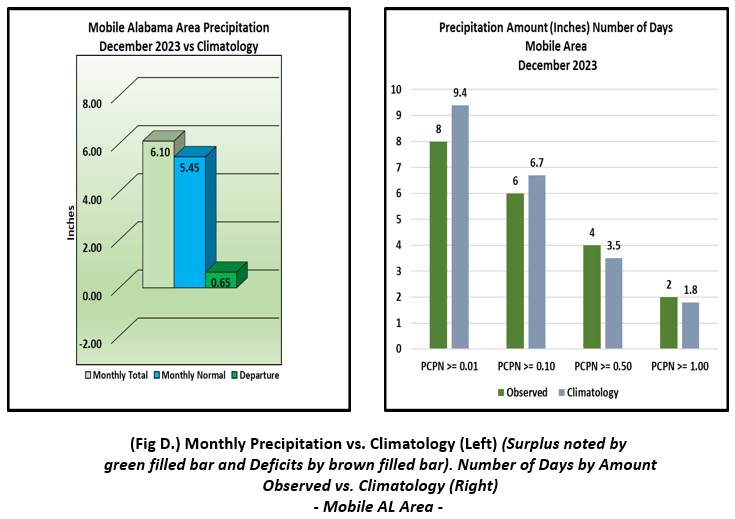
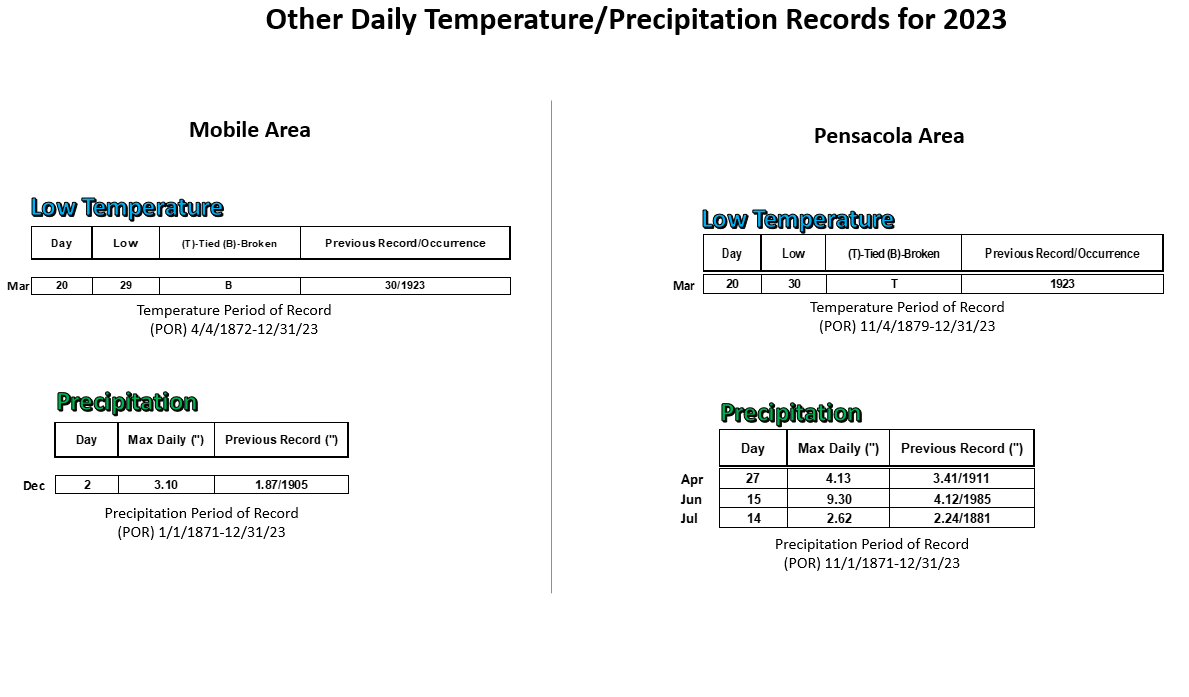
Mobile Alabama Area [Climate Normal Period 1991-2020, Climate Record Period 1872 to Present]- The average monthly high of 65.7° was 2.2° above normal. The average monthly low was 44.5° or 1.5° above normal. The average monthly temperature of 55.1° was 1.8° above normal. The highest temperature for the month, 80°, occurred on the 9th and was 15° above the normal for the date. This tied the record with the previous occurrence on this date occurring in 1986. The lowest temperature occurred New Year's Eve morning, dipping to 30° and 11° below normal for the day. (Fig. A) shows a graphical representation of how the Mobile area temperatures compared to the monthly normal daily highs and lows, which are shown by the colored dashed lines. Bar graphs reflecting the daily high/low temperature departures from normal are provided in (Figs. B and C). The rain gauge collected 6.10" for the month (Fig. D), or 0.65" above normal. Very close to half of the monthly rain occurred on December 2nd, when 3.10" fell, setting a new record for highest daily rainfall for the date. This smashed the previous record of 1.87" set on this date way back in 1905.
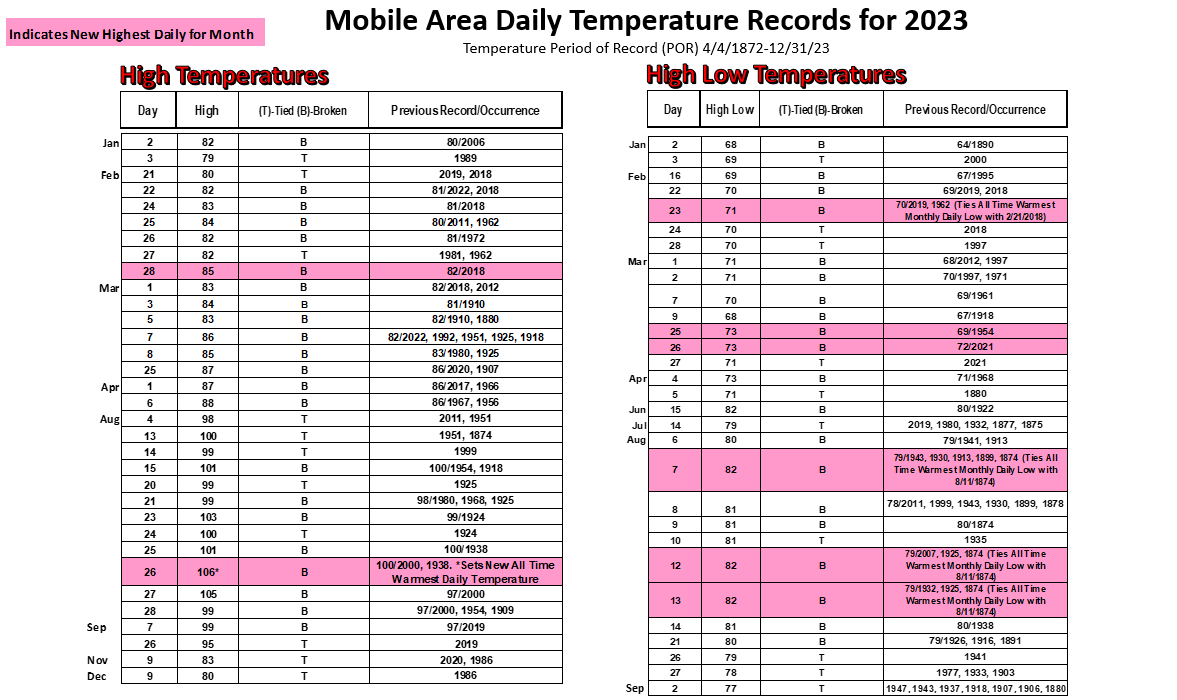
December Top Records for the Month During the Period of Record for the Mobile Area:
Click on the Mobile Alabama area climate graphics below to expand:
|
|
|
|
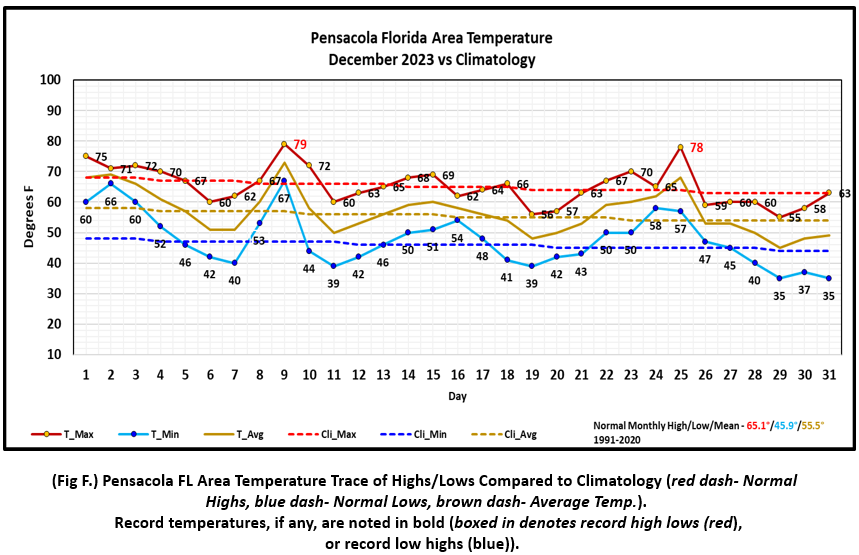
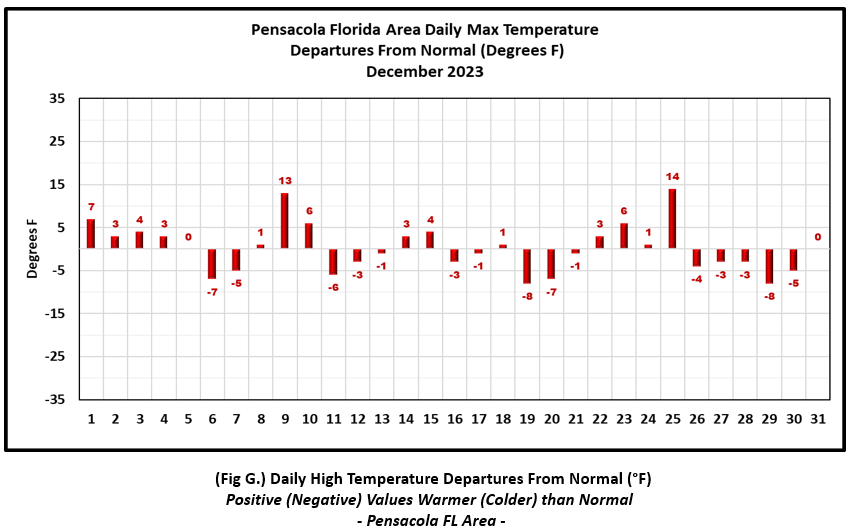
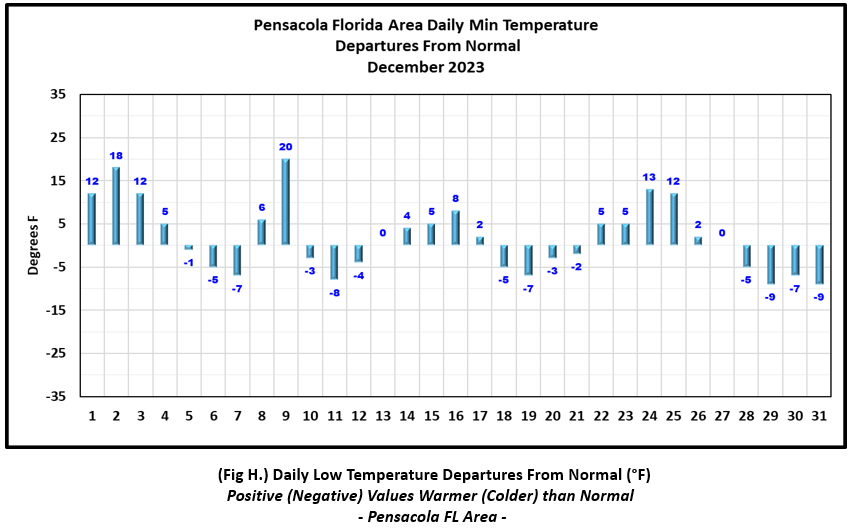
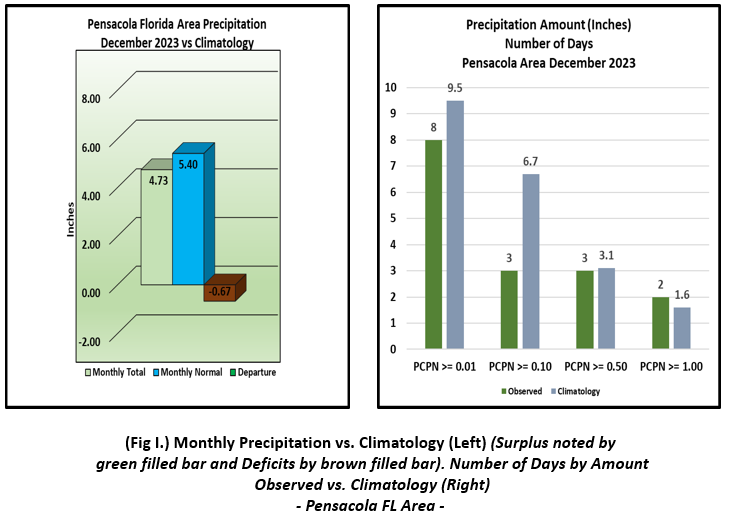
Pensacola Florida Area [Climate Normal Period 1991-2020, Climate Record Period 1879 to Present] - The average monthly high of 65.3° was 0.2° above normal. The average monthly low was 47.7° or 1.8° above normal. The average monthly temperature of 56.5° was 1.0° above normal. The highest temperature for the month, 79°, occurred on the 9th and was 13° above the normal for the date. This tied the record with the previous occurrence on this date occurring in 2009. Christmas Day saw record warmth for the Pensacola area, with the mercury topping a record of 78°, 14° above the normal for the date. This tied the record with two other years for the day, in 1974 and 1955. The lowest temperature occurred on the morning of the 29th and New Year's Eve morning, dipping to 35° and 9° below normal for these days. (Fig. F) shows a graphical representation of how the Pensacola area temperatures compared to the seasonal normal daily highs and lows, which are shown by the colored dashed lines. (Figs. G and H) shows the daily high/low temperature departures from normal. The rain gauge collected 4.73" for the month (Fig. I), or 0.67" below normal for the month.
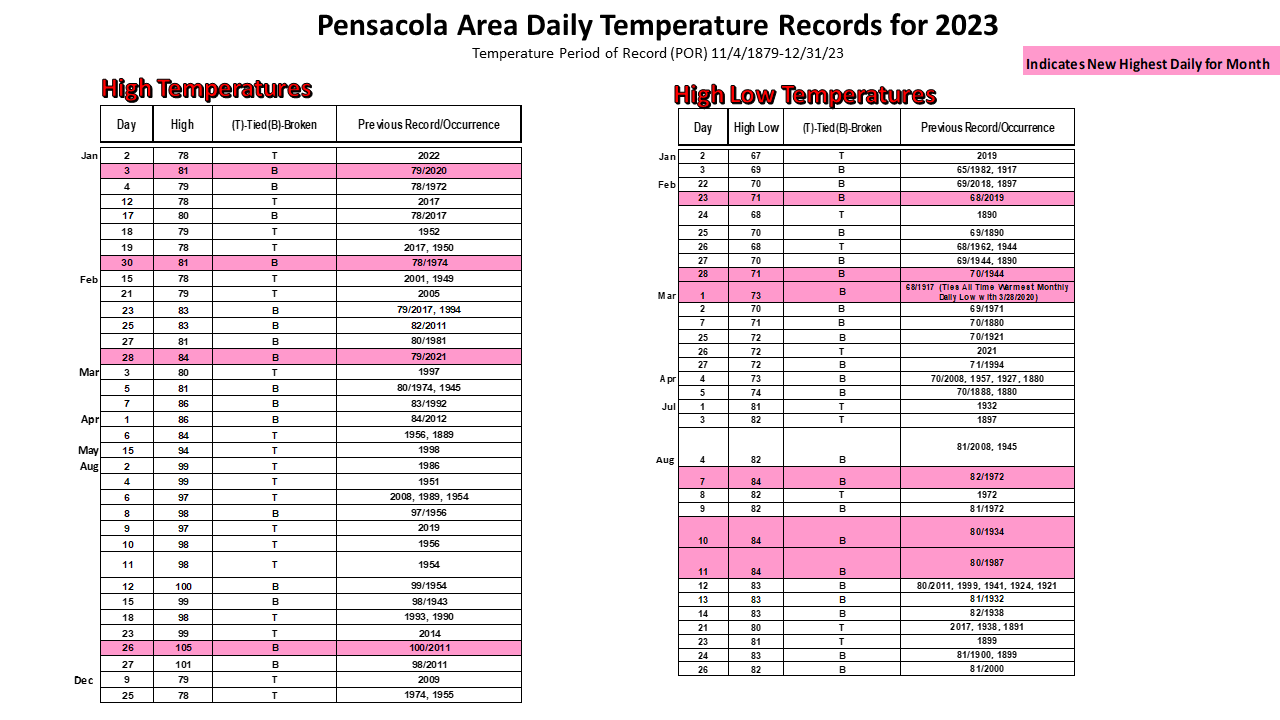
December Top Records for the Month During the Period of Record for the Pensacola Area:
Click on the Pensacola Florida area climate graphics below to expand:
|
|
|
|
2023 (A Recap):
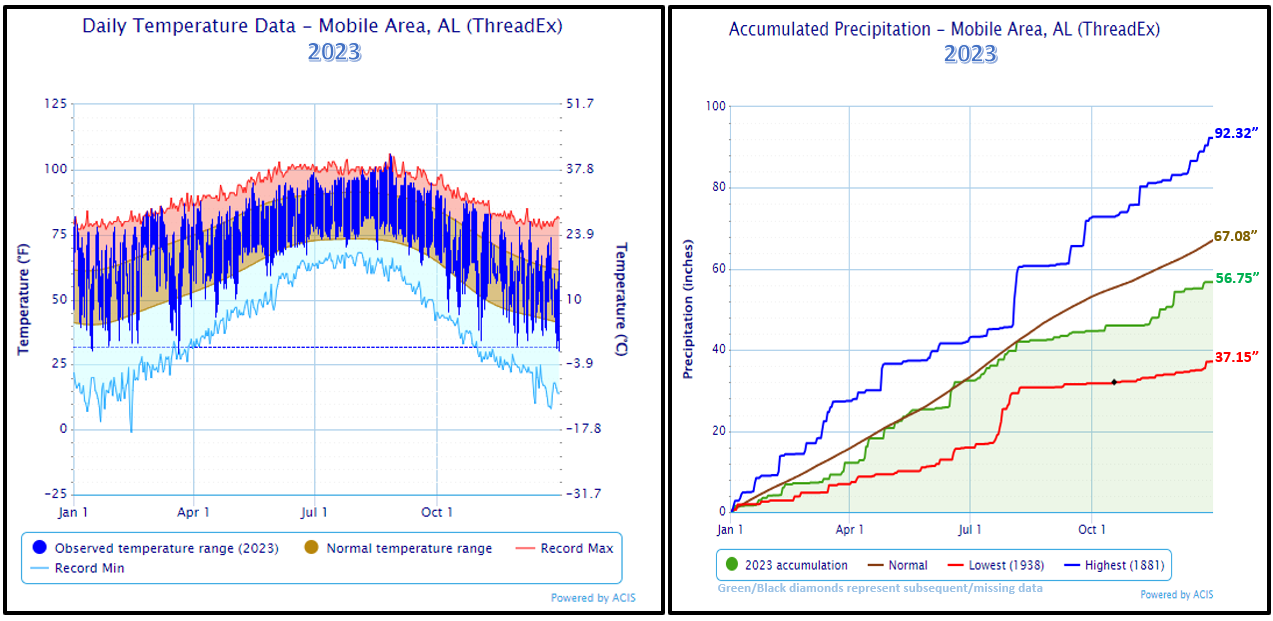
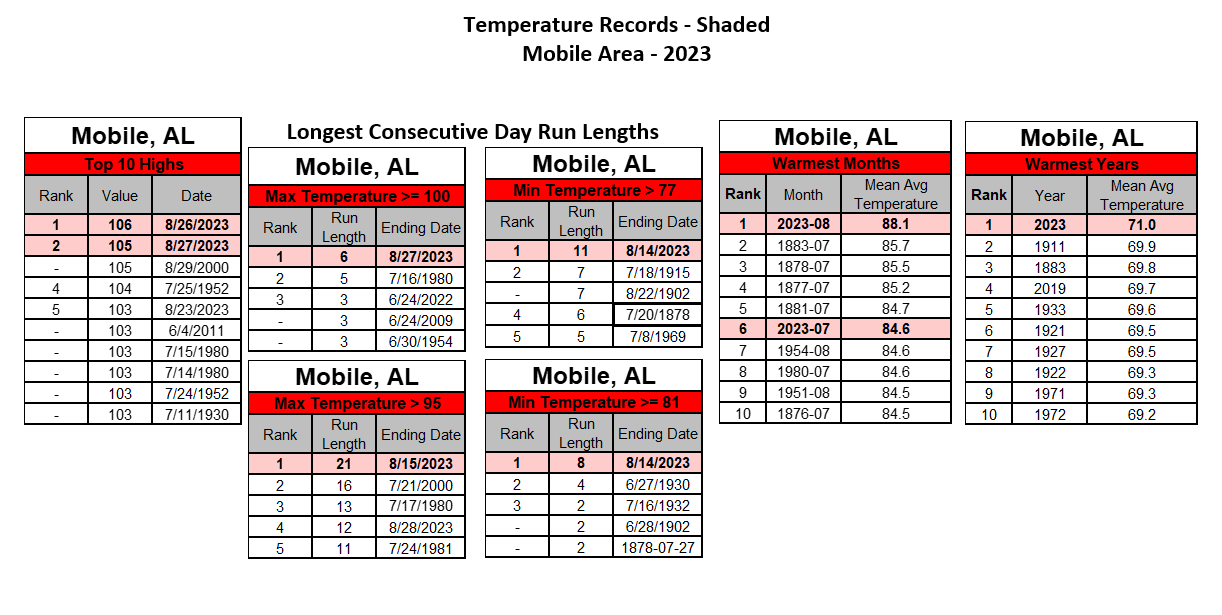
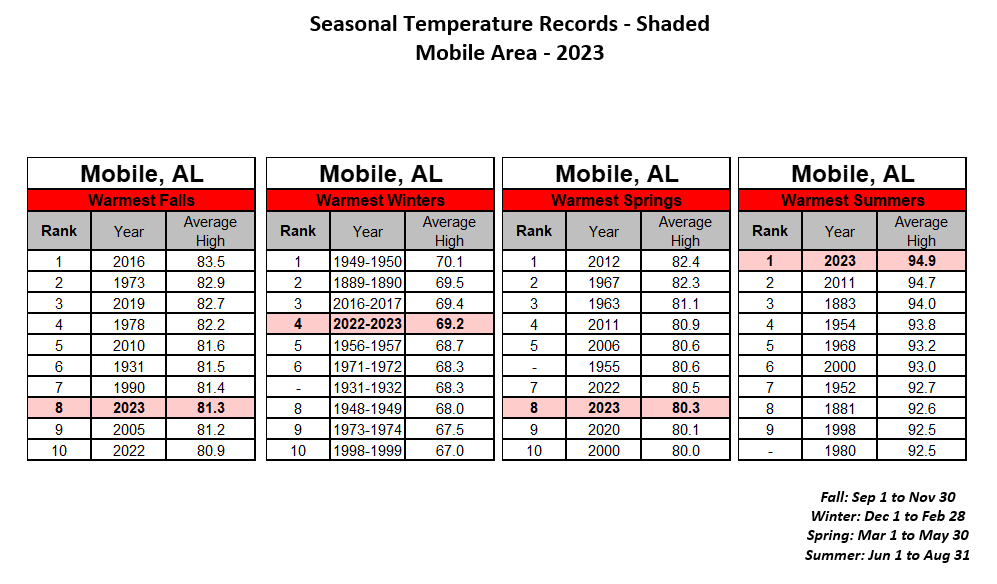
Mobile: The warmest year on record, aided by an astounding total of 64 record daily temperatures. Of the records, 33 were record highs, 30 were record high lows, and one was a record low. August saw the most record highs at 12 days of occurrence. The high temperature on February 28th of 85° set a new warmest daily high for the month. Moving into the end of August, the high temperature on August 26th of a scorching 106° set a new warmest all-time daily temperature during the period of record. August also saw the most days of broken or tied record high low temperatures at 11 occurrences. August saw three mornings where the low was a balmy 82°, the 7th, 12th and 13th and matching the warmest mornings on record during the period of record for the month. The all-time top warmest days on record of 106° and 105° occurred on August 26th and 27th respectively. To close out, August 2023 was the top warmest month on record with a mean average temperature of 88.1°. Consecutive run days of temperatures Highs > 95°, Highs >= 100°, Lows > 77°, and Lows >= 81°, were all top ranked for 2023. The distribution of average high temperatures for all four seasons were in the top 10 warmest with the summer of 2023 being the warmest on record, with an average high of 94.9°.
Annual rainfall was in considerable deficit by 10.33" shy of normal. The driest month was October at 1.34" with the wettest month being July at 7.28.". One record daily rainfall impacted Mobile with 3.10" falling on December 2nd.
______________________________________________
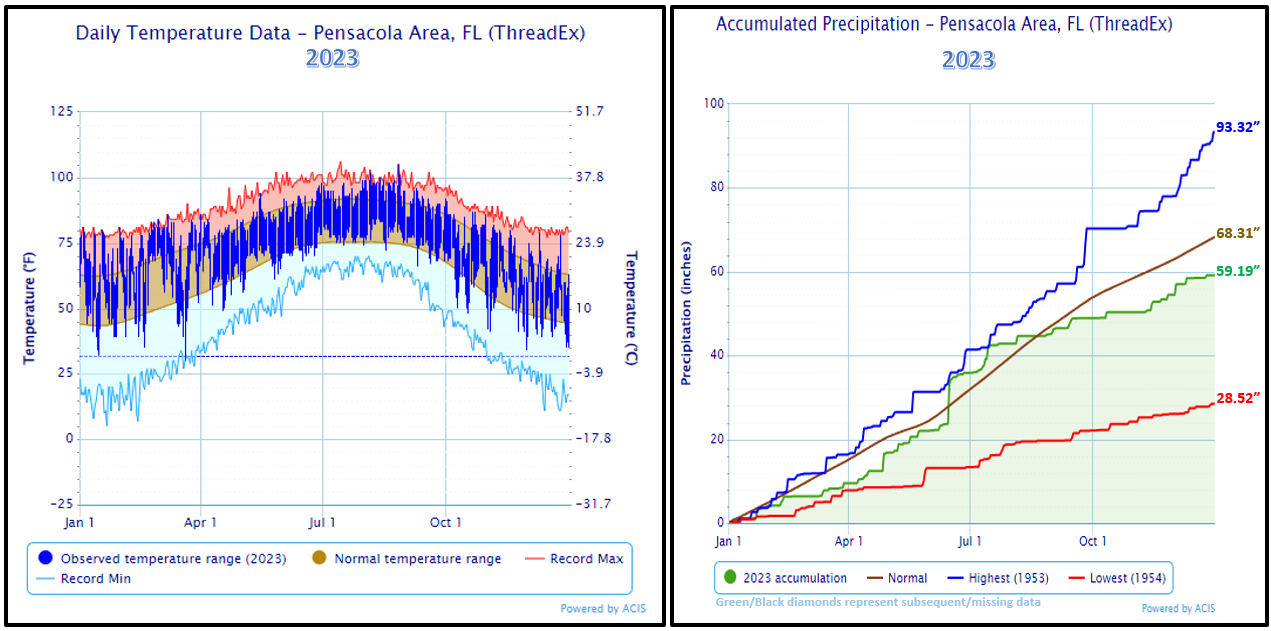
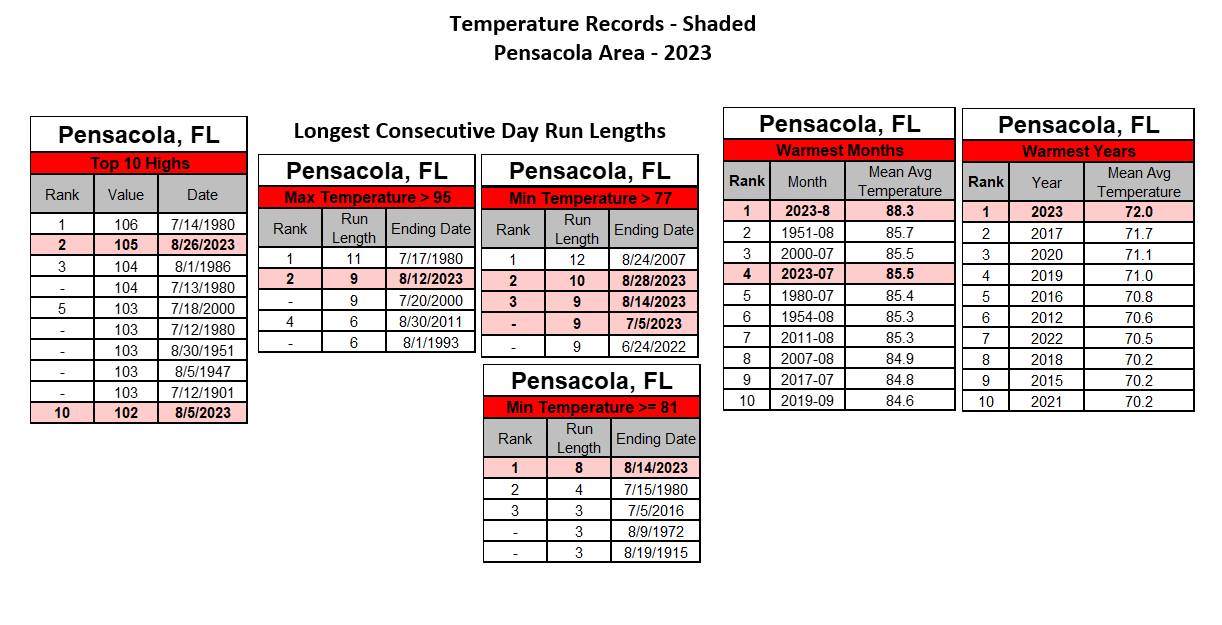
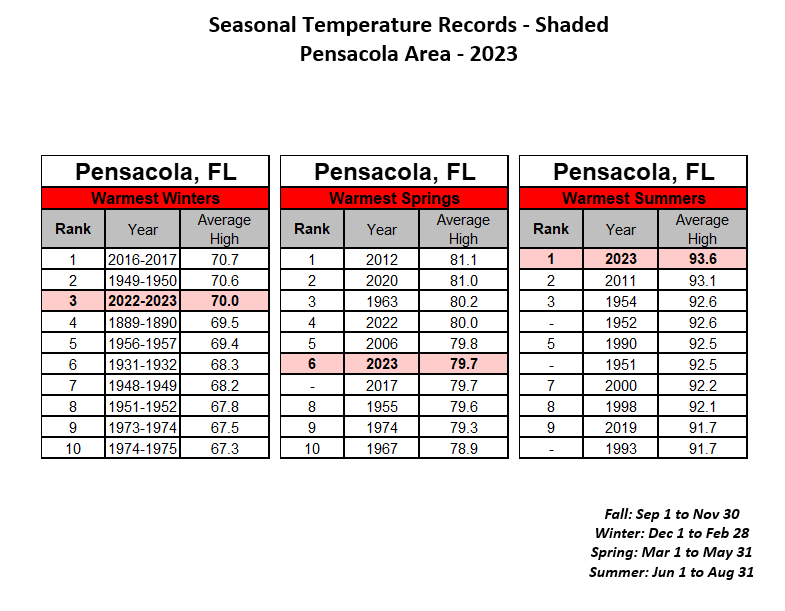
Pensacola: Experienced the warmest year on record, aided by an astounding total of 68 record daily temperatures. Of the records, 35 were record highs, 32 were record high lows, and one was a record low. August saw the most record highs at 13 days of occurrence. There were three months where a daily high temperature rose to all-time warmest values. These were January 3rd and 30th at 81°, February 28th at 84°, and August 26th at a sizzling 105°. August also saw the most days of broken or tied record high low temperatures at 13 occurrences. There were three months where a morning high low temperature was warmest on record. These were February 23rd and 28th at 71°, March 1st at 73°, and August 7th, 10th, and 11th at a toasty 84°. The warmest month on record was August with a mean average temperature of 88.3°. Coming in fourth warmest was a month earlier with July 2023's mean average temperature of 85.5°. Consecutive run days of Highs > 95°, Lows > 77°, and Lows >= 81° were all ranked in the top five. The distribution of average high temperatures for three of the four seasons were in the top 10 warmest with the summer of 2023 being the warmest on record with an average high of 93.6°.
Pensacola's rainfall deficit was 9.12" shy of normal. The driest month was October at 1.44" with the wettest month being June at 13.82.". Three record daily rainfalls impacted Pensacola, with April 27th recording 4.13", June 15th 9.30", and 2.62" falling on July 14th.
_______________________________________________
No tropical cyclones impacted the local area in 2023. The daily temperature and precipitation records, their dates of occurrence and whether they were broken or tied are provided in following graphics below. A detailed listing of annual, monthly, and seasonal records is also provided.
2023 Temperature/ Precipitation and Records:
|
|
|
|
|
|
|
|
|
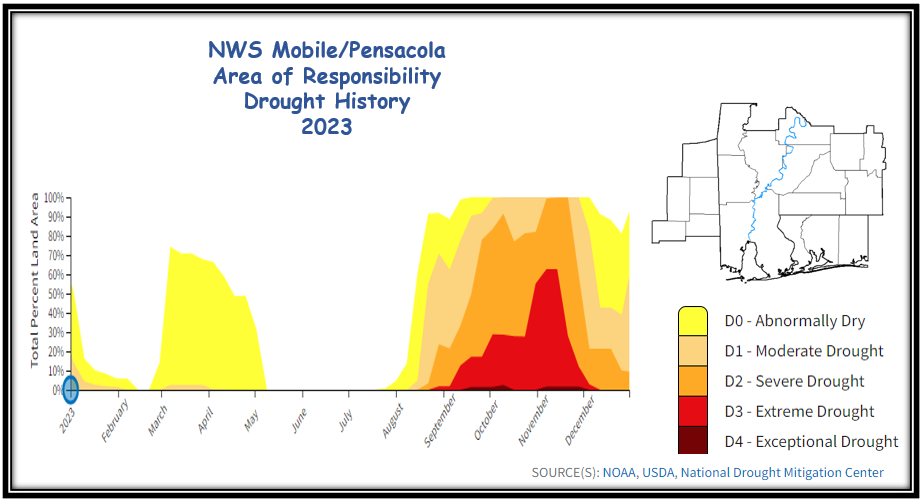
2023 Drought: Due to an extended period of dry weather and much below normal rainfall, high intensity drought began to take a foothold over the NWS Mobile/Pensacola forecast area of responsibility (AoR) by August. Drought worsened in areal land coverage beginning in September and continued through December before some improvement. This was the first time since late 2016 that extreme drought of notable coverage impacted the AoR. It's been 13 years, beginning in late 2010, since the local AoR was in the grip of the most recent longest duration of high intensity drought (severe (D2)) and higher that lasted nearly two years, coming to end by June 2012. Local Drought History: Click=> NWS Mobile/Pensacola AoR Interactive Historical Drought Information, to view additional details on local drought since 2000.
Annual rainfall was in short to very short supply. In some cases, well short by 10 to 20" of rain below annual normals by the close of the year. Building rainfall deficits through the year played a large role in drought development the end of the year.
2023 Severe Weather: At present, the official severe storm event database indicates the occurrence of 11 tornadoes impacting the National Weather Service (NWS) Mobile County Warning Area (CWA).
Here is the break-out by EF-Tornado Scale - EF0: 4, EF1: 5, EF2: 2, EF3: 0, EF4: 0, EF5: 0
Details of each survey are provided in the Past Significant Weather Events link.
Additional December 2023 Climatology and Topics
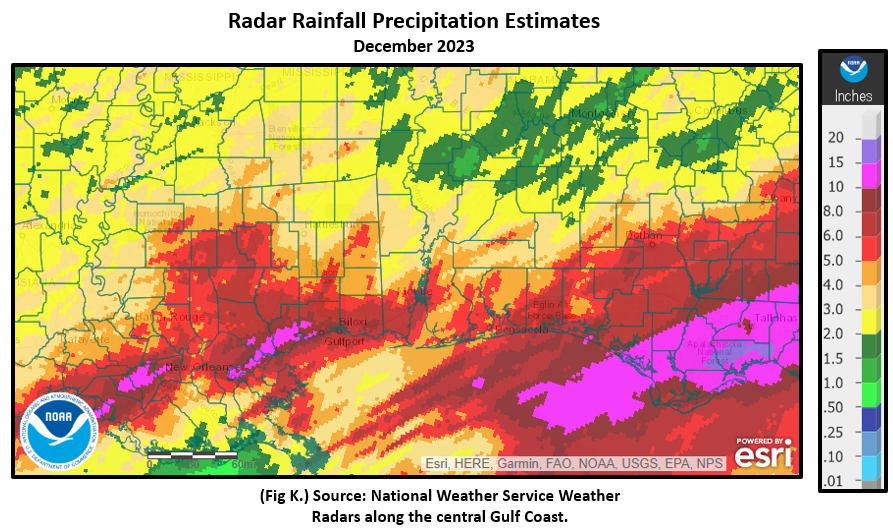
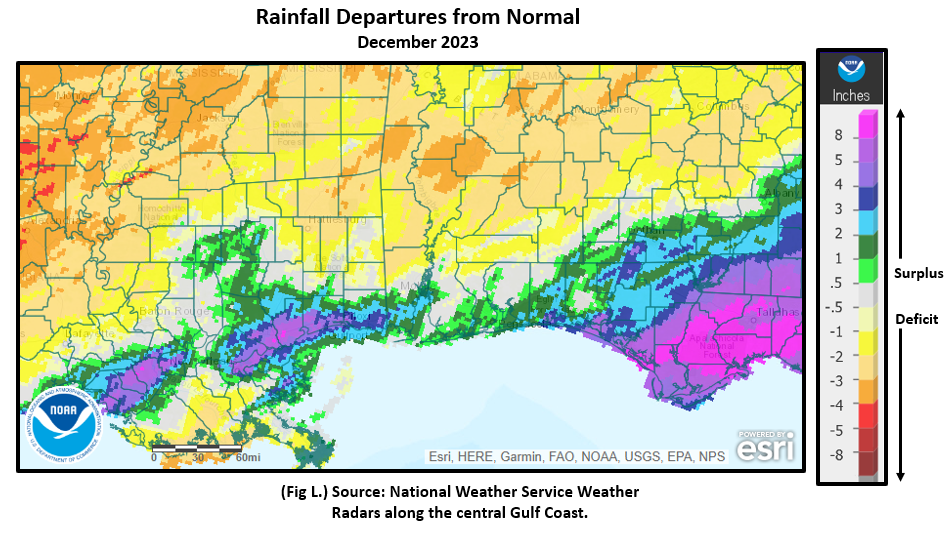
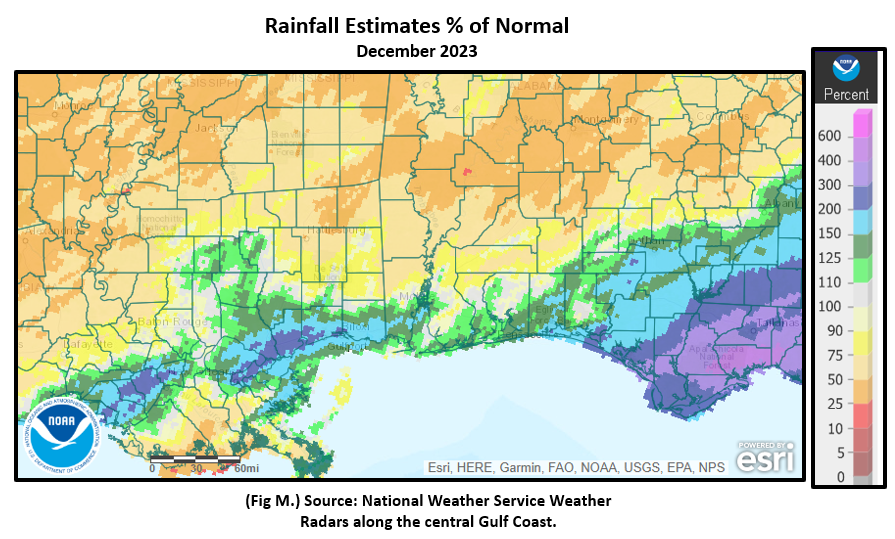
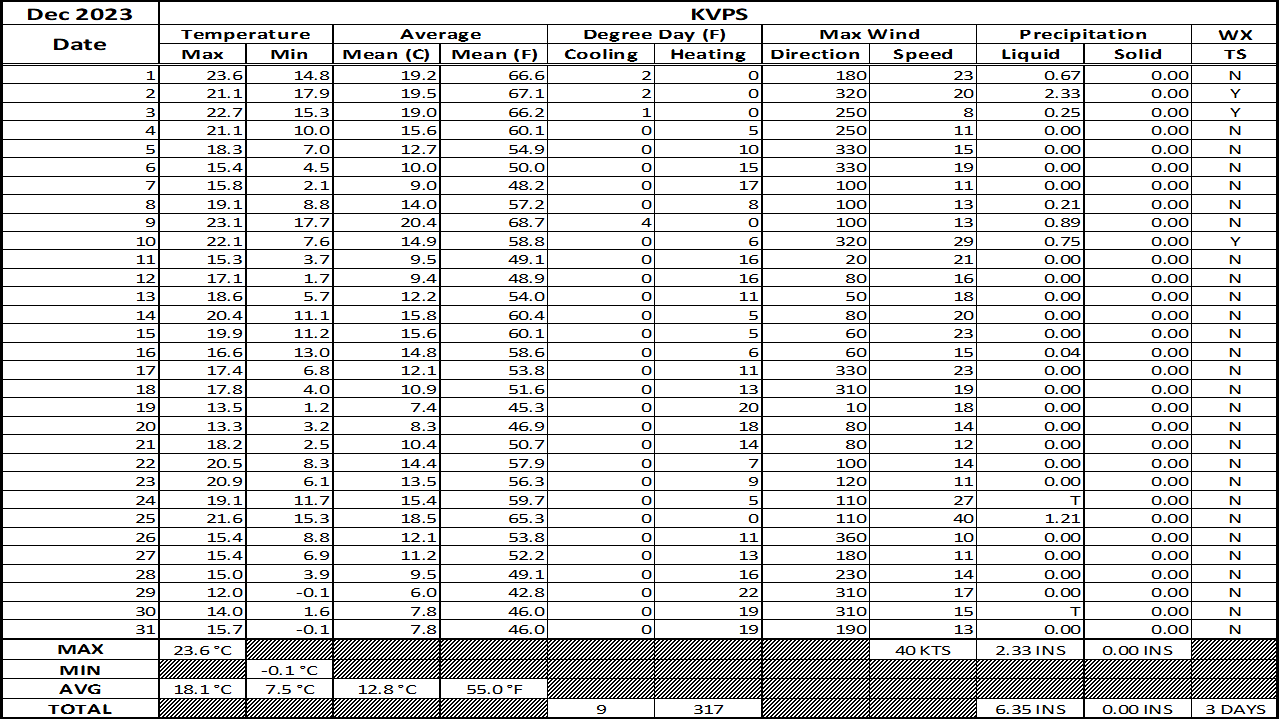
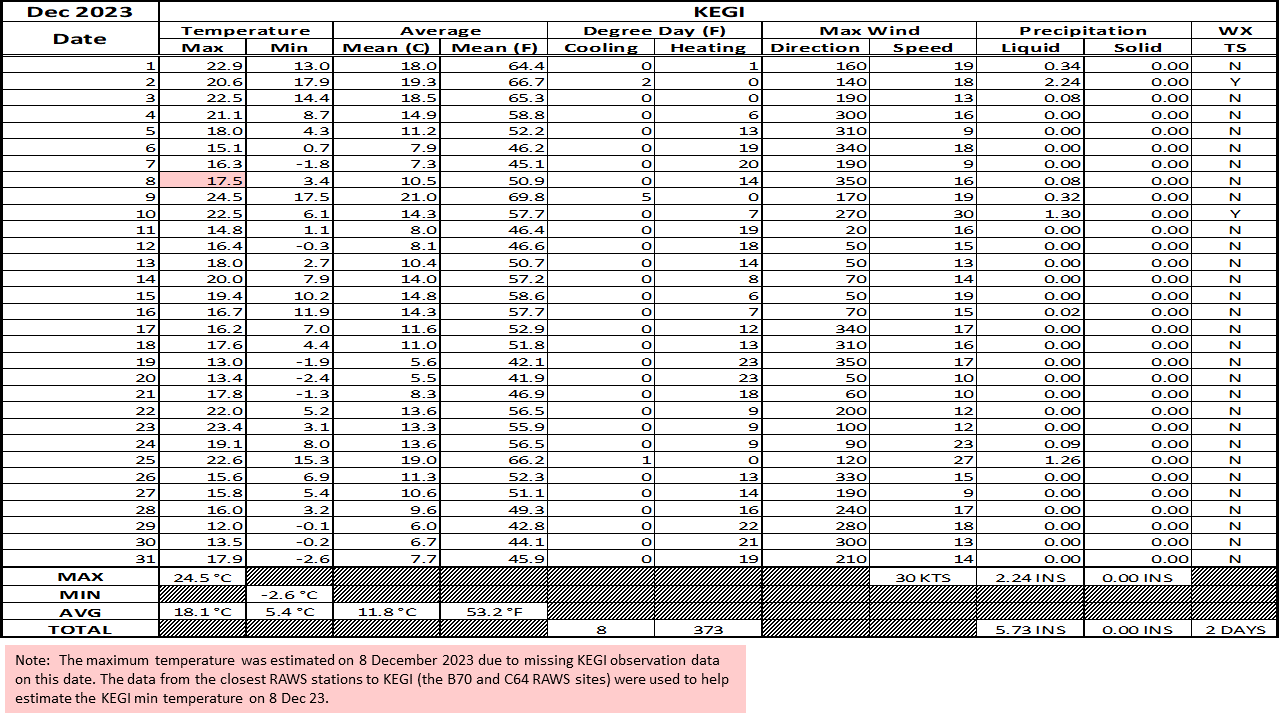
The focus of the heaviest rain was along the coast with storm totals of 3 to 6 inches or 125 to 150% of normal mostly along and south of I-10. North of the interstate, rainfall over the interior was in much shorter supply. Fig. K shows the areal monthly rainfall total, Fig. L shows the areal rainfall departures from normal and Fig. M, the areal percent of normal rainfall. The latest December 2023 monthly summary for Eglin Air Force Base (AFB) - KVPS and Duke Field - KEGI has been received and provided in the table below. The temperatures in the daily tables consists of numbers both in °F/°C. Data courtesy of Mr. David Biggar, Staff Meteorologist, 96th Weather Squadron. Provided by permission.
|
|
|
|
|
|
January 2024 Climatology, Seasonal Climatology and Outlooks:
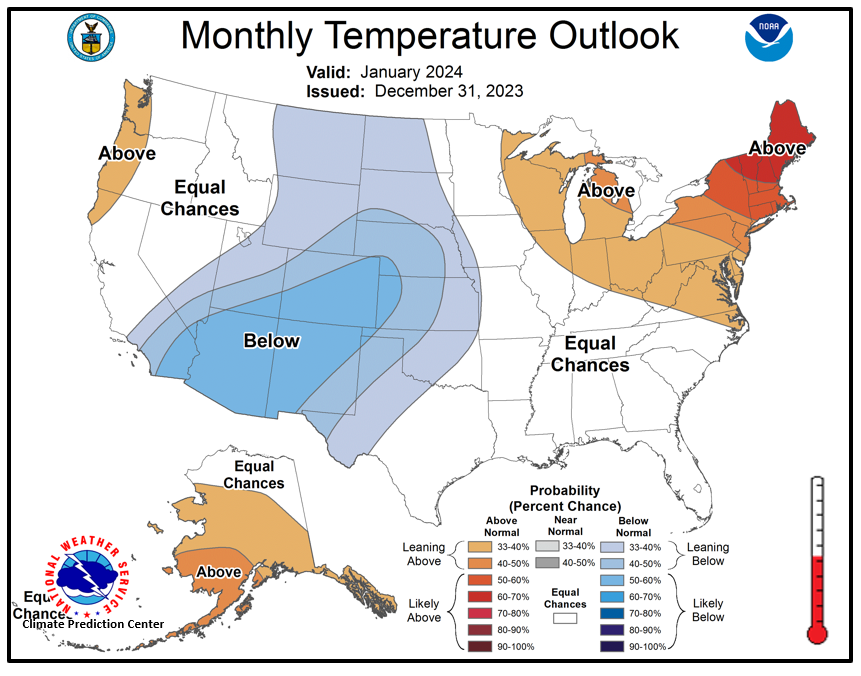
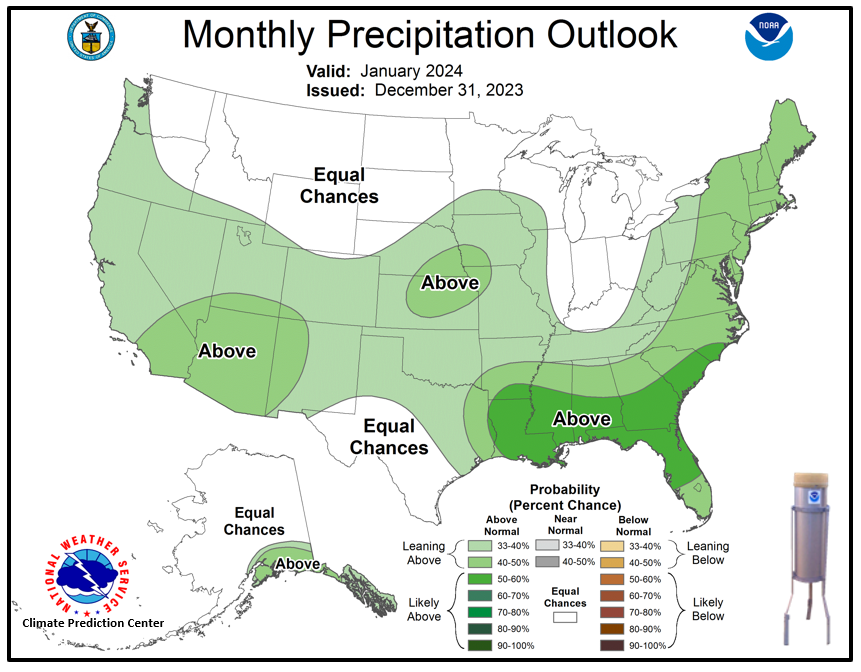
The latest outlook for January presents a pattern that favors equal chances of above or below temperatures over the southeast quarter of the country. With El Niño winter expected, the southern stream looks to become more active, favoring precipitation to be likely above normal from Louisiana, eastward across the southeast US coast. The monthly and seasonal drought outlooks call for drought to end over the central Gulf coast.
Click on the snap shots below to expand:
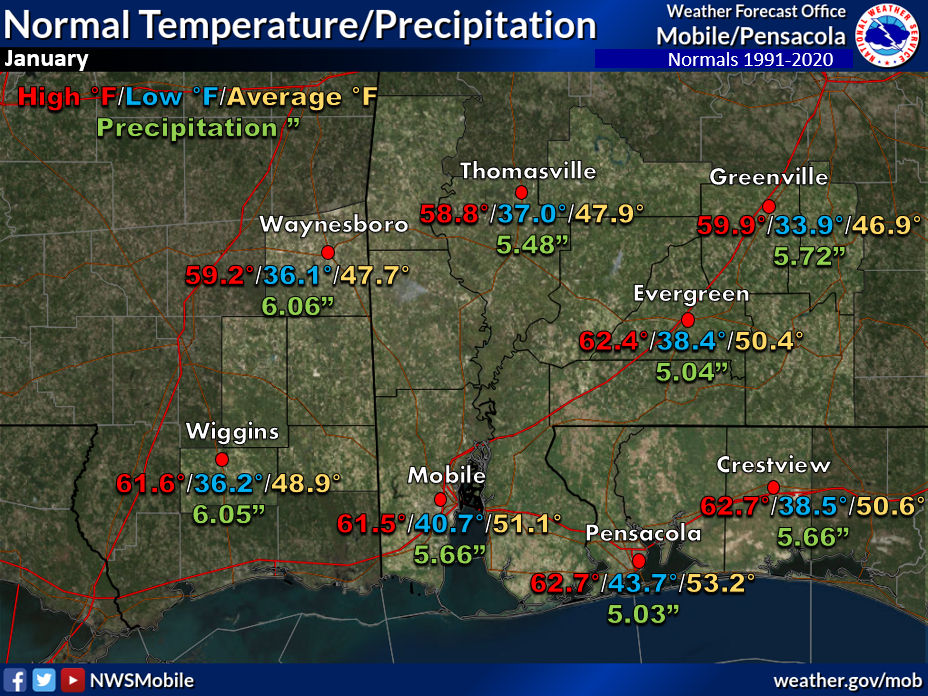 January Normals January Normals |
|
Outlook |
|
|
Additional Climate Links:
The National Weather Service Mobile Alabama's Climate and Past Weather page provides climate data at your fingertips for many observation points in the local forecast area by accessing the NOWData tab as well as many other climate resources. The Climate Prediction Center Link provides short and longer range climatic outlooks and education about the larger scale global circulations that impact temperatures and weather. With the large agriculture and farming presence along the central Gulf coast, the Drought Monitor link provides updates on drought trends and impacts. Another very helpful resource is the Community Collaborative Rain Hail and Snow (CoCoRaHS) network, which is a large group of volunteers working together to measure and map precipitation (rain, hail, and snow). The aim of CoCoRaHS is to provide the highest quality data for natural resource, education and research applications. You can be a part of the CoCoRaHS team by becoming a volunteer rainfall observer.