December 2025 Climate Summaries
(Including Annual ReCap)
Mobile Alabama and Pensacola Florida Area
National Weather Service Mobile Alabama
January 8, 2026
December 2025 in Review - There were lengthy periods of extremes about the means. For maximum temperatures, the month started off chilly at Mobile with highs in the 50's averaging 11.1° below normal for the first nine days of the month. Highs began to moderate thereafter. The longest duration of daily highs well above normal were from the 20th to 29th with numbers averaging 12.7° above normal during this late month span, before a brief cool down to end the month. An extended period of well below low temperatures occurred between the 9th and 16th when numbers averaged 8.5° below normal, warming dramatically following for the 21st to 28th averaging 14.4° above normal for the period.
At Pensacola, the month opened up with daily highs the first nine days coming in averaging 9.0° below normal. Highs began to moderate thereafter. The longest duration of daily highs well above normal were from the 20th to 28th with numbers averaging 10.1° above normal, before a brief cool down to end the month. The coldest lows occurred during the middle of the month and end of the month with the mornings of the 14th through the 16th and the 30th and 31st dipping down in the upper 20's and lower 30's, averaging 14.4° below normal on these mornings.
Despite these periods of extremes about the means, monthly average highs and lows ended very close to normal, within a degree or less. Only one record temperature was reached with Christmas day's high at Pensacola matching a record high with three other years.
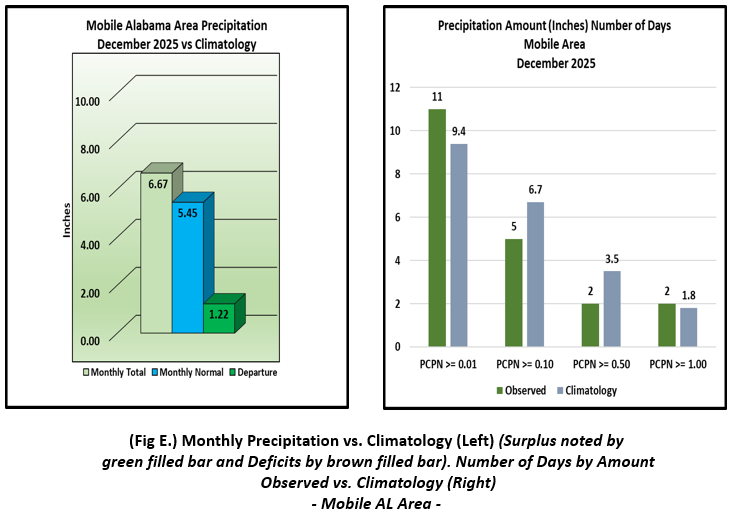
Over a half foot of rain was measured in the rain gauge at Mobile and surpassing the monthly normal by over an inch. Nearly half of rainfall total in Mobile occurred on the 1st when over three inches set a new daily record. In Pensacola, it was a different story as monthly rains fell just short of normal.
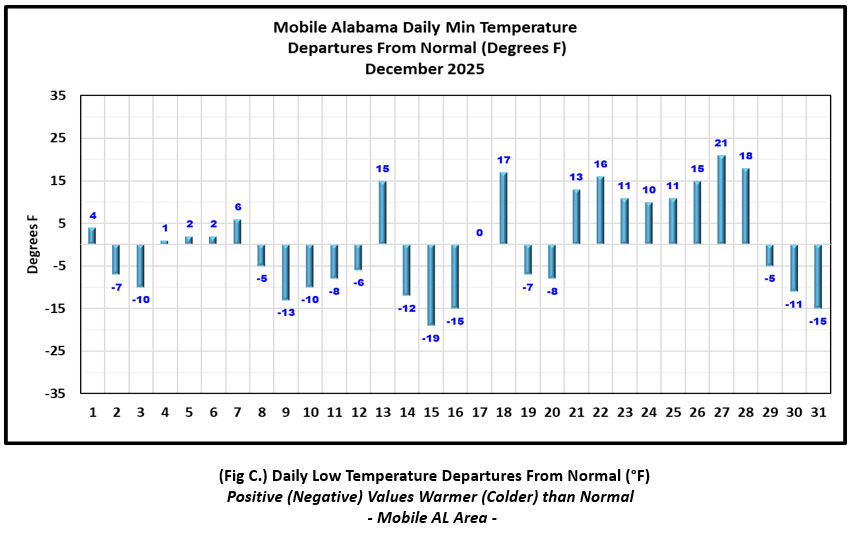
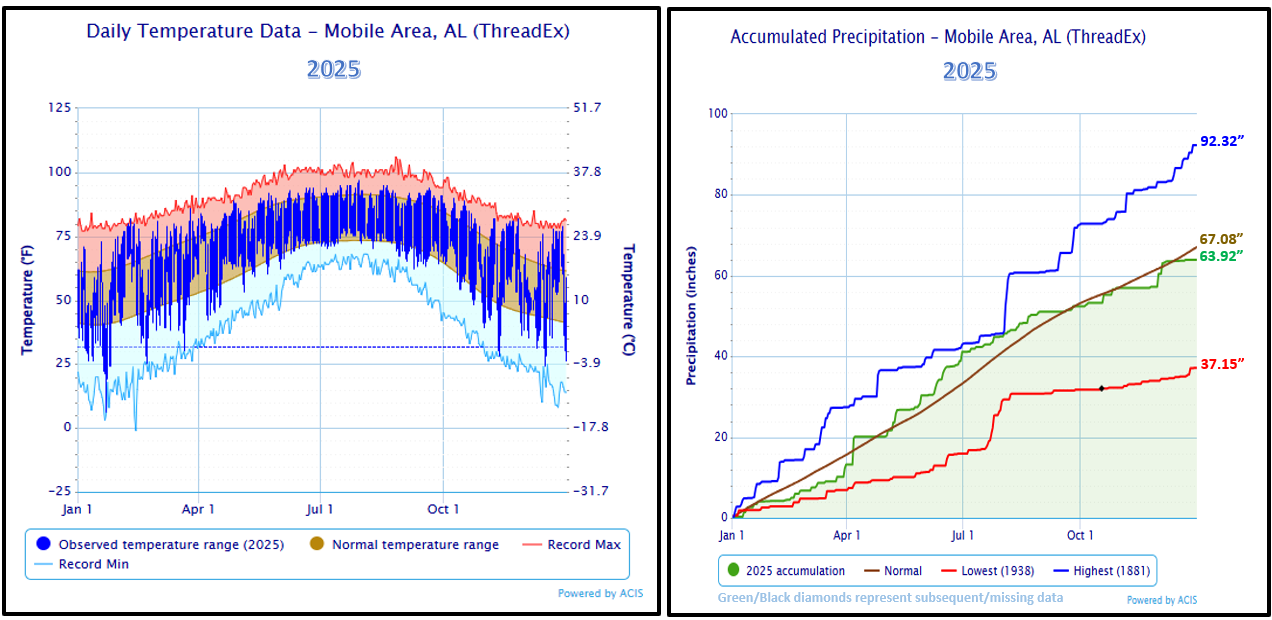
Mobile Alabama Area [Climate Normal Period 1991-2020, Climate Record Period 1872 to Present]- The average monthly high of 64.5° was 1.0° above normal. The average monthly low was 43.4° or 0.4° above normal. The average monthly temperature of 54.0° was 0.7° above normal. The highest temperature for the month, 79°, occurred on the 28th and was 17° above the normal for the date. The lowest temperature occurred on the morning of the 15th, plunging to 24° and 19° below normal for the day. No record temperatures were reached at Mobile. (Fig. A) shows a graphical representation of how the Mobile area temperatures compared to the monthly normal daily highs and lows, which are shown by the colored dashed lines. Bar graphs reflecting the daily high/low temperature departures from normal are provided in (Figs. B and C). The rain gauge collected over a half foot of rain at 6.67" for the month (Fig. D), or 1.22" above normal. Nearly half of the monthly rain, 48.2%, occurred on December 1st, when 3.22" fell, setting a new record for highest daily rainfall for the date. This surpassed the previous record of 2.26" set on this date back in 1996.
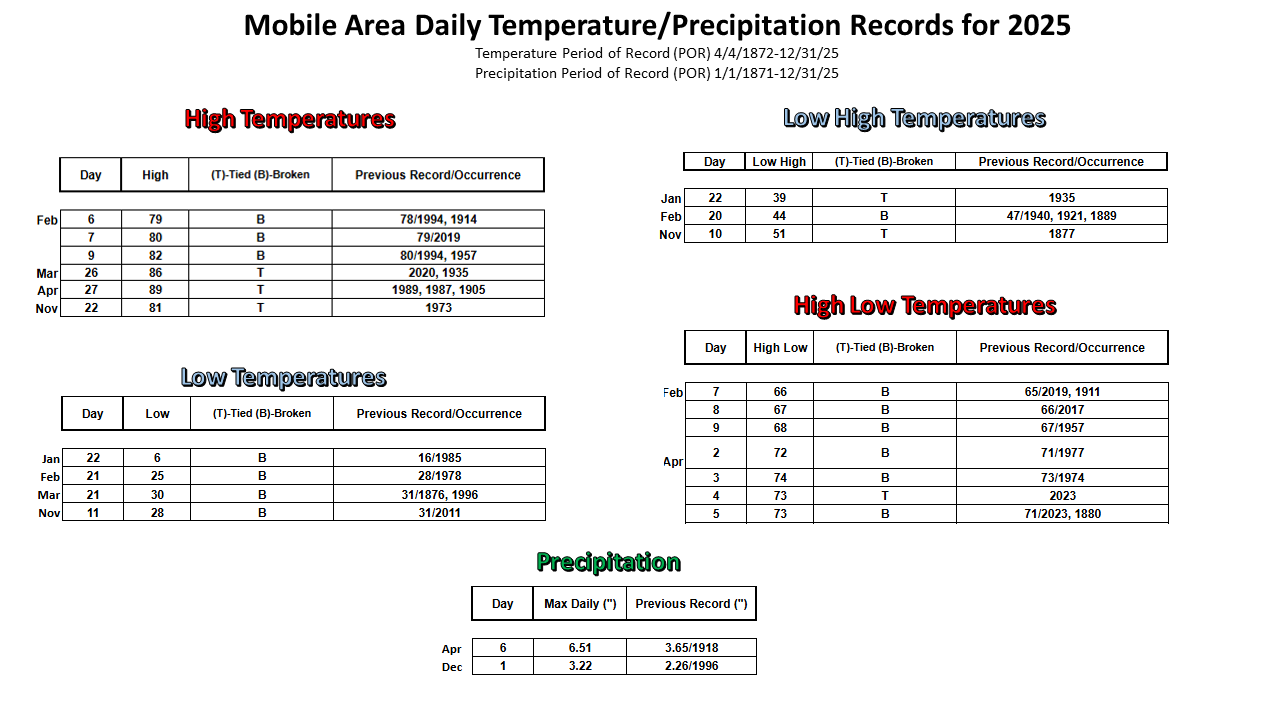
December Top Records for the Month During the Period of Record for the Mobile Area:
Click on the Mobile Alabama area climate graphics below to expand:

|

|
|
|
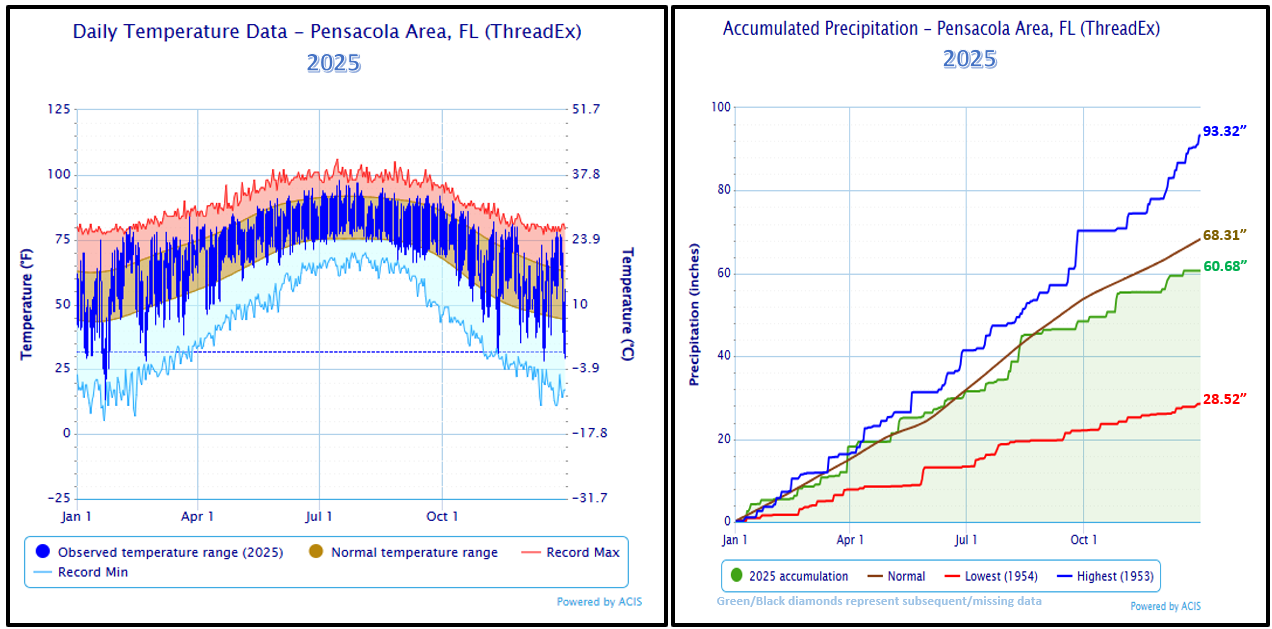
Pensacola Florida Area [Climate Normal Period 1991-2020, Climate Record Period 1879 to Present] - The average monthly high of 64.8° was 0.3° below normal. The average monthly low was 45.9° was right at normal. The average monthly temperature of 55.3° was 0.2° below normal. The highest temperature for the month, 78°, occurred on Christmas Day which was a day of record warmth for the Pensacola area and 14° above the normal for the date. This tied the record with three other years for the day, in 2023, 1974 and 1955. The lowest temperature occurred on the morning of the 15th with a cold 28° and 18° below normal for the date. (Fig. F) shows a graphical representation of how the Pensacola area temperatures compared to the seasonal normal daily highs and lows, which are shown by the colored dashed lines. (Figs. G and H) shows the daily high/low temperature departures from normal. The rain gauge collected 5.21" for the month (Fig. I) and just shy of reaching normal by 0.19" for the month.
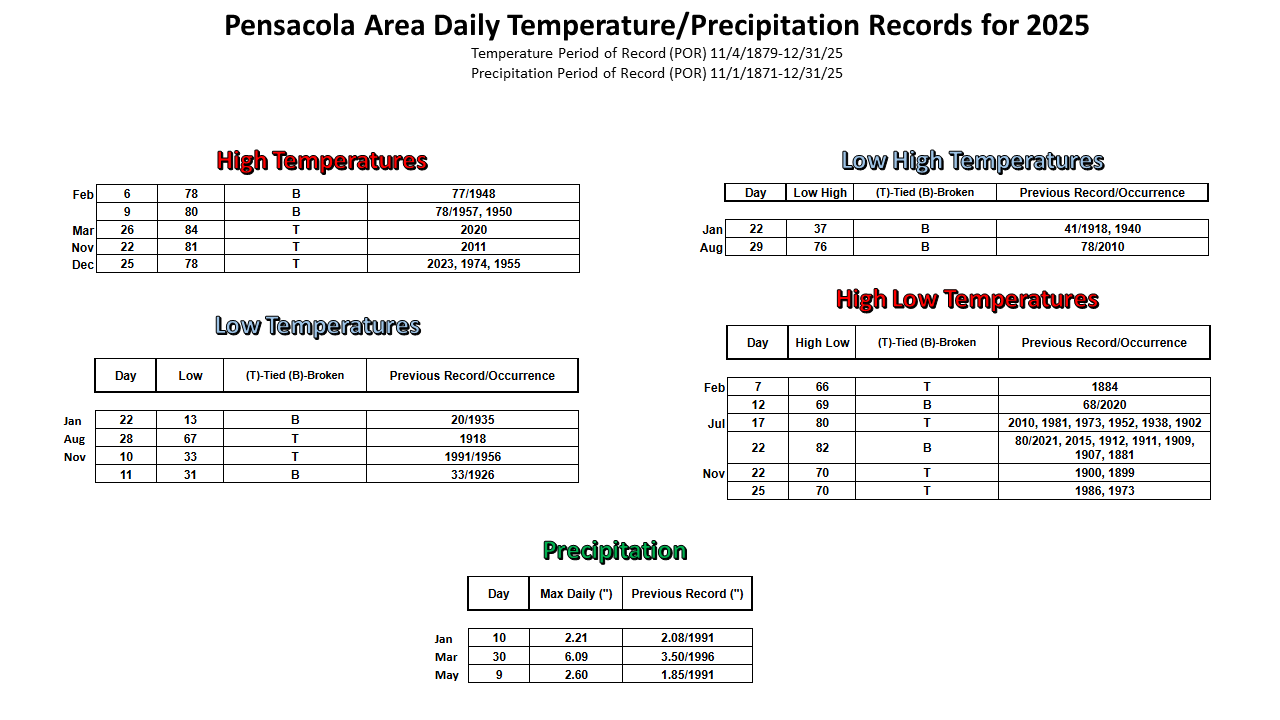
December Top Records for the Month During the Period of Record for the Pensacola Area:
Click on the Pensacola Florida area climate graphics below to expand:

|

|

|

|
Additional December 2025 Climatology and Topics:
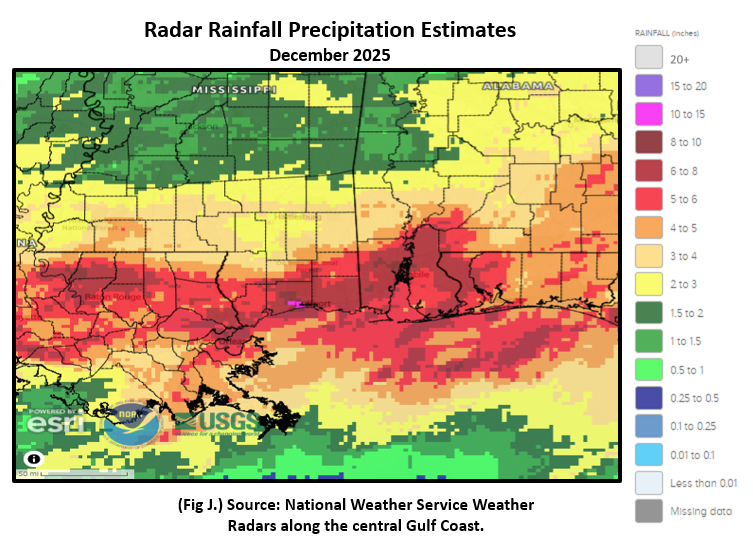
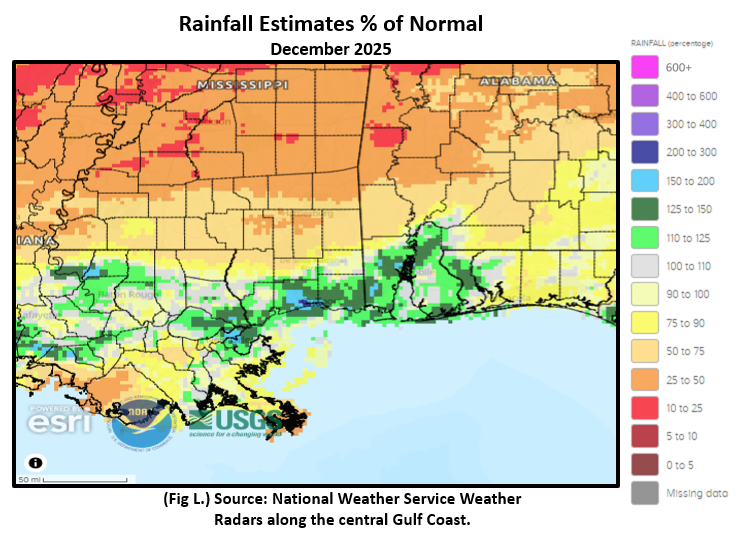
The focus of the heaviest rain was along coastal southwest Alabama and portions of the northwest Florida Panhandle with rainfall amounts adding up to 5 to 8 inches or 125 to 150% of normal over these areas. North of the interstate, rainfall over the interior was in much shorter supply with more significant deficits. Fig. J shows the areal monthly rainfall total, Fig. K shows the areal rainfall departures from normal and Fig. L, the areal percent of normal rainfall.
|

|
|
2025 (The Year in Review):
Mobile: The top weather event for 2025, from a climate perspective, was the January 21st Historic Central Gulf Coast Snowstorm that dumped record breaking snows over many areas across the central Gulf coast. The maximum one-day snowfall totals at Mobile ending January 21st was 7.5" breaking a 144 year old one-day record of 5.0" from way back in 1881, close to when weather records began.
20 record daily temperatures were reached. Of the records, six were record highs, four were record lows, three were record low highs, and seven were record high lows. Here are some notable temperature factoids. The low cratered to 6° on the morning of January 22nd and ties for the third coldest low temperature on record with the other occurrence from February 12th, 1899. On the flip side as we closed out the year, the Fall season's average high of 81.5° was seventh warmest on record.
Annual rainfall 63.92" ended the year in deficit by a few inches at 3.16" below normal. The driest month was November when the rain gauge collected a meager 0.26"; November 2025 stands as the fourth driest November's on record. The wettest month was June at 10.75". Two days saw new record one-day total precipitation. April 6th at 6.51" and December 1st at 3.22".
______________________________________________
Pensacola: The one-day snowstorm accumulations ending January 21st rose to a staggering 8.9", smashing the previous record of 2.3" which has stood tall for over 70 years occurring in 1954. The NWS Mobile COOP site in Ferry Pass Florida saw 10" of snow and setting a new top record snowfall for the state of Florida.
17 record daily temperatures were reached. Of the records, five were record highs, four were record lows, two were record low highs, and six were record high lows. Here are some notable temperature factoids. A longest run of low temperatures less than 32° moved into the top four at seven days of consecutive occurrence ending January 25th. July broke into the top 10 warmest months at number nine when the temperature averaged 84.8°.
Pensacola's rainfall 60.68" ended the year in deficit by several inches at 7.63" below normal. The driest month was November with only a scant 0.08" collected in the gauge; November 2025 stands as the top driest November's on record edging out 0.09" set in 2017. Three days saw new record one-day total rainfall. January 10th at 2.21", March 30th at 6.09", and May 9th at 2.60"
_______________________________________________
Below are graphics showing the annual daily temperature and precipitation accumulation for 2025, monthly average temperatures and total precipitation against climatology, daily, and a detailed listing of annual, monthly and seasonal records. The daily record tables indicate whether they were broken or tied.
2025 Temperature/ Precipitation and Records:
|
|

|

|
|
|

|

|
2025 Drought: The first quarter of the year, drought began to decline but returned in August. Moderate to severe drought worsened and expanded in areal coverage over the NWS Mobile/Pensacola forecast area of responsibility (AoR) as we entered the Fall months. A portion of the area during this time saw some extreme drought conditions. Local Drought History: Click=> NWS Mobile/Pensacola AoR Interactive Historical Drought Information, to view additional details on local drought since 2000.

2025 Severe Weather/Hurricanes: At present, the official severe storm event database indicates the occurrence of 81 severe weather events in total impacting the National Weather Service (NWS) Mobile County Warning Area (CWA). This total includes 19 tornadoes, 46 wind events greater than 50 knots, and 16 hail reports greater than 1.00" in diameter.
Here is the break-out by EF-Tornado Scale occurrences - EF0: 5, EF1: 10, EF2: 3, EF3: 1, EF4: 0, EF5: 0.
EF0, EF2, and EF3 counts were close to the normal number of annual occurrence with EF1 occurrences about 2x the typical number of occurrences.
For details on tornado surveys and other high impact weather events, please refer to the NWS Mobile's Past Significant Weather Events link.
13 named tropical cyclones formed. Of the 13, Tropical Storm Barry was the only one to form in the Gulf, over the Bay of Campeche at the end of June. Although the season fell within NOAA's predicted ranges, there were striking contrasts. Click: NOAA's press release for the details.
 |
 |
January 2026 Climatology, Seasonal Climatology and Outlooks:
The latest outlook for January presents a pattern that leans above normal in temperatures over the southern U.S. and below normal precipitation over the southeast U.S. The longer range drought outlooks call for drought to persist over the central Gulf coast.
Click on the snap shots below to expand:
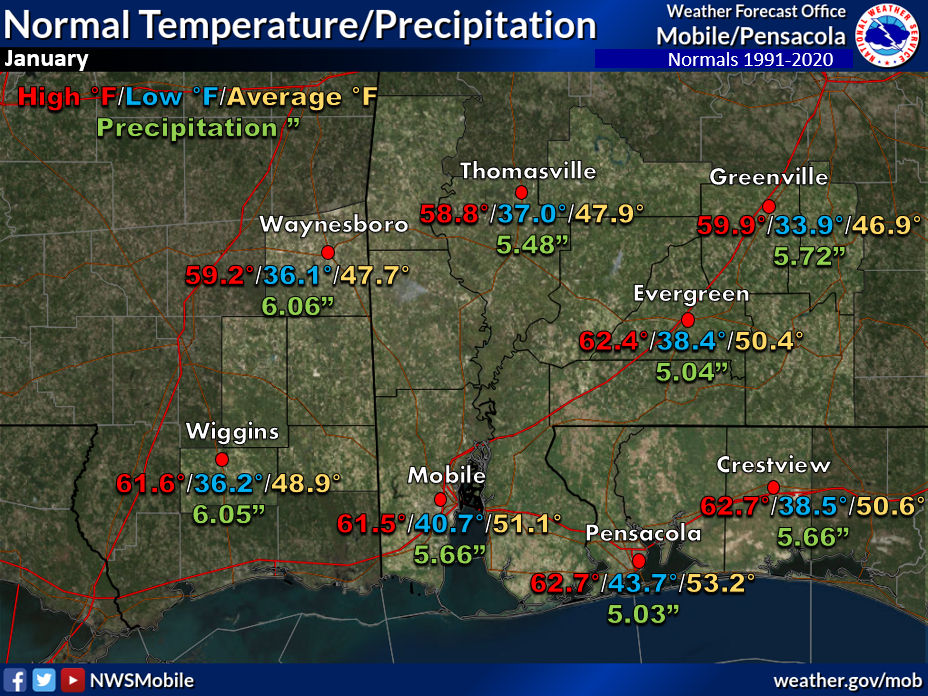 January Normals January Normals |

|
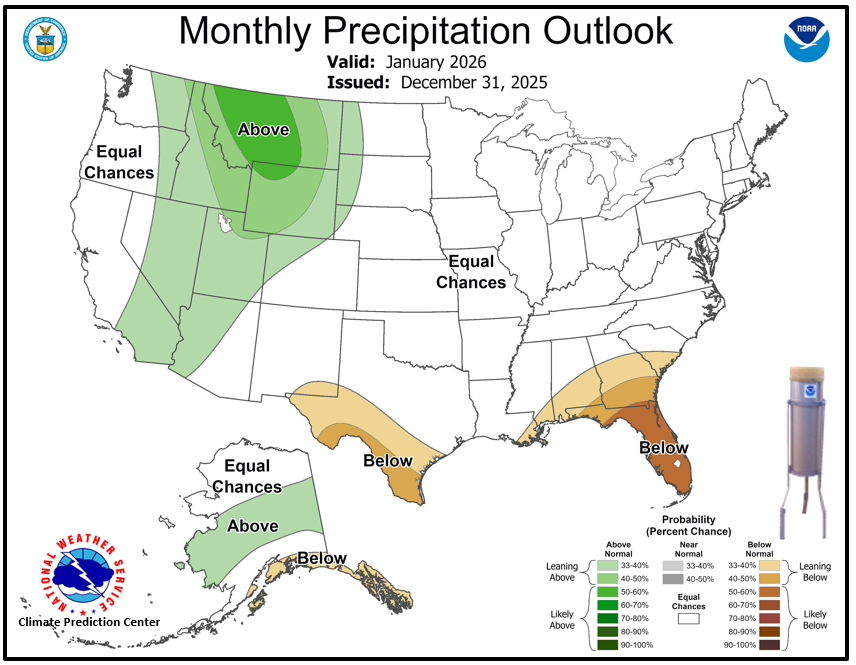
Outlook |
|
|
Additional Climate Links:
The National Weather Service Mobile Alabama's Climate and Past Weather page provides climate data at your fingertips for many observation points in the local forecast area by accessing the NOWData tab as well as many other climate resources. The Climate Prediction Center Link provides short and longer range climatic outlooks and education about the larger scale global circulations that impact temperatures and weather. With the large agriculture and farming presence along the central Gulf coast, the Drought Monitor link provides updates on drought trends and impacts. Another very helpful resource is the Community Collaborative Rain Hail and Snow (CoCoRaHS) network, which is a large group of volunteers working together to measure and map precipitation (rain, hail, and snow). The aim of CoCoRaHS is to provide the highest quality data for natural resource, education and research applications. You can be a part of the CoCoRaHS team by becoming a volunteer rainfall observer.