January 2022 Climate Summaries
Mobile Alabama and Pensacola Florida Area
National Weather Service Mobile Alabama
February 3, 2022
January 2022 in Review - Anomalously warm daytime temperatures opened up the first half of the month overall then trended lower overall the latter half, enough so that the average high was slightly below normal. Following the first morning of January seeing lows near 30 degrees above normal, more January like conditions followed the remainder of the month. Monthly lows trended 3 to 5 degrees below normal on average. Temperatures averaged a few degrees below normal. The only records were observed to occur the first couple days of the month. One record high and one record high low at both Mobile and Pensacola.
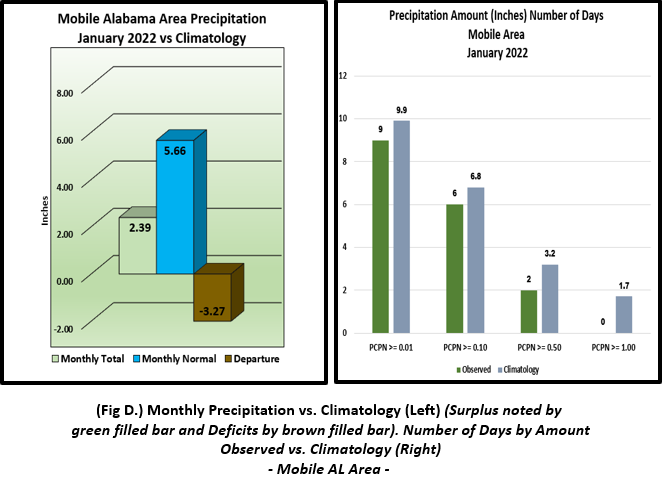
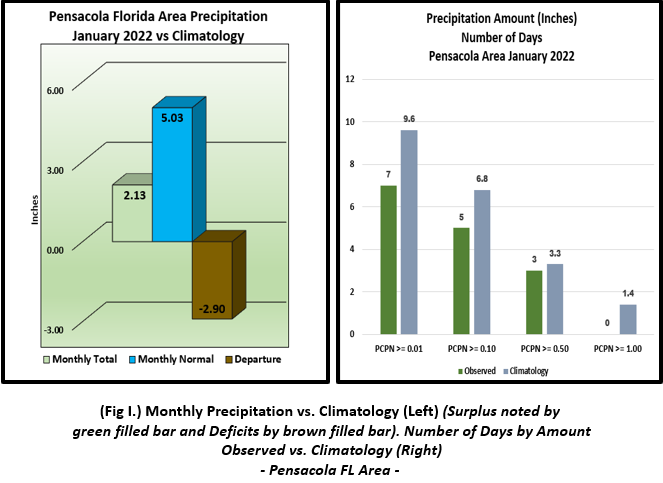
Rainfall fell short of normal a few inches at both Mobile and Pensacola.
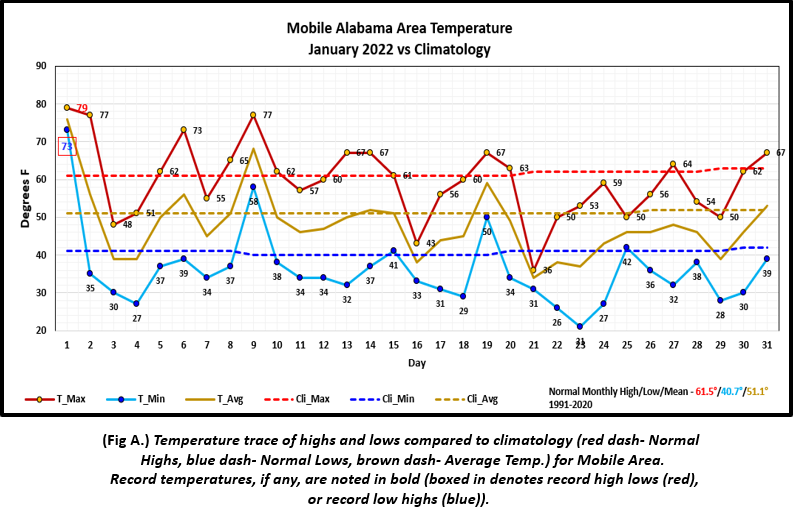
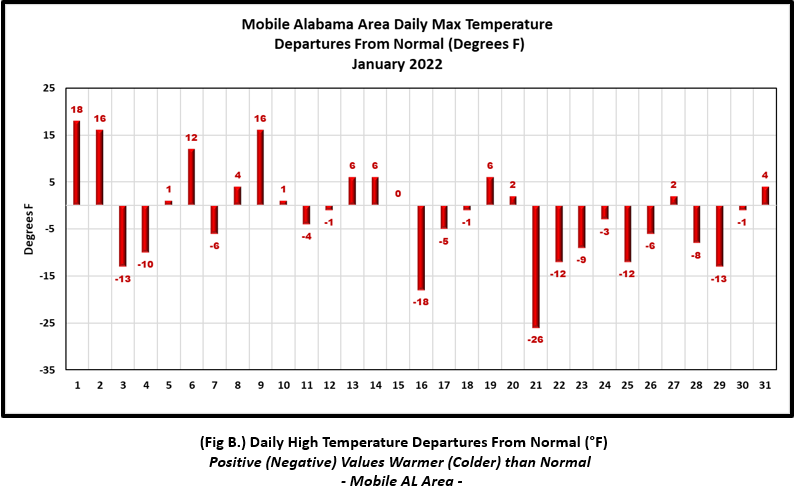
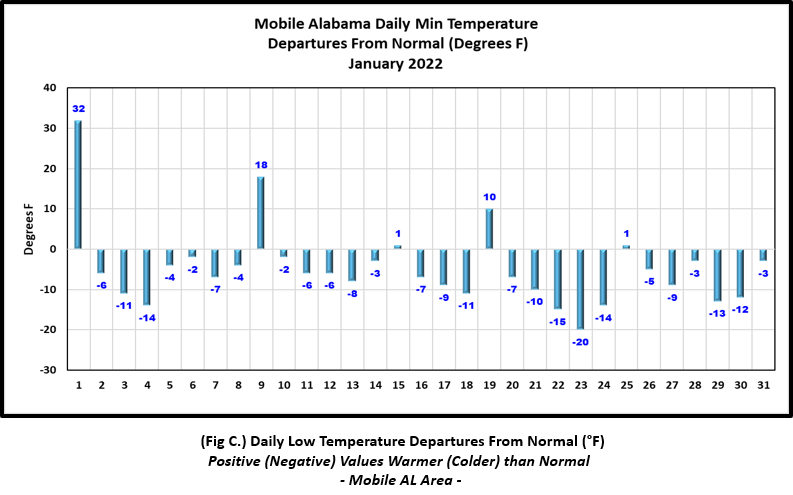
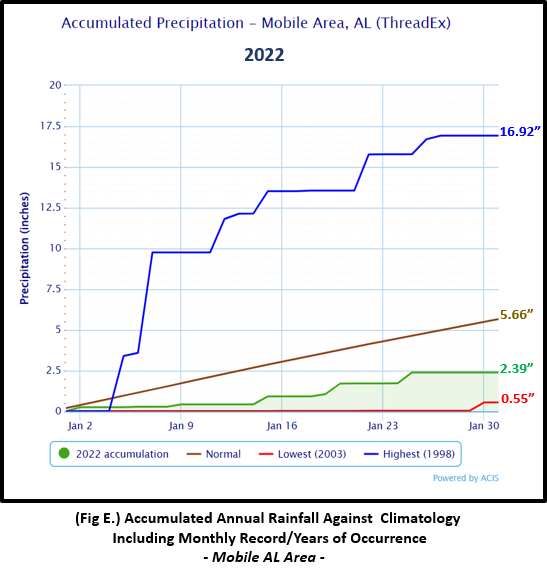
Mobile Alabama Area [Climate Normal Period 1991-2020, Climate Record Period 1872 to Present]- The average monthly high of 59.7° was 1.8° below normal. The average monthly low was 35.9° or 4.8° below normal. The average monthly temperature of 47.8° was 3.3° below normal. It was a record setting first day of the month. The highest temperature for the month, 79°, occurred on the 1st, 18° above the normal for the date. This was also a record high which tied the previous record on this date set back in 1979. The morning low on the 1st, 73°, set a new record high low temperature. The previous record high low on this date was 67°, set way back in 1876. The lowest temperature for the month plunged to 23° on the morning of the 23rd, 20° below normal for this date. (Fig. A) shows a graphical representation of how the Mobile area temperatures compared to the seasonal normal daily highs and lows, which are shown by the colored dashed lines. Bar graphs reflecting the daily high/low temperature departures from normal are provided in the table below (Figs. B and C). The rain gauge collected a 2.39" (Fig. D), or 3.27" below normal. Accumulated rainfall climatology for Mobile thus far is provided in (Fig. E).
January Top Records for the Month During the Period of Record for the Mobile Area:
Click on the Mobile Alabama area climate graphics below to expand:
|
|
|
|
|
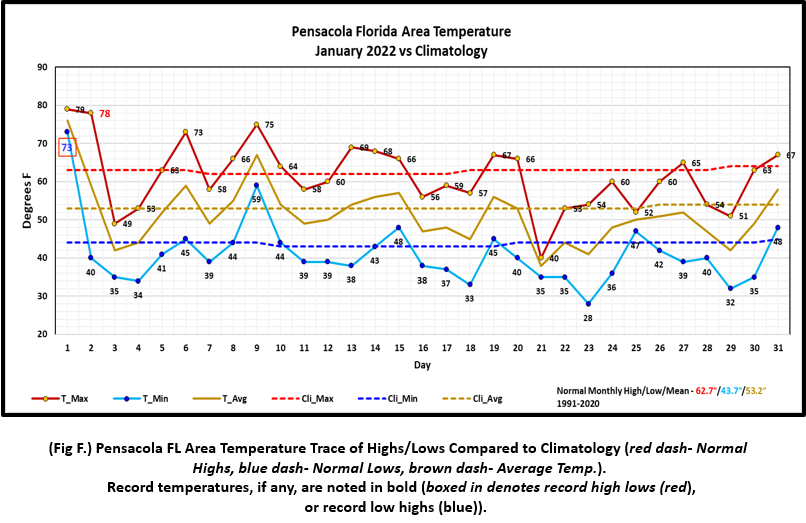
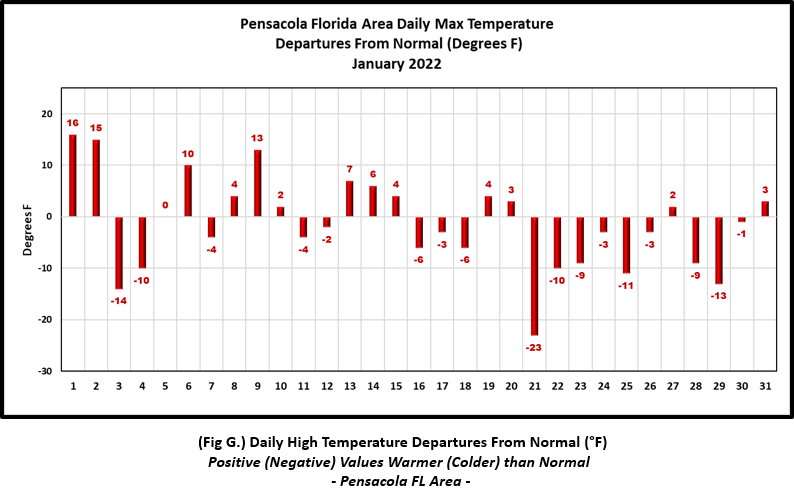
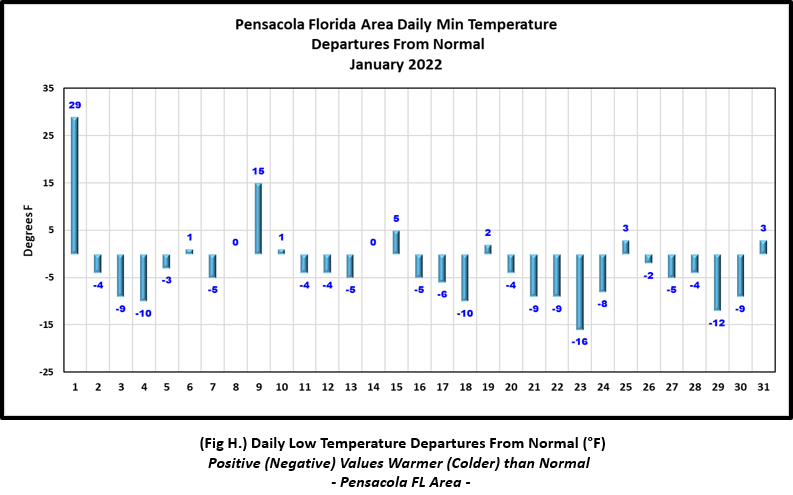
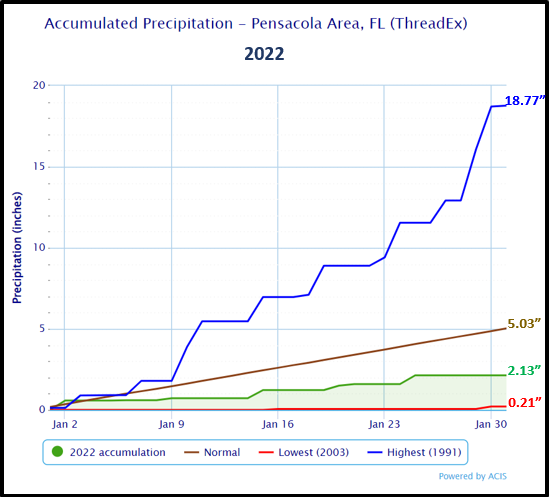
Pensacola Florida Area [Climate Normal Period 1991-2020, Climate Record Period 1879 to Present] - The average monthly high of 61.4° was 1.3° below normal. The average monthly low was 41.0° or 2.7° below normal. The average monthly temperature of 51.2° was 2.0° below normal. The highest temperature for the month, 79°, occurred on the 1st, 16° above the normal for the date. The morning low on the 1st, 73°, reached a new record high low temperature on this date, smashing the previous record of 68° set in 2019. The high on the 2nd, 78°, broke the previous record of 77° set on this date back in 2006 and 1966. The lowest temperature for the month plunged to 28° on the morning of the 23rd, 16° below normal for this date. (Fig. F) shows a graphical representation of how the Pensacola area temperatures compared to the seasonal normal daily highs and lows, which are shown by the colored dashed lines. (Figs. G and H) shows the daily high/low temperature departures from normal. The rain gauge collected 2.13" (Fig. I), 2.90" below the monthly normal. Accumulated rainfall climatology for Pensacola thus far is provided in (Fig. J).
January Top Records for the Month During the Period of Record for the Pensacola Area:
Click on the Pensacola Florida area climate graphics below to expand:
|
|
|
|
|
Additional January 2022 Climatology and Topics
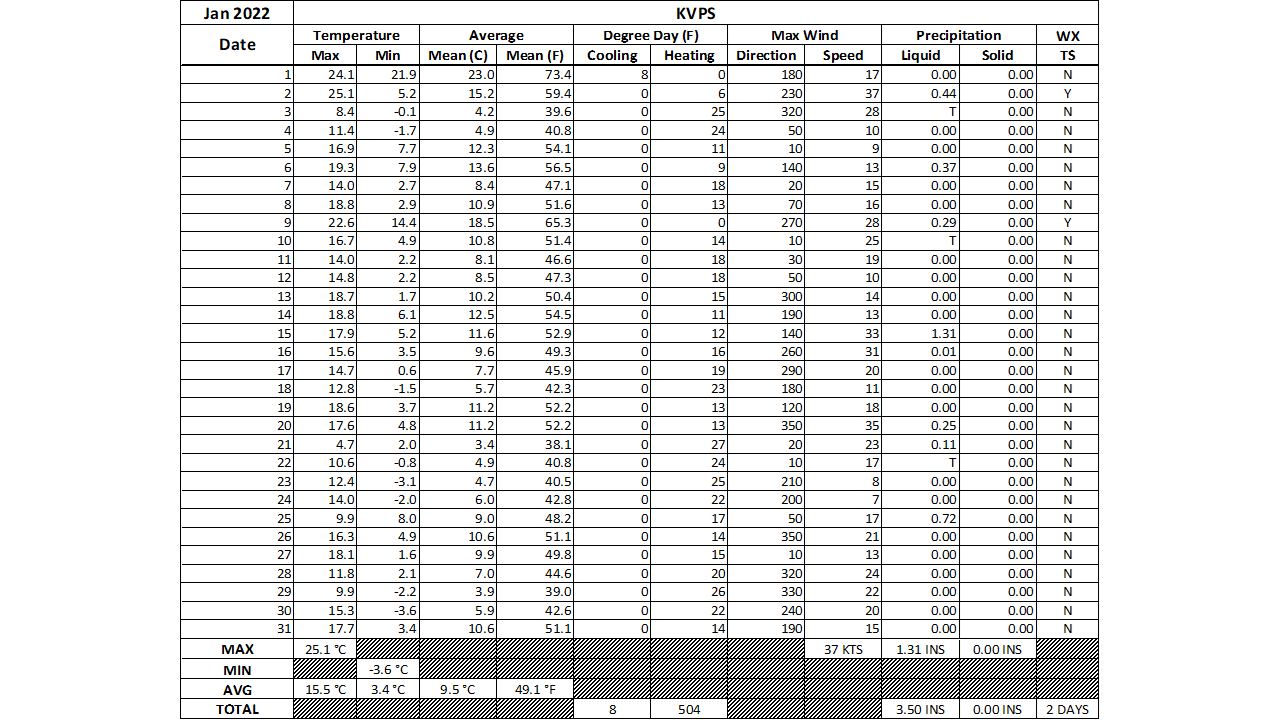
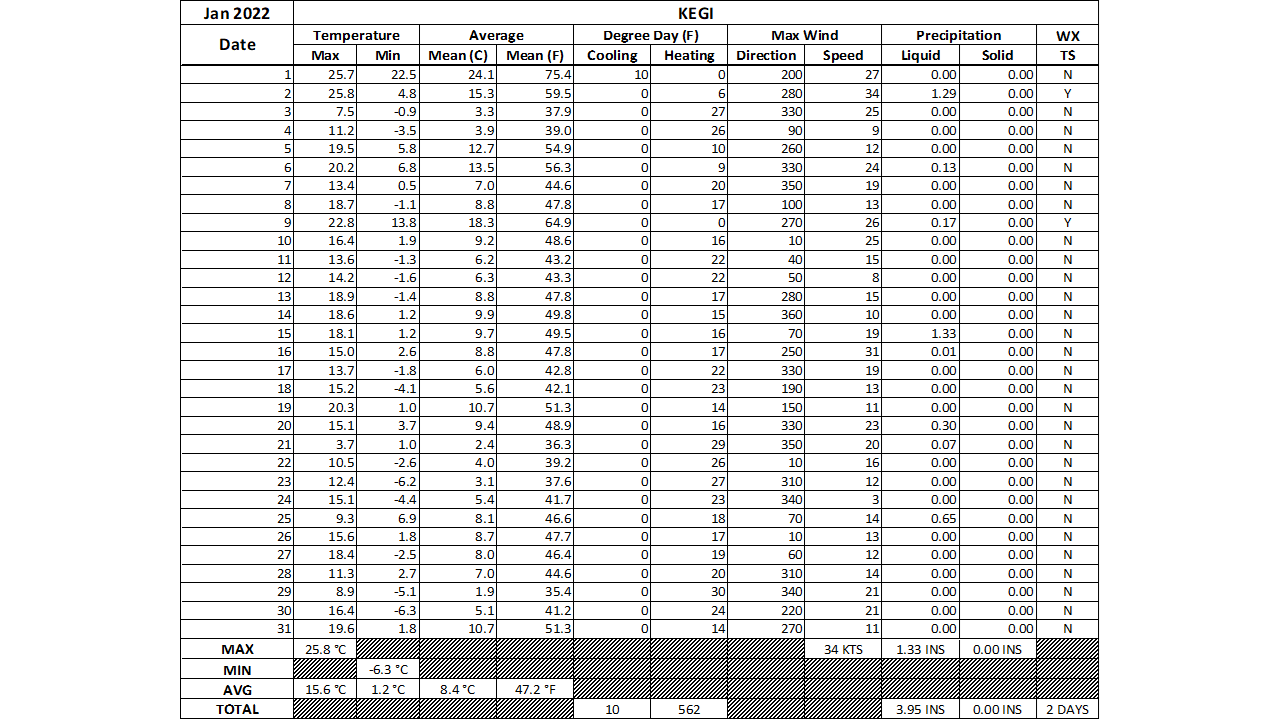
The latest January 2022 monthly summary for Eglin Air Force Base (AFB) - KVPS and Duke Field - KEGI has been received and provided in the table below. The temperatures in the daily tables consists of numbers both in °F/°C. Data courtesy of Mr. David Biggar, Staff Meteorologist, 96th Weather Squadron. Provided by permission.
|
|
|
February 2022 Climatology, Seasonal Climatology and Outlooks:
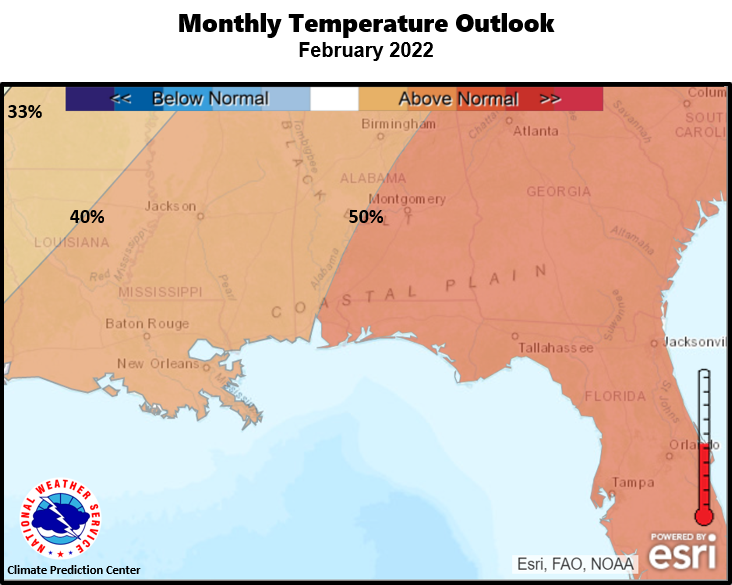
The latest outlook for February favors temperatures to be likely above normal and equal chances of precipitation being above or below normal. With the lack of rainfall during the month of January, abnormal dryness has expanded over the coastal Plain with moderate drought conditions along the I-10 corridor and over portions of interior southeast MS and southwest AL. Even so, there are indications of some improvement in the February 2022 outlook.
Click on the snap shots below to expand:
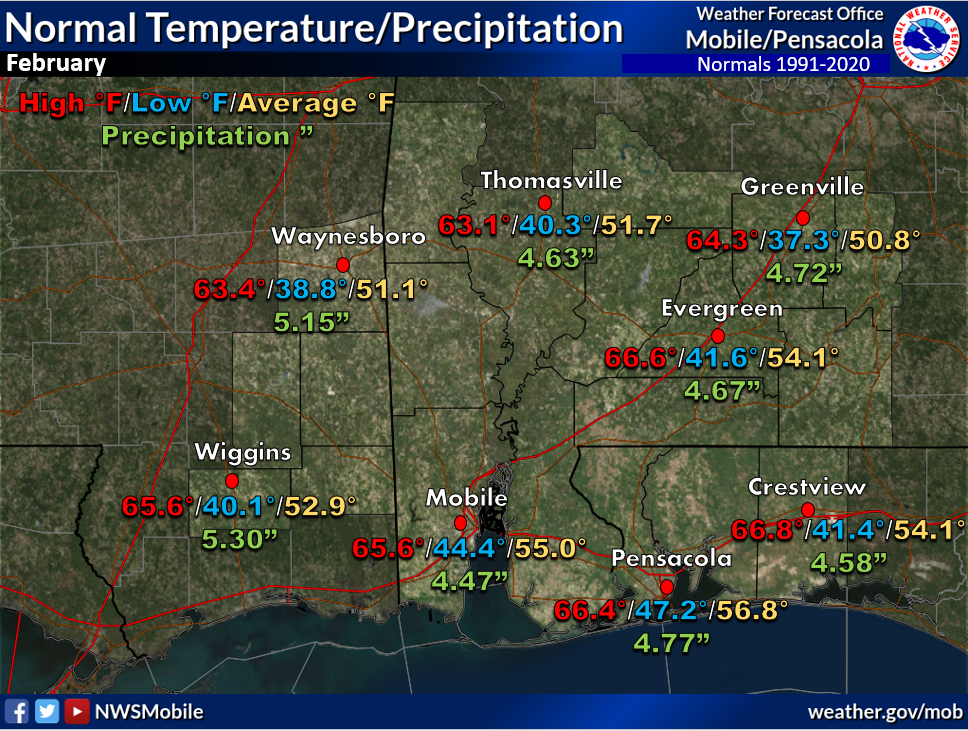 February Normals February Normals |
|
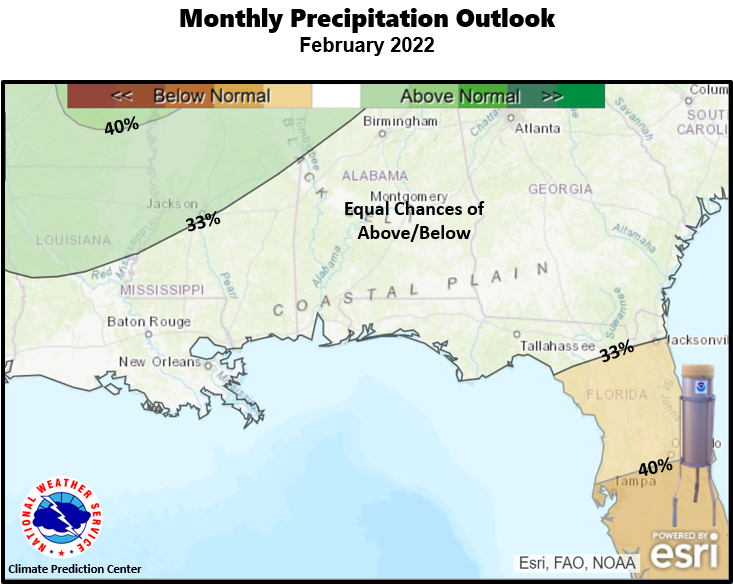
Outlook |

|
|
Additional Climate Links:
The links below are intended to provide additional climate information, education and outlooks. The National Weather Service Mobile Alabama's Climate and Past Weather page provides climate data at your fingertips for many observation points in the local forecast area by accessing the NOWData tab as well as many other climate resources. The Climate Prediction Center Link provides short and longer range climatic outlooks and education about the larger scale global circulations that impact temperatures and weather. With the large agriculture and farming presence along the central Gulf coast, the Drought Monitor link provides updates on drought trends and impacts. Another very helpful resource is the Community Collaborative Rain Hail and Snow (CoCoRaHS) network, which is a large group of volunteers working together to measure and map precipitation (rain, hail and snow). The aim of CoCoRaHS is to provide the highest quality data for natural resource, education and research applications. You can be a part of the CoCoRaHS team by becoming a volunteer rainfall observer. To learn more click on the CoCoRaHS link below.
National Weather Service Mobile AL Climate and Past Weather
Climate Prediction Center (CPC)
CoCoRaHS Network Water Year Summaries
![]()