January 2026 Climate Summaries
Mobile Alabama and Pensacola Florida Area
National Weather Service Mobile Alabama
February 2, 2026
January 2026 in Review - The month began on the warm side when comparing both normal January high and low temperatures. Daytime highs averaged 12.3° above normal and lows averaged 13.3° above normal at Mobile for the 1st through the 10th. For the same span, Pensacola averaged 9.5° above normal for highs and lows averaged 12.5° above normal. During this warm period, Mobile saw two new record high temperatures and one record high low temperature being tied. Pensacola saw one new record high. Following, temperatures cooled off to what we expect in January the middle of the month before more oscillation took place, warm against the averages to open up the latter third of the month and colder to close out the month. During this period, the most notable extremes against climatology occurred the 26th to the 31st, when highs averaged 11.8° below normal and lows 15.7° below normal at Mobile. For the same period, highs averaged 12.2° below normal and lows 16.0° below normal at Pensacola. Overall, average monthly temperatures were very close to January normal at Mobile and Pensacola.
2026 started off in deficit on rainfall collection.
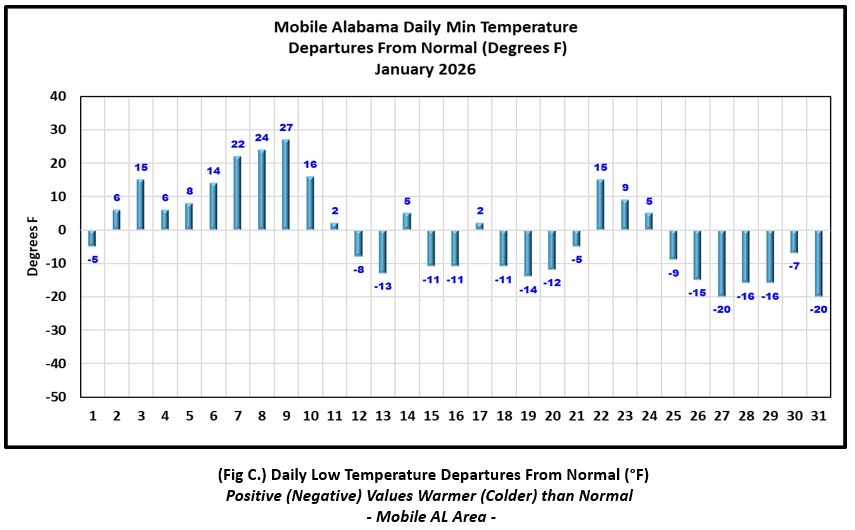
Mobile Alabama Area [Climate Normal Period 1991-2020, Climate Record Period 1872 to Present]- The average monthly high of 63.2° was 1.7° above normal. The average monthly low was 40.2° or 0.5° below normal. The average monthly temperature of 51.7° was 0.6° above normal. The 8th and 9th saw the highest temperatures for the month at 79°, 18° above normal for these two days. In fact, both days set a new record daily high. The previous record high on the 8th was 77° in 1939 and on the 9th, 78° in 1957. The third record was a record high low temperature on the morning of the 9th, 67°, matching the previous record on this date in 1974. The lowest temperature for the month dipped to 21° on the morning of the 27th, 20° below normal for the date. (Fig. A) shows a graphical representation of how the Mobile area temperatures compared to the seasonal normal daily highs and lows, which are shown by the colored dashed lines. Bar graphs reflecting the daily high/low temperature departures from normal are provided in the table below (Figs. B and C).
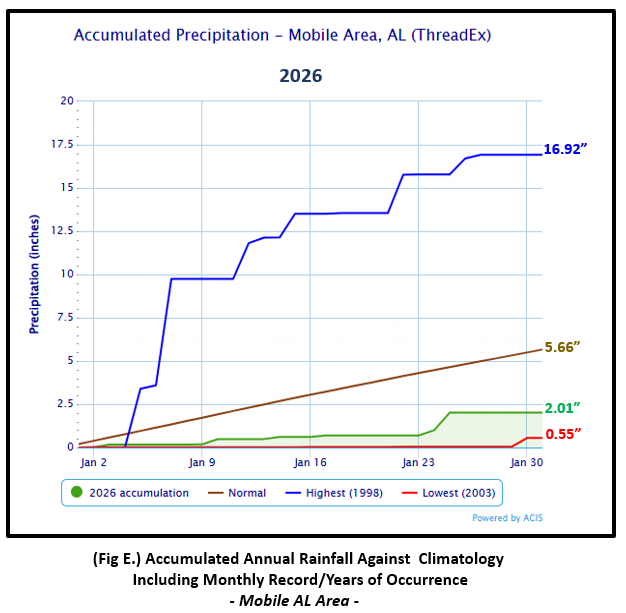
The rain gauge just a hair over two inches, 2.01" (Fig. D), or 3.65" below normal. Accumulated rainfall climatology for Mobile is provided in (Fig. E).
January Top Records for the Month During the Period of Record for the Mobile Area:
Click on the Mobile Alabama area climate graphics below to expand:

|

|
|

|
|
Pensacola Florida Area [Climate Normal Period 1991-2020, Climate Record Period 1879 to Present] - The average monthly high of 62.6° was 0.1° below normal. The average monthly low was 43.1° or 0.6° below normal. The average monthly temperature of 52.8° was 0.4° below normal. The highest temperature for the month was reached on the 10th at a toasty 80°, 18° above the normal for the date. This not only was just one degree shy of the all-time warmest daily January temperature, but it set a new daily record, breaking the last record highest temperature on this date of 79° in 1957. The lowest temperature for the month was a crisp 22° on the morning of the 27th and 22° below normal for the date. (Fig. F) shows a graphical representation of how the Pensacola area temperatures compared to the seasonal normal daily highs and lows, which are shown by the colored dashed lines. (Figs. G and H) shows the daily high/low temperature departures from normal.
The rain gauge collected 2.60" (Fig. I), 2.43" below the monthly normal. Accumulated rainfall climatology for Pensacola is provided in (Fig. J).
January Top Records for the Month During the Period of Record for the Pensacola Area:
Click on the Pensacola Florida area climate graphics below to expand:

|

|

|

|

|
Additional January 2026 Climatology and Topics
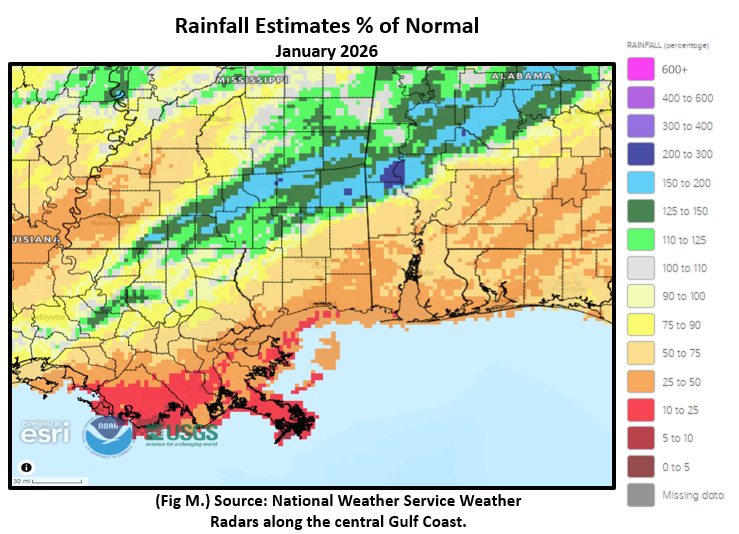
A notable southwest to northeast band of excessive rainfall was aligned from interior southeast Louisiana to central Alabama. It was in this area, where a sharp gradient, or difference existed between several inches of surplus to several inches of deficit. The highest monthly rainfall totals, upwards to over ten inches, were focused over much of Wayne Co. MS to across the Washington, Choctaw, Clarke Co. borders in Alabama where 150 to 300% of monthly January rains were focused. Much of the remainder of the area saw only 25 to 50% of normal rainfall. (Fig. K) shows the areal monthly rainfall total, (Fig. L) shows the areal rainfall departures from normal and (Fig. M), the areal percent of normal rainfall. Considering the placement of the heavier rainfall footprint, drought intensity did lower by the end of the month for those areas seeing excessive rains (Fig. N). Drought did not end entirely though.

|

|
|

|
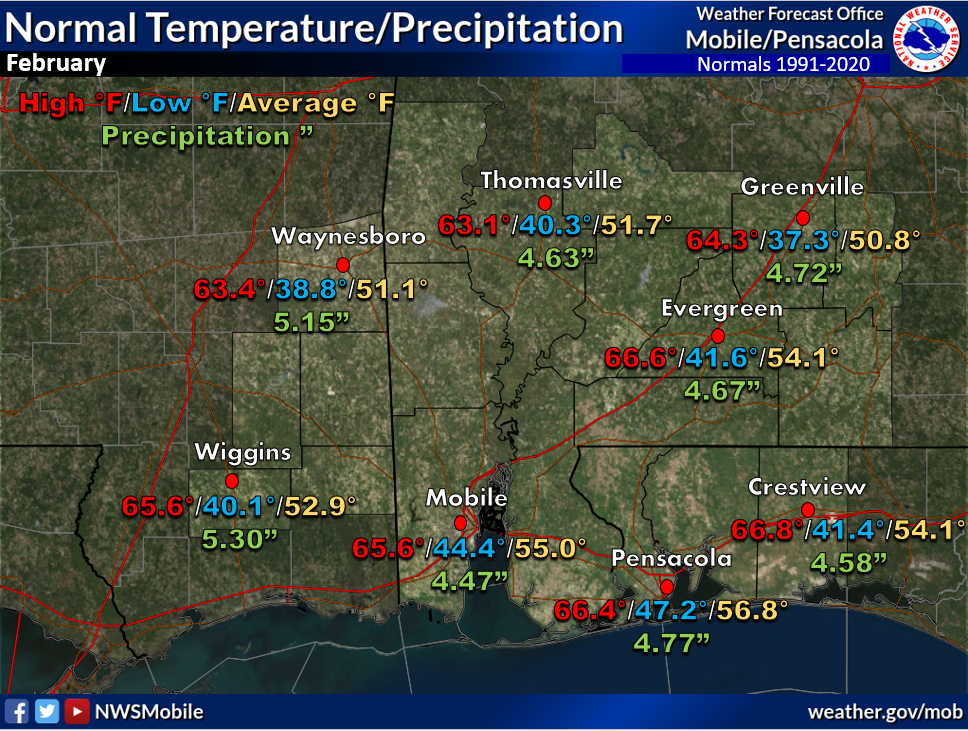
February 2026 Climatology, Seasonal Climatology and Outlooks:
The latest outlook for February favors temperatures to lean below normal over the northeast half of the continental U.S, including the central Gulf coast. The pattern favors precipitation to lean below normal from the central Gulf coast to the southeast. Drought conditions are expected to persist.
Click on the snap shots below to expand:
 February Normals February Normals |

|
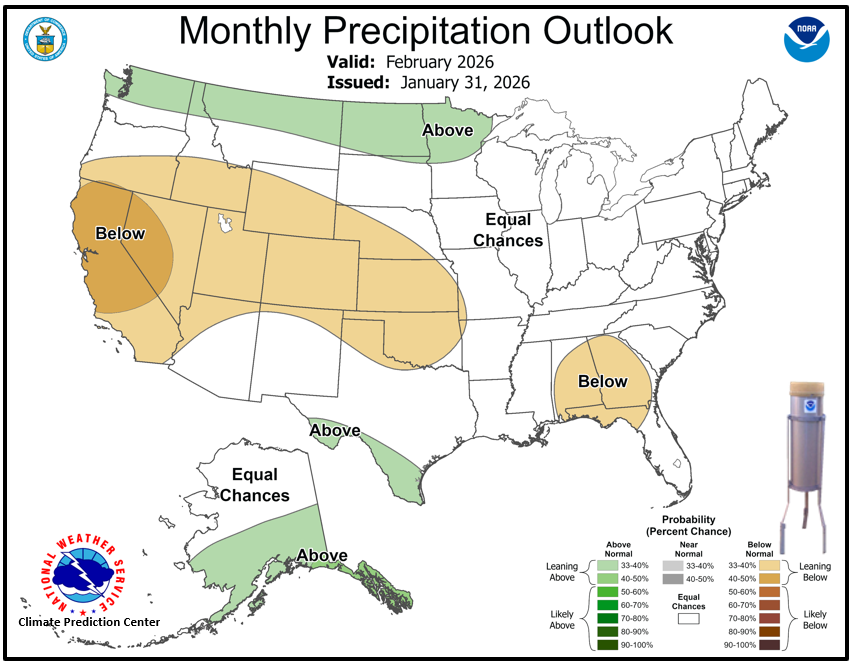
Outlook |
|
|
Additional Climate Links:
The National Weather Service Mobile Alabama's Climate and Past Weather page provides climate data at your fingertips for many observation points in the local forecast area by accessing the NOWData tab as well as many other climate resources. The Climate Prediction Center Link provides short and longer range climatic outlooks and education about the larger scale global circulations that impact temperatures and weather. With the large agriculture and farming presence along the central Gulf coast, the Drought Monitor link provides updates on drought trends and impacts. Another very helpful resource is the Community Collaborative Rain Hail and Snow (CoCoRaHS) network, which is a large group of volunteers working together to measure and map precipitation (rain, hail, and snow). The aim of CoCoRaHS is to provide the highest quality data for natural resource, education and research applications. You can be a part of the CoCoRaHS team by becoming a volunteer rainfall observer.