July 2023 Climate Summaries
Mobile Alabama and Pensacola Florida Area
National Weather Service Mobile Alabama
August 2, 2023
July 2023 in Review - Hot. Outside of only a couple wet and cloudy days which kept temperatures in check, the Mobile area saw 29 days where the mercury lifted to 90.0° or higher and well above the normal number days of occurrence at 22. 17 days climbed to 95.0° or higher. Average high temperatures broke into the top 5 warmest July's on record. The Pensacola area recorded 90.0° or higher on 27 days of the month, well above the normal number days of occurrence at 20. Average high temperatures at Pensacola also broke into the top 5 warmest July's on record. Considering the hot monthly high temperature means, surprisingly daytime highs were short of reaching record territory. Night-time lows came in slightly above normal at both Mobile and Pensacola by around a couple degrees on average. In the low temperature column, Mobile saw one record high low and Pensacola two. Average temperatures around 85.0° at both Mobile and Pensacola stood tall taking a spot in the top 10 warmest July's on record.
Although over a half foot of rainfall fell at both Mobile and Pensacola during the month of July, amounts were a bit shy of monthly normal. Annual rainfall to date is in deficit by a little over three inches for the Mobile area, but is in surplus for the Pensacola area by around the same amount.
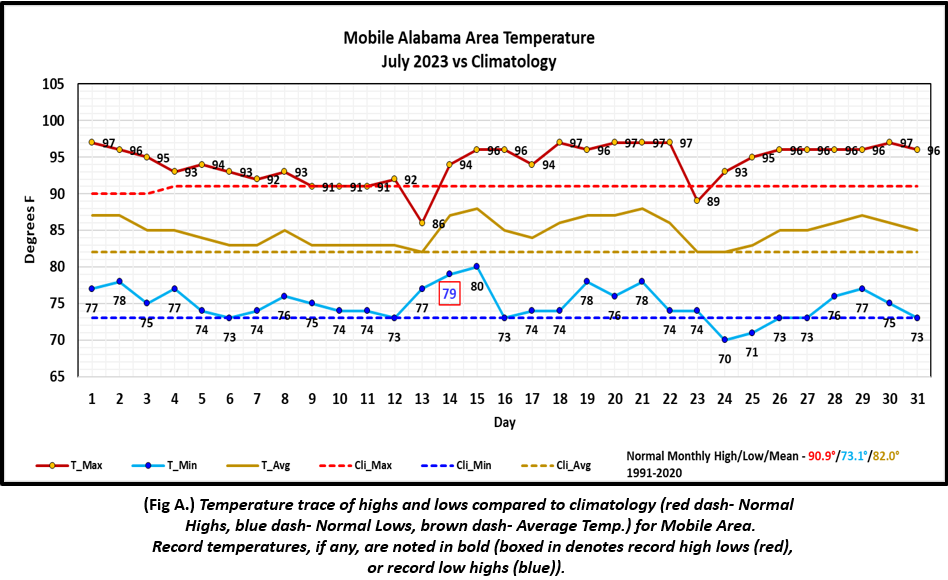
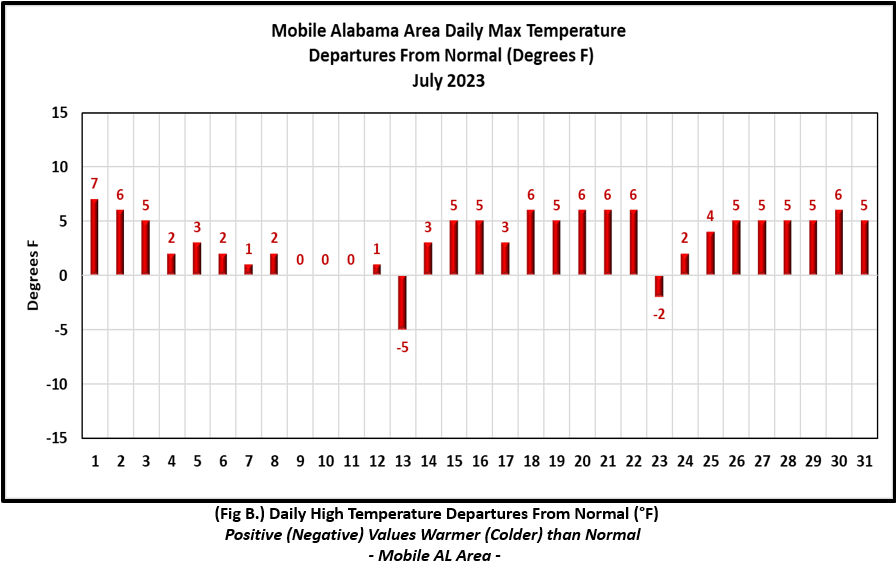
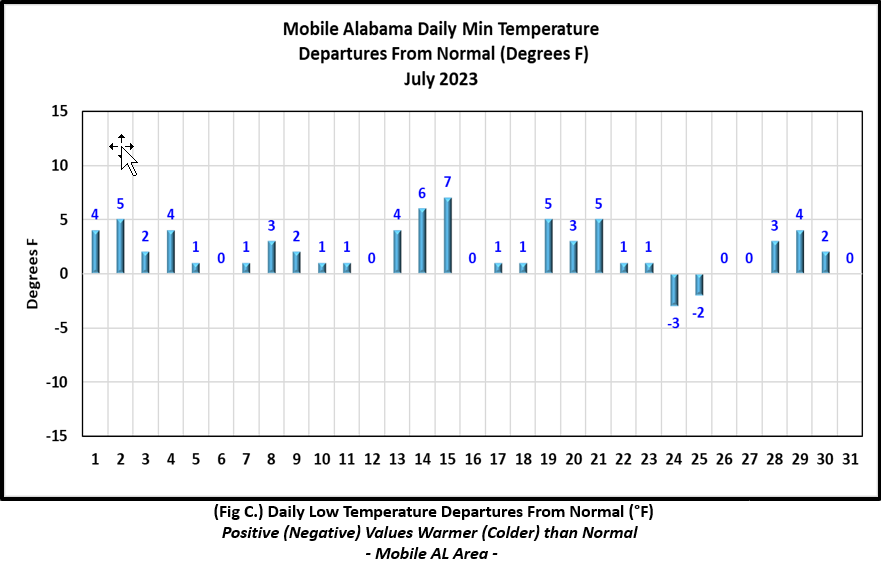
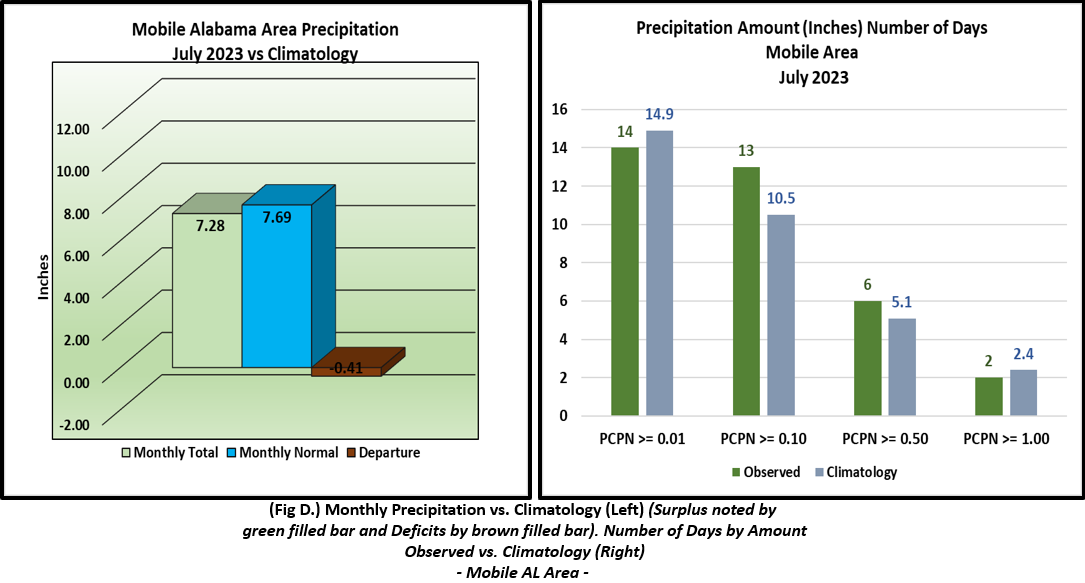
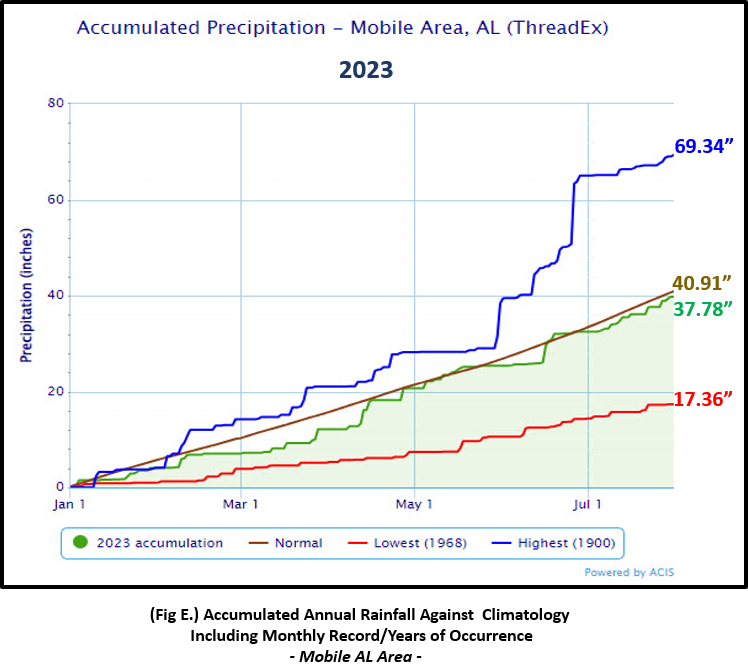
Mobile Alabama Area [Climate Normal Period 1991-2020, Climate Record Period 1872 to Present]- The average monthly high of 94.3° was 3.4° above normal and stands alone as the 3rd warmest July's on record. The average monthly low was 75.0° or 1.9° above normal. The average monthly temperature of 84.6° was 2.6° above normal. Notably, the average monthly temperature came in just shy of the top five warmest July's on record at number 6. The highest temperature for the month, 97° occurred on six days of the month, the 1st, 18th, 20th, 21st, 22nd, and the 30th was 6.2° above the normal on average for these days. The lowest temperature for the month, 70° on the 24th, stood at 3° below normal for this date. A record high low temperature of 79° on the 14th tied the previous record on this date set back in five other years, 2019, 1980, 1932, 1877 and 1875. (Fig. A) shows a graphical representation of how the Mobile area temperatures compared to the seasonal normal daily highs and lows, which are shown by the colored dashed lines. Bar graphs reflecting the daily high/low temperature departures from normal are provided in the table below (Figs. B and C). The rain gauge collected a little over 7" for the month at 7.28" (Fig. D), 0.41" below normal. A bar graph showing the number of days of occurrence of select precipitation amounts compared to climatological normals is also provided in (Fig. D). Similar to this time last year, annual rainfall is just shy of 38" at 37.78" (Fig. E), a deficit of 3.13" short of the normal annual accumulation to date.
July top records for the month during the Period of Record for the Mobile Area:
Click on the Mobile Alabama area climate graphics below to expand:
|
|
|
|
|
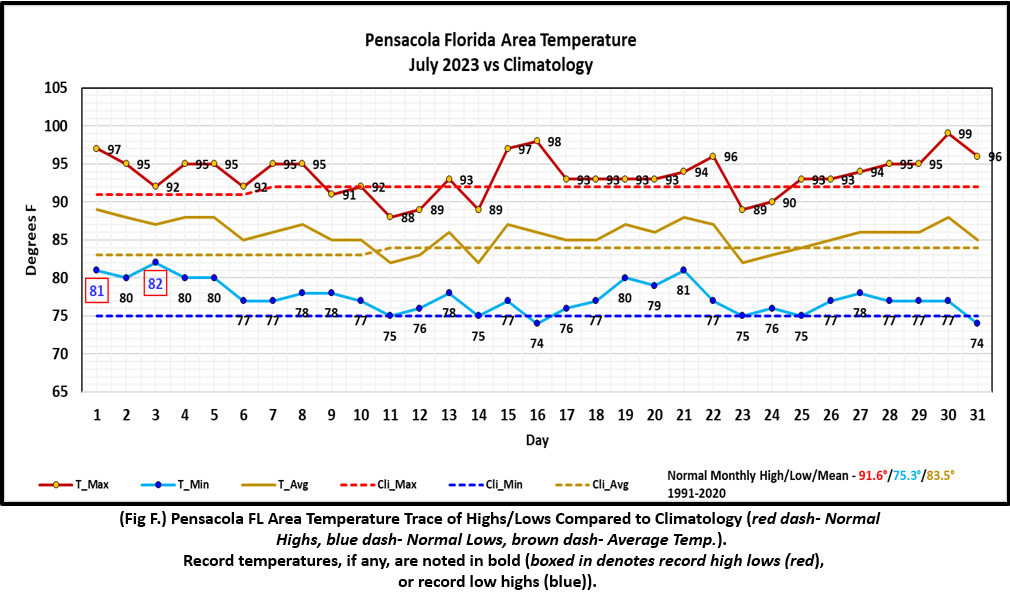
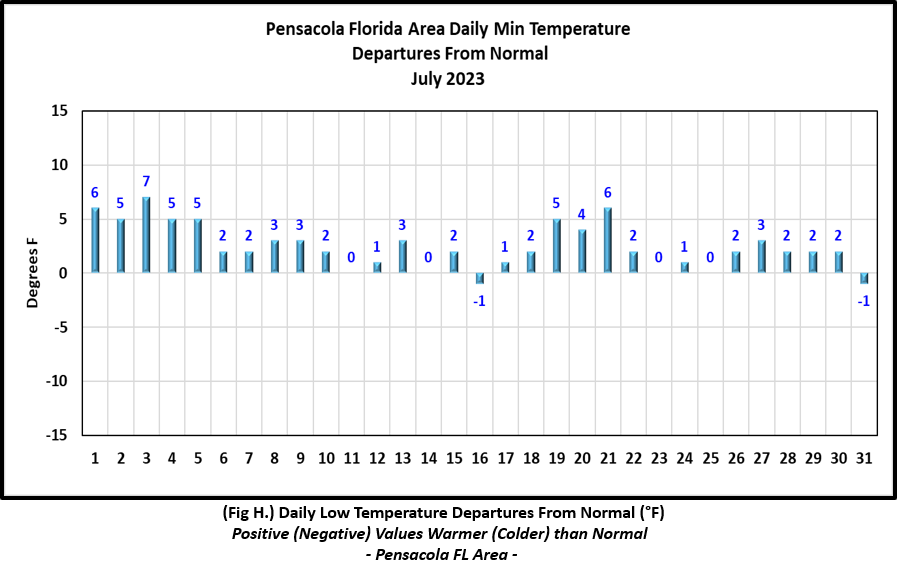
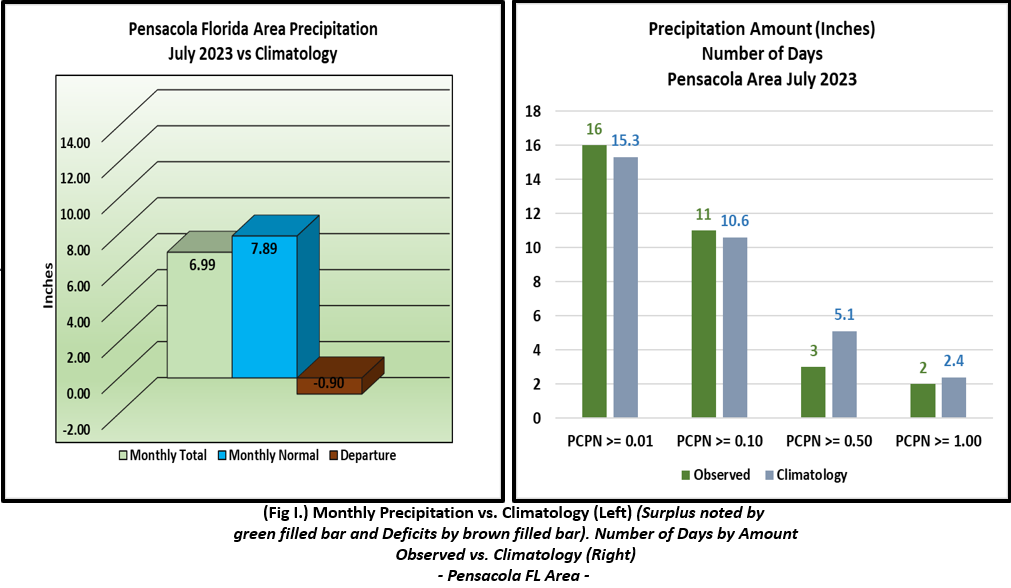
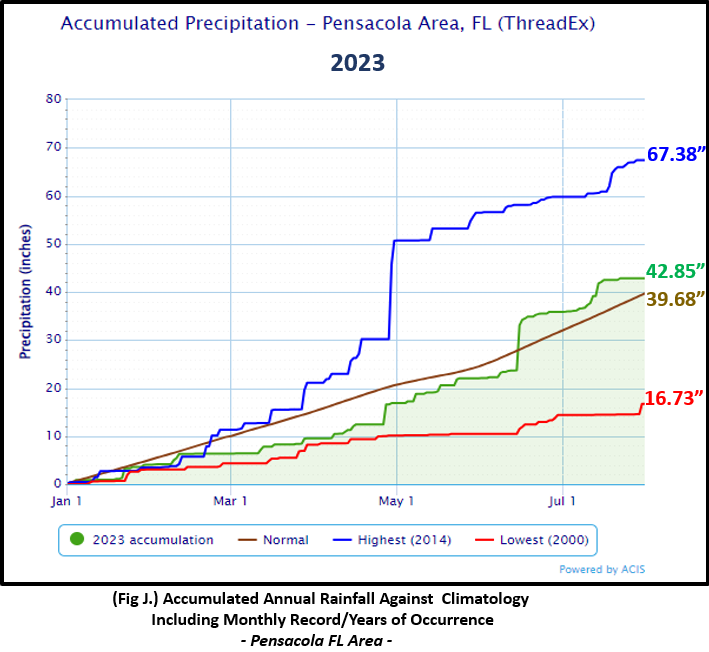
Pensacola Florida Area [Climate Normal Period 1991-2020, Climate Record Period 1879 to Present] - The average monthly high of 93.5° was 1.9° above normal and is tied for the 3rd warmest July's on record with respect to monthly high along side the last occurrence in 1986. The average monthly low was 77.5° or 2.2° above normal and is tied for the 3rd warmest July's on record with respect to monthly low along side the last occurrence in 2016. The average monthly temperature of 85.5° was 2.2° above normal. Considering the average monthly temperature, July 2023 at Pensacola is now tied for the top warmest July's on record along side the previous occurrence in July 2000. The highest temperature for the month, 99° on the 30th was just 7° above the normal daily high temperature for this date. The lowest temperature for the month, 74° on the 16th and the 31st, was 5° below the normal daily low temperature on average for these two days. A couple of record high low temperatures were observed the first week of the month. 81° on the 1st tied the previous occurrence on this date back in 1932 and 81° on the morning of the 3rd tied the previous occurrence on this date way back in 1897. (Fig. F) shows a graphical representation of how the Pensacola area temperatures compared to the seasonal normal daily highs and lows, which are shown by the colored dashed lines. (Figs. G and H) shows the daily high/low temperature departures from normal. The rain gauge collected 6.99" (Fig. I), or 0.90" below normal for July rainfall. A bar graph showing the number of days of occurrence of select precipitation amounts compared to climatological normal is also shown in (Fig. I). Annual rainfall has surpassed 42" at 42.85", a surplus of 3.17" above normal to date. (Fig. J).
July top records for the month during the Period of Record for the Pensacola Area:
Click on the Pensacola Florida area climate graphics below to expand:
|

|
|
|
|
Additional July 2023 Climatology and Topics
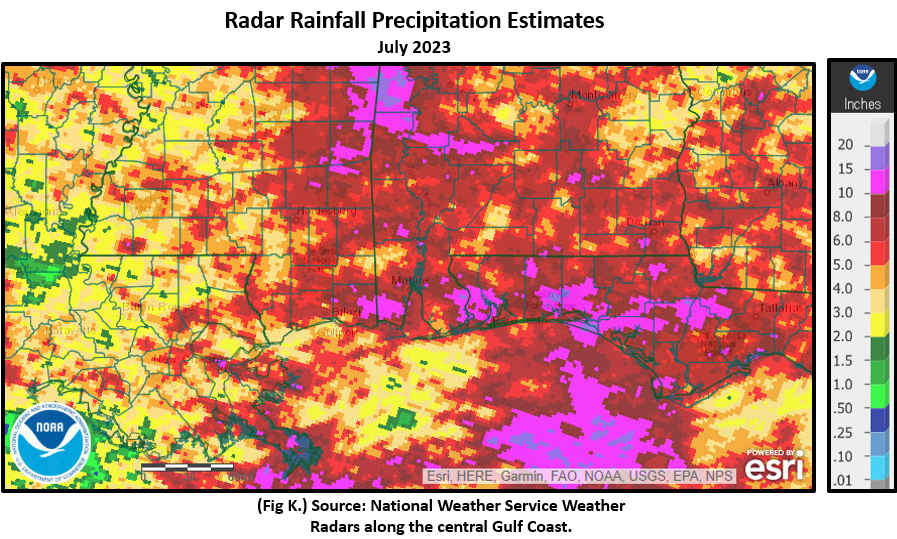
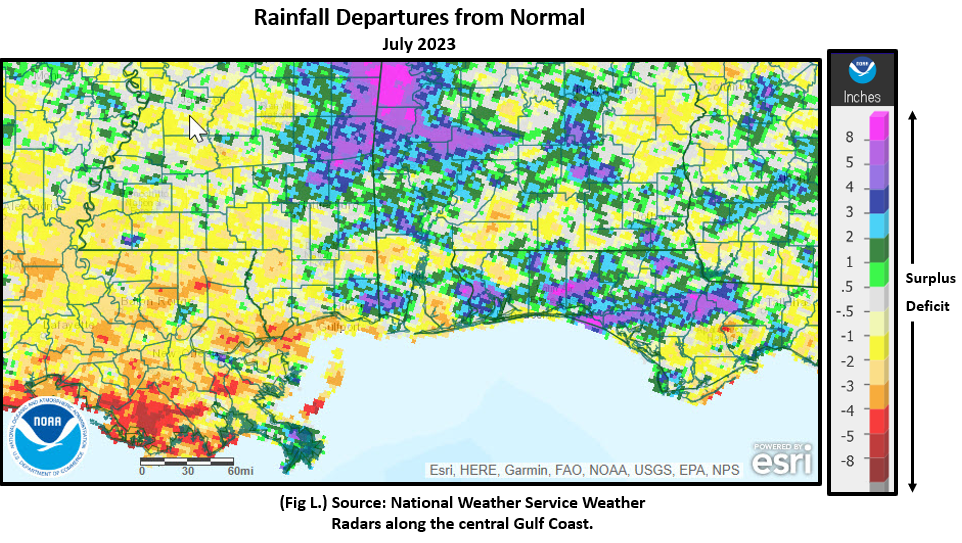
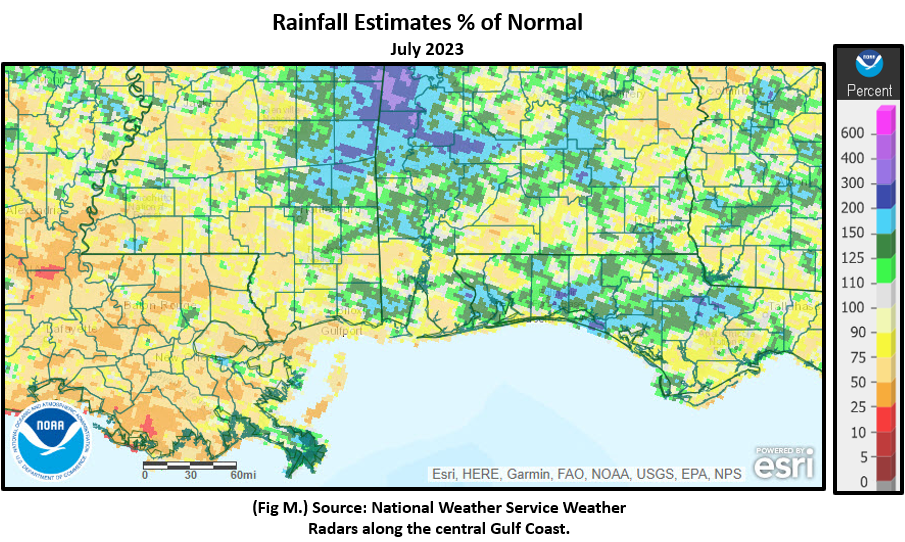
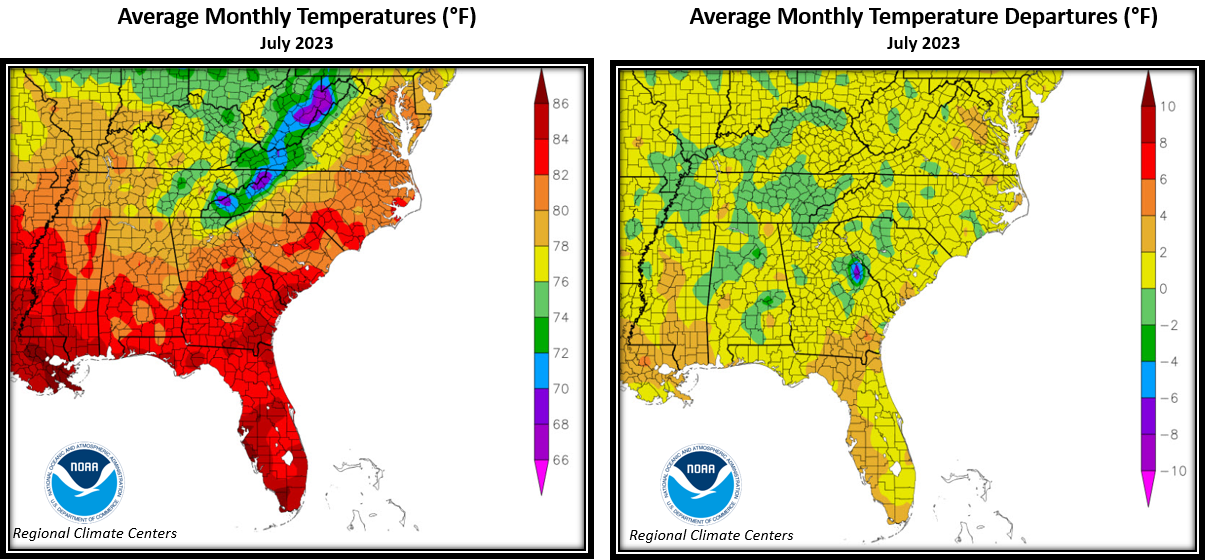
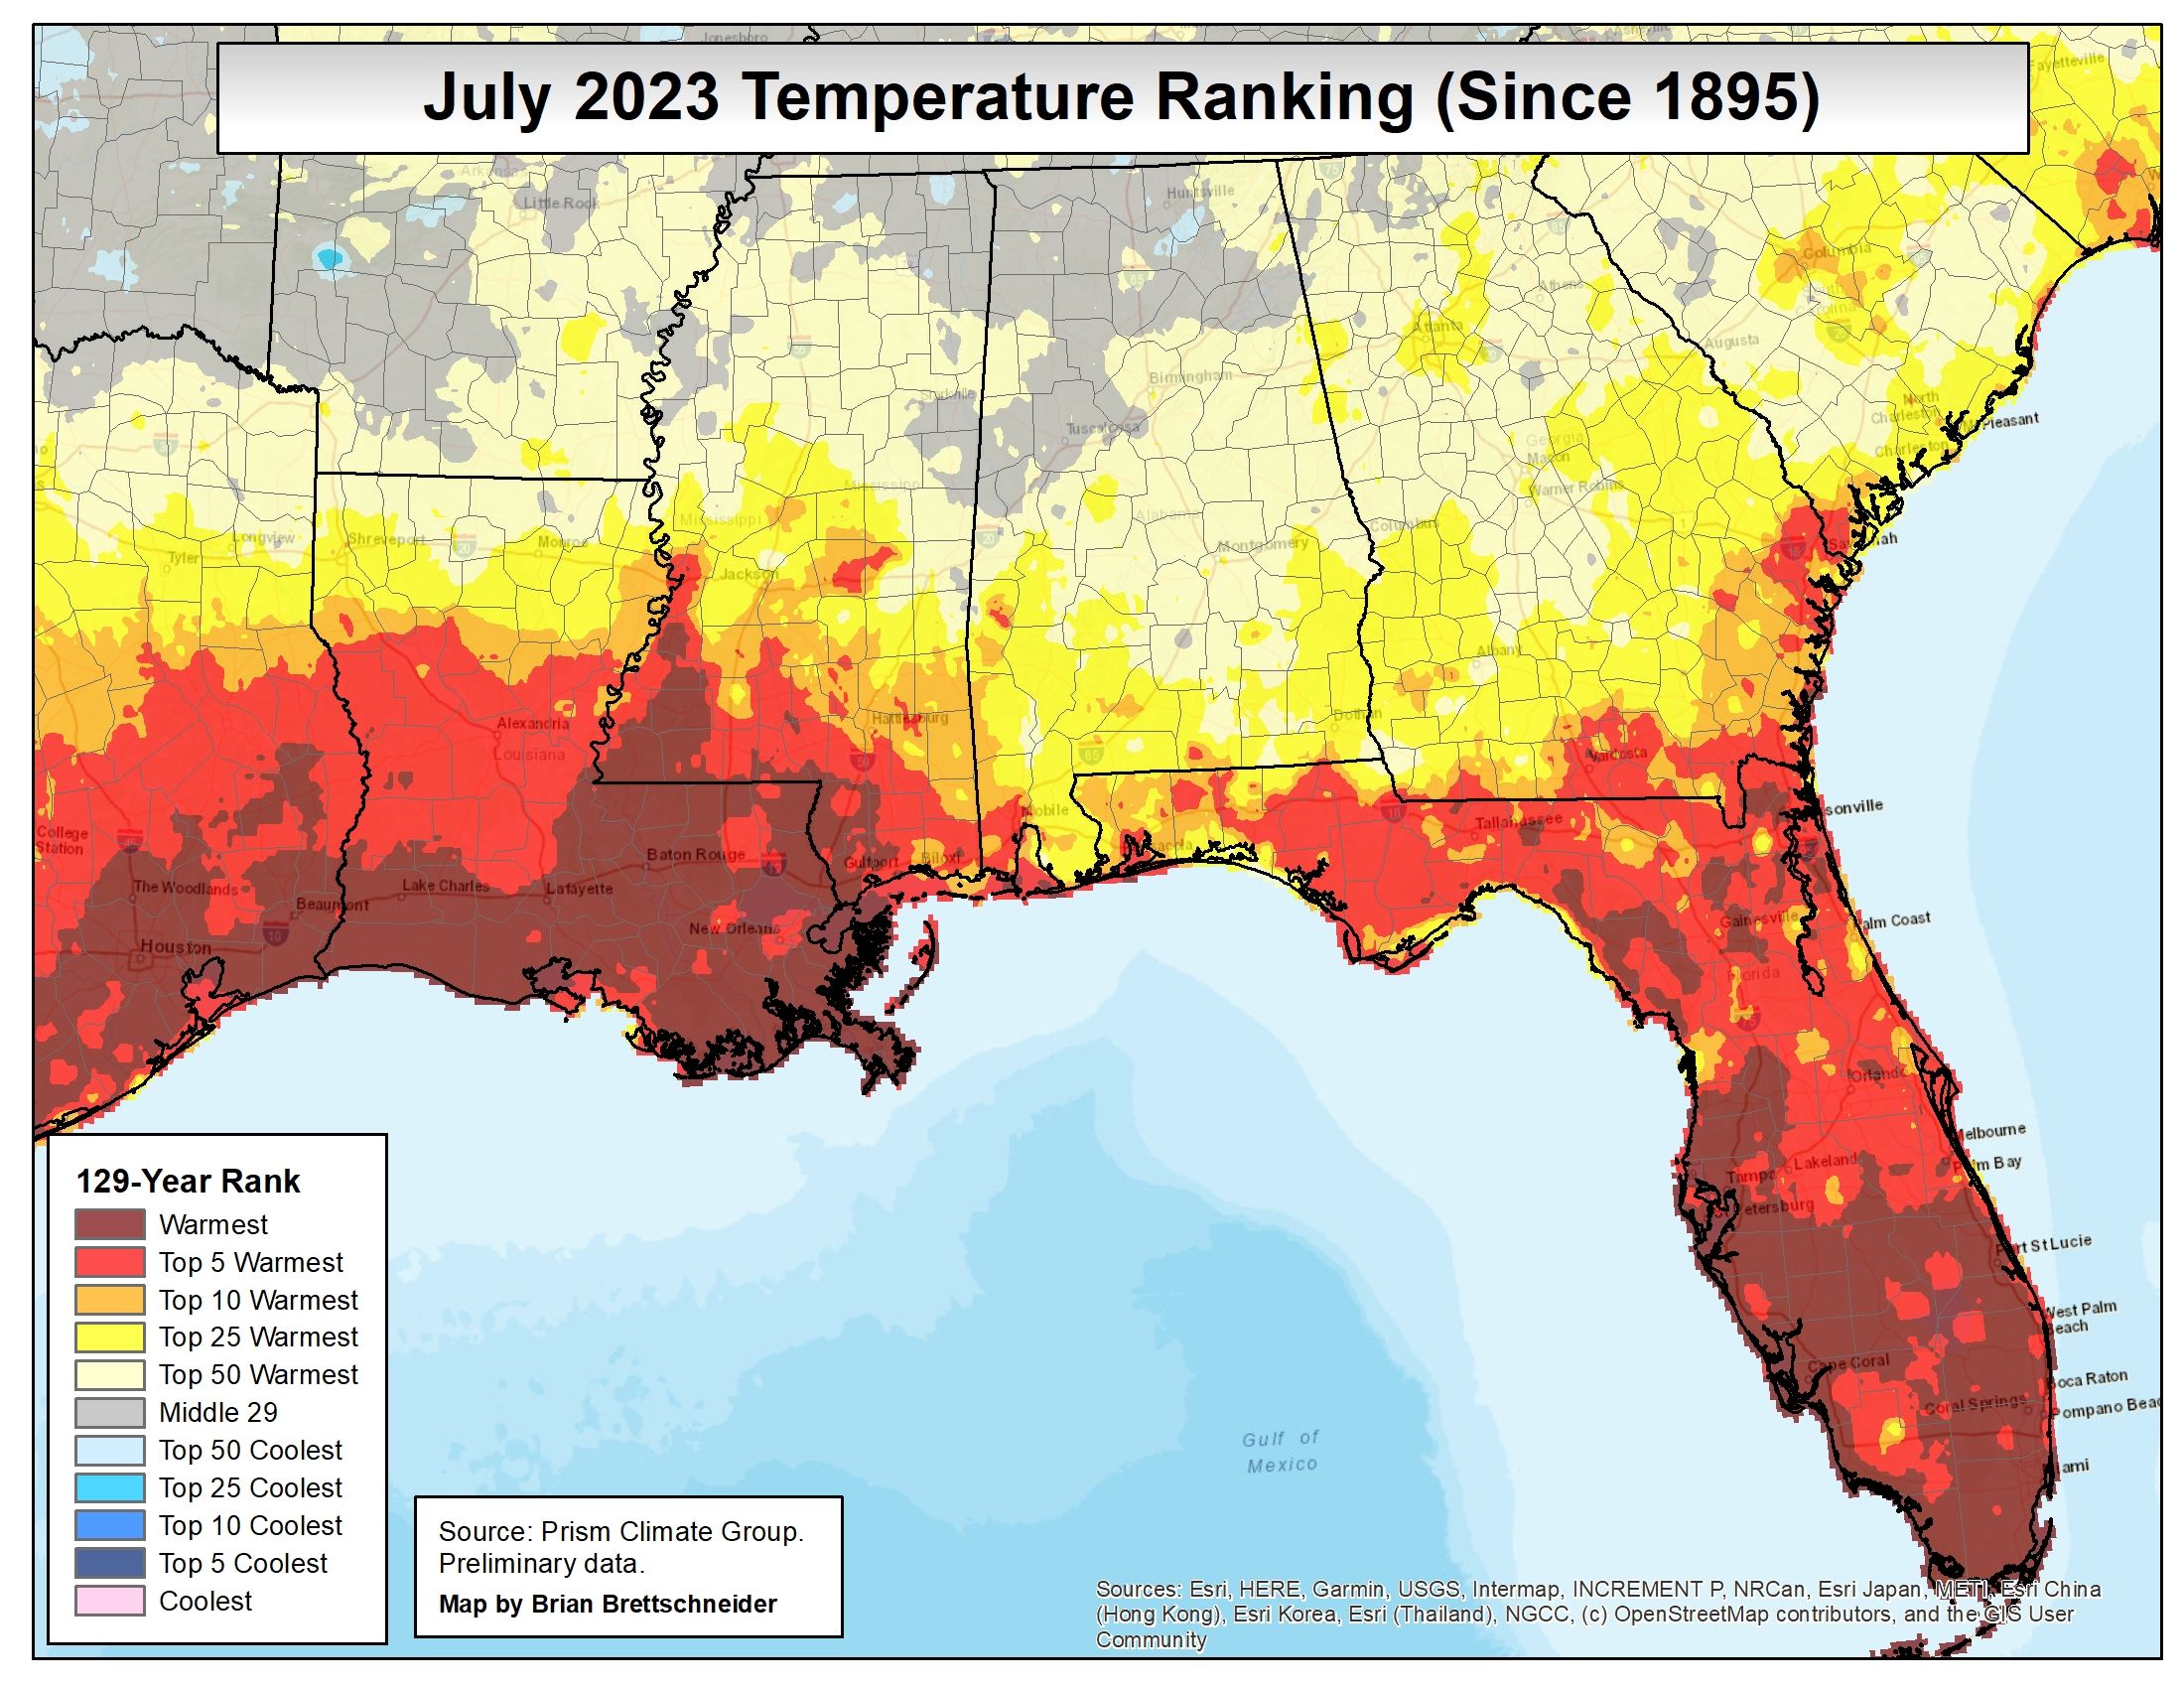
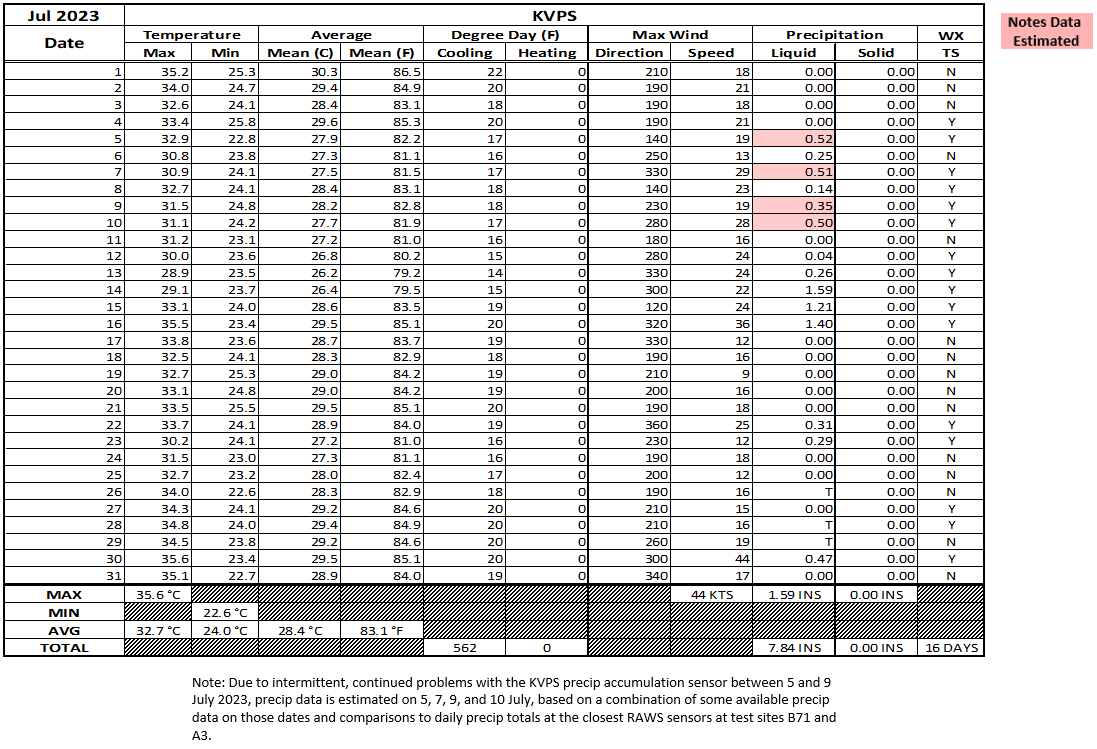
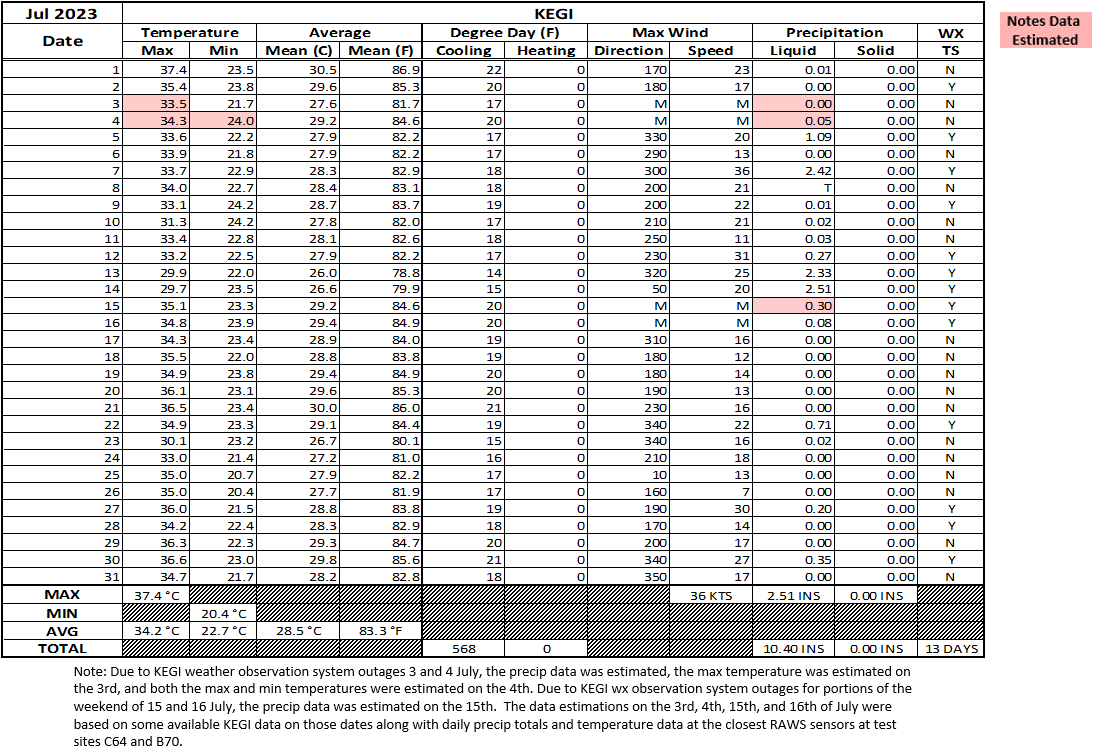
There were small pockets of excessive rainfall over the Gulf coast and over portions of the far northern interior counties mainly along and north of US Highway 84. Mobile and Pensacola saw heavy rains in the vicinity but just south of Mobile Regional Airport and just north and west of Pensacola International Airport. Locations that saw the heavier downpours saw monthly amounts adding up to above 10". (Fig. K) shows the areal distribution of monthly rainfall, (Fig. L) shows the areal rainfall departures from normal and (Fig. M), the areal percent of normal rainfall. Areal average temperatures are provided in (Fig. N) showing much of the southeast seeing average monthly temperatures for July well above 80°. (Fig. O) shows the average temperature ranking over the southeast US for July 2023 based on climatology dating back to 1895. Many areas from the upper Texas coast eastward to Florida saw the month at top 5 warmest levels. Map courtesy of Brian Brettschneider (NOAA). Data by PRISM Climate Group. The latest July 2023 monthly summary for Eglin Air Force Base (KVPS) and Duke Field (KEGI) has been received and provided in the table below. The temperatures in the daily tables consists of numbers both in °F/°C. Data courtesy of Mr. David Biggar, Staff Meteorologist, 96th Weather Squadron. Provided by permission.
|
|
|
|
|
|
|
|
August 2023 Climatology, Seasonal Climatology and Outlooks:
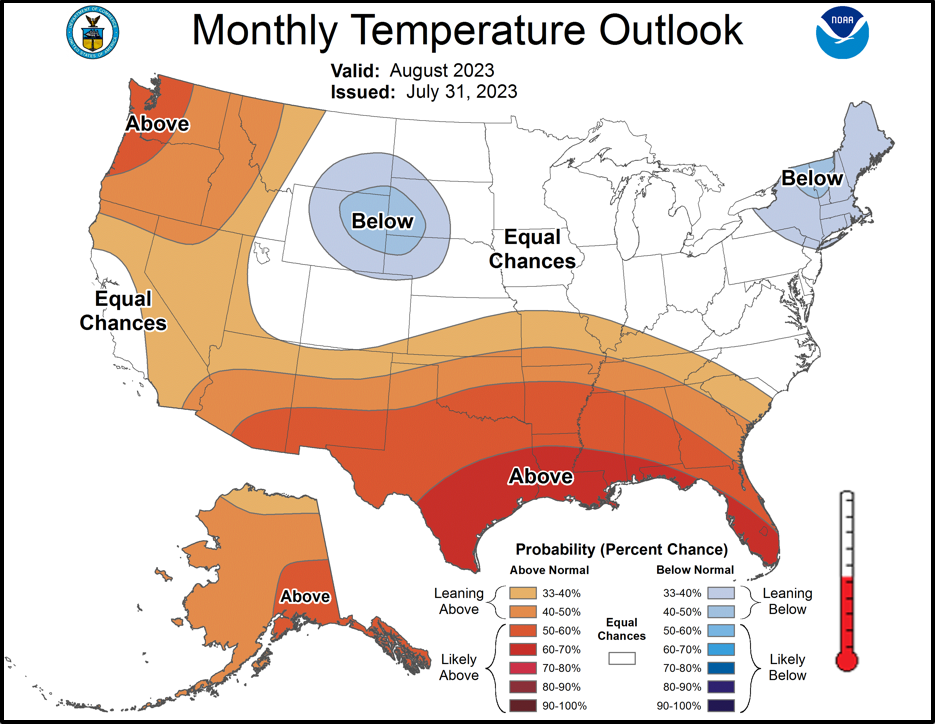
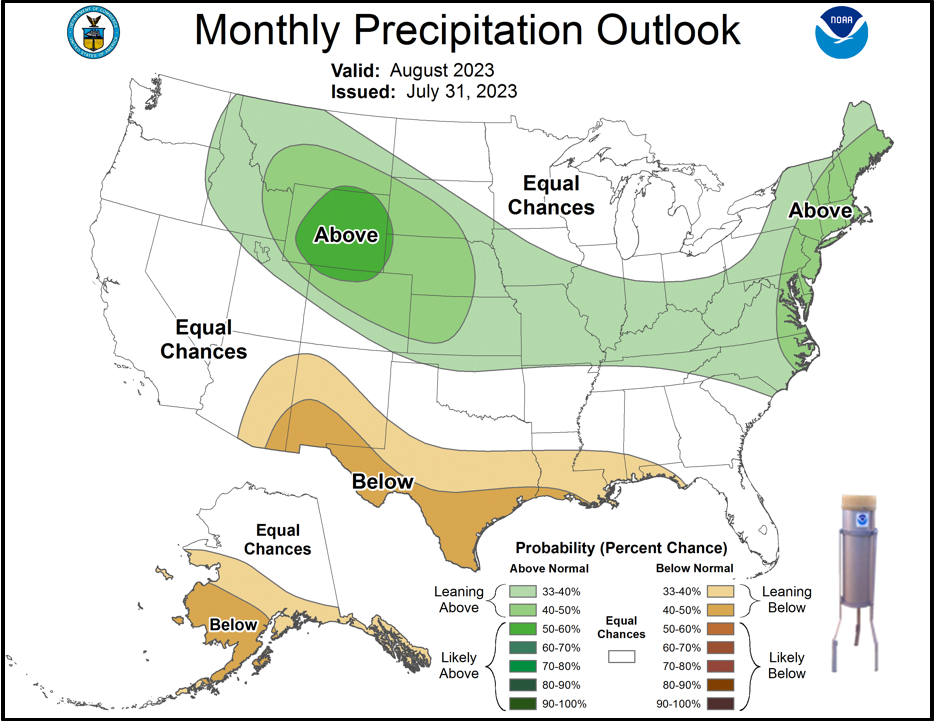
The above normal heat is favored to continue over the southern US into the month of August with the long range outlook for temperatures favoring these to be likely above normal from Texas eastward across the Lower MS River Valley to Florida. For precipitation, the outlook leans below normal from Texas, eastward to the central Gulf coast. Equal chances of above or below normal precipitation is favored elsewhere over the southeast. We are now entering the typical peak of the Atlantic Basin Hurricane Season in August and September. It's highly encouraged to review your hurricane preparedness, see link below.
Click on the snap shots below to expand:
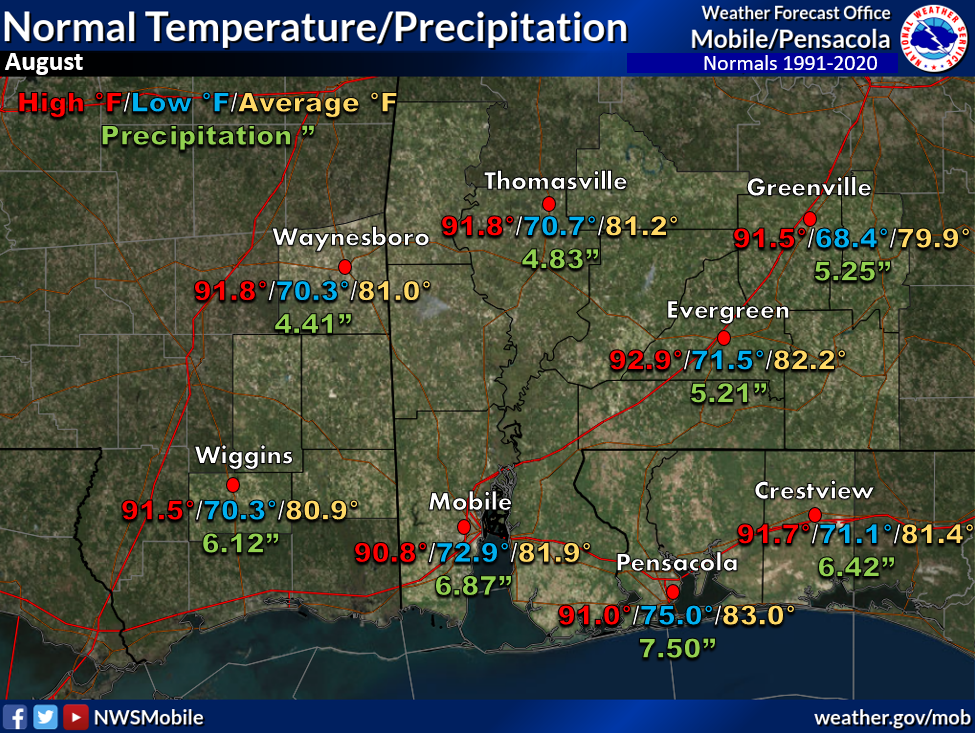 August Normals August Normals |
|
Outlook |

|
|

|
Additional Climate Links:
The links below are intended to provide additional climate information, education and outlooks. The National Weather Service Mobile Alabama's Climate and Past Weather page provides climate data at your fingertips for many observation points in the local forecast area by accessing the NOWData tab as well as many other climate resources. The Climate Prediction Center Link provides short and longer range climatic outlooks and education about the larger scale global circulations that impact temperatures and weather. With the large agriculture and farming presence along the central Gulf coast, the Drought Monitor link provides updates on drought trends and impacts. Another very helpful resource is the Community Collaborative Rain Hail and Snow (CoCoRaHS) network, which is a large group of volunteers working together to measure and map precipitation (rain, hail and snow). The aim of CoCoRaHS is to provide the highest quality data for natural resource, education and research applications. You can be a part of the CoCoRaHS team by becoming a volunteer rainfall observer. To learn more click on the CoCoRaHS link below.
National Weather Service Mobile AL Climate and Past Weather
National Weather Service Mobile AL Climate Summary Monthly Archives
Climate Prediction Center (CPC)
CoCoRaHS Network Water Year Summaries