June 2025 Climate Summaries
Mobile Alabama and Pensacola Florida Area
National Weather Service Mobile Alabama
July 3, 2025
June 2025 in Review - Temperature averages considering all three metrics, that being the average high, lows and monthly means were less than a degree off the normal temperatures expected for June. It was an uneventful month regarding temperature records as none were reached.
Much more wet at Mobile compared to Pensacola. With a little over 65% of the month seeing measurable rain, the rain gauge swelled to well over ten inches at Mobile and several inches above normal. On the flip side, Pensacola only saw nearly half of that amount at a little over five inches total for the month and bit over two inches below normal.
The tropics have started off with two named storms in the Atlantic Basin. Tropical Storm Andrea formed over the central Atlantic June 24th which is atypical in June that far out and Tropical Storm Barry formed a few days later June 28th over the Bay of Campeche, more within the typical June tropical cyclone climatological origin area.
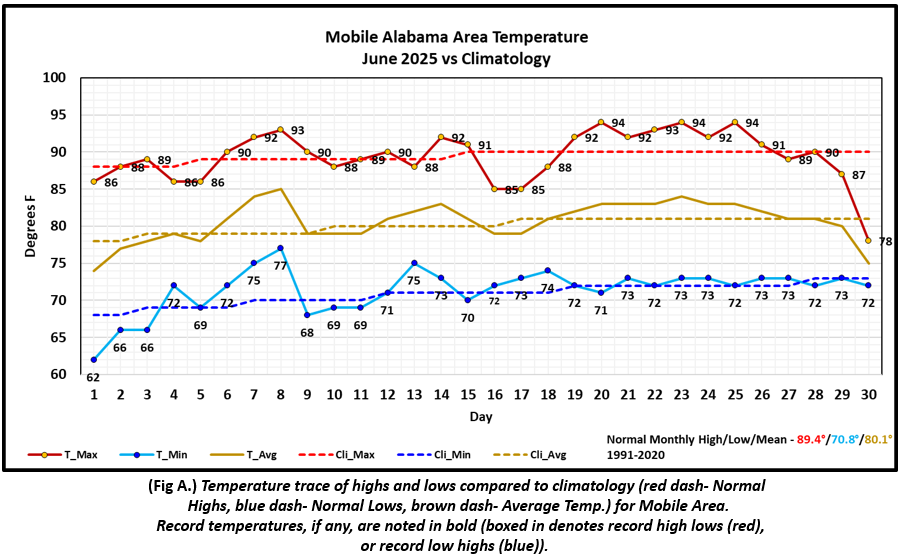
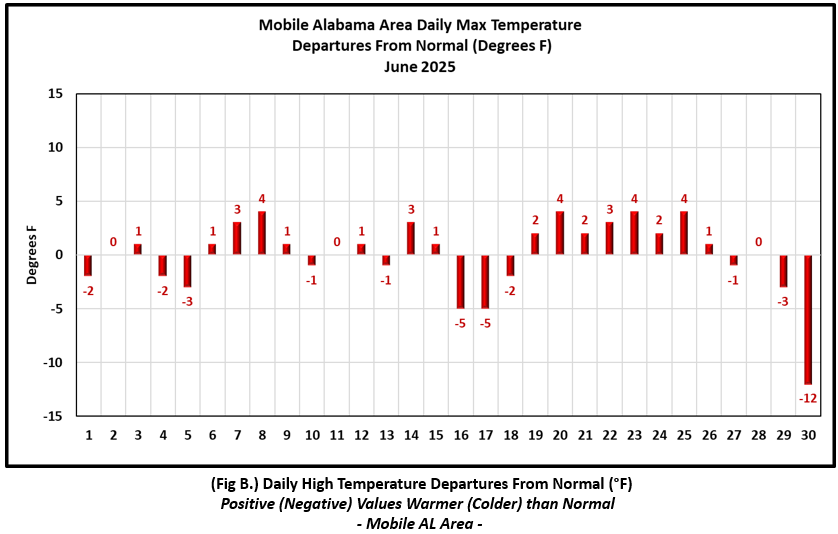
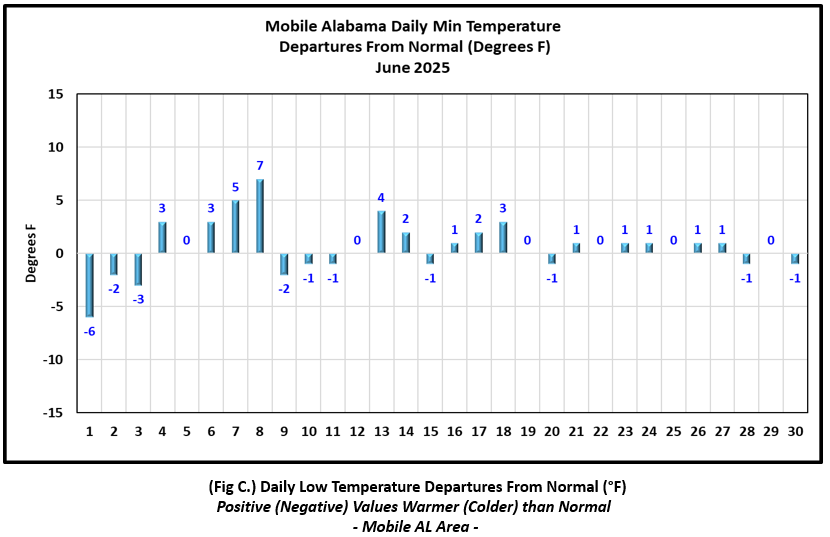
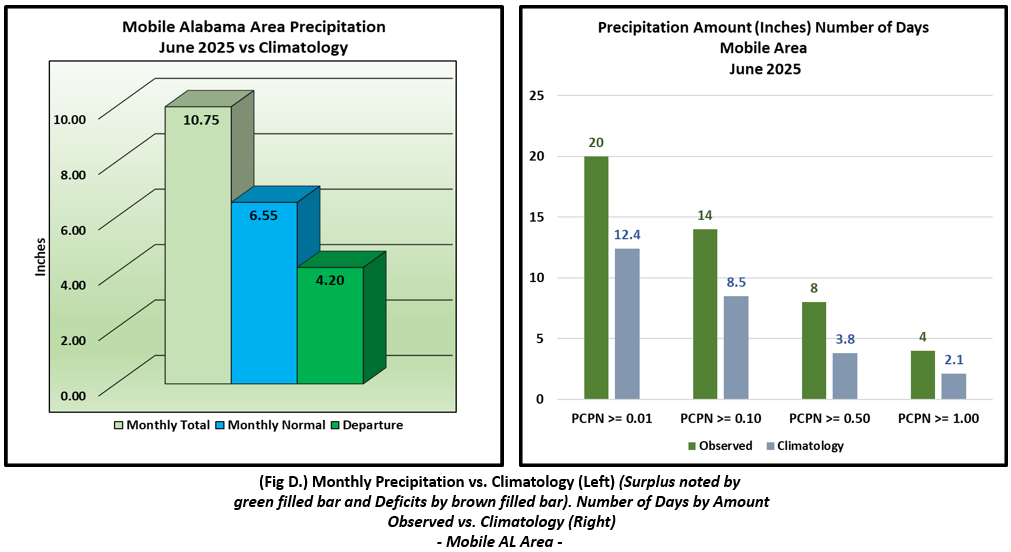
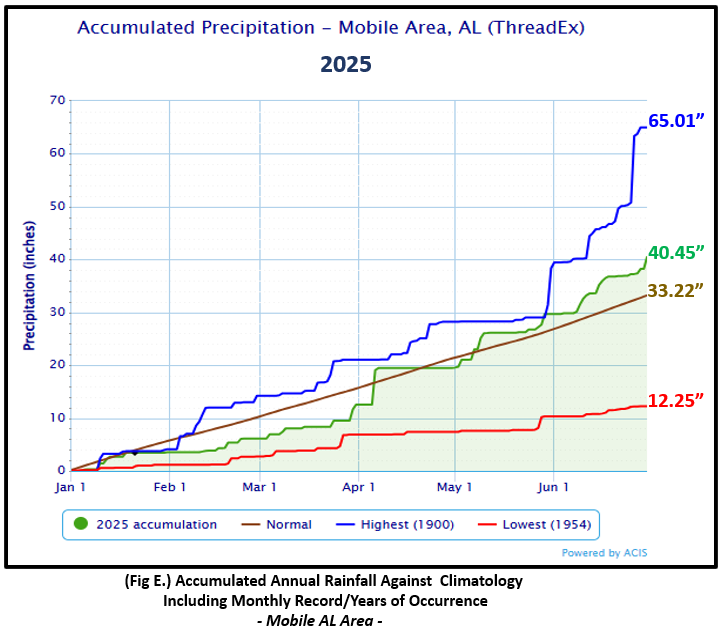
Mobile Alabama Area [Climate Normal Period 1991-2020, Climate Record Period 1872 to Present]- The average monthly high of 89.4° was right at normal. The average monthly low was 71.4° or 0.6° above normal. The average monthly temperature of 80.4° was 0.3° above normal. The highest temperature for the month was 94° occurring on the 20th, 23rd, and 25th which was 4° above the normal for these dates. The month opened up with the coolest low temperature on the morning of the 1st, 62° and 6° below the normal for the date. No record temperatures were reached. (Fig. A) shows a graphical representation of how the Mobile area temperatures compared to the seasonal normal daily highs and lows, which are shown by the colored dashed lines. Bar graphs reflecting the daily high/low temperature departures from normal are provided in the table below (Figs. B and C). The rain gauge swelled to 10.75" for the month (Fig. D), 4.20" above normal for June. The annual rainfall total ending June 30th, 41.09", is in surplus by several inches at 7.87" above normal to date (Fig. E).
June top records for the month during the Period of Record for the Mobile Area:
Click on the Mobile Alabama area climate graphics below to expand:
|
|
|
|
|
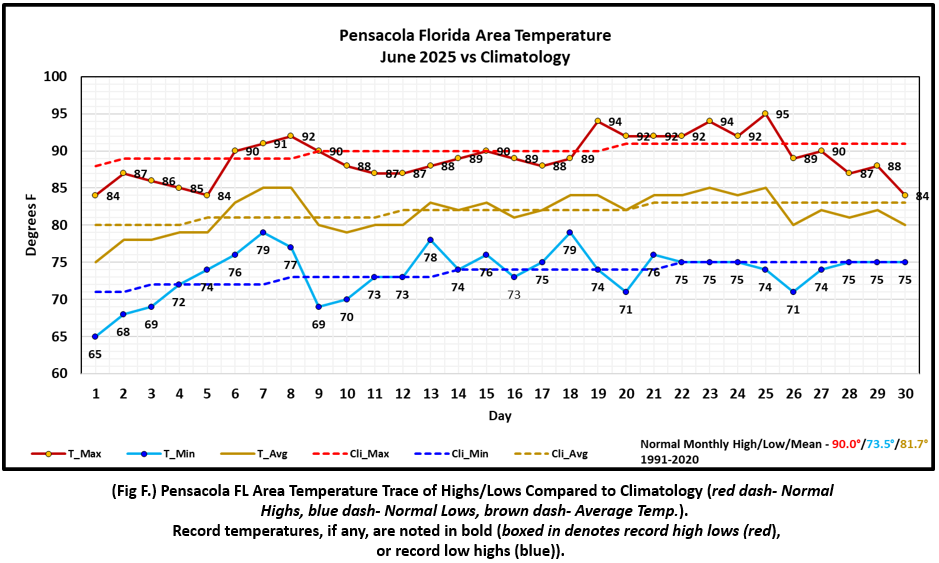
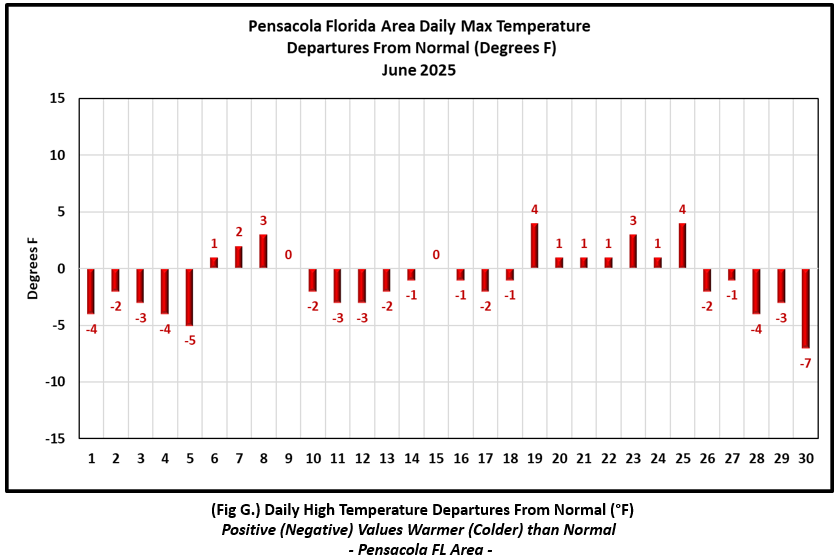
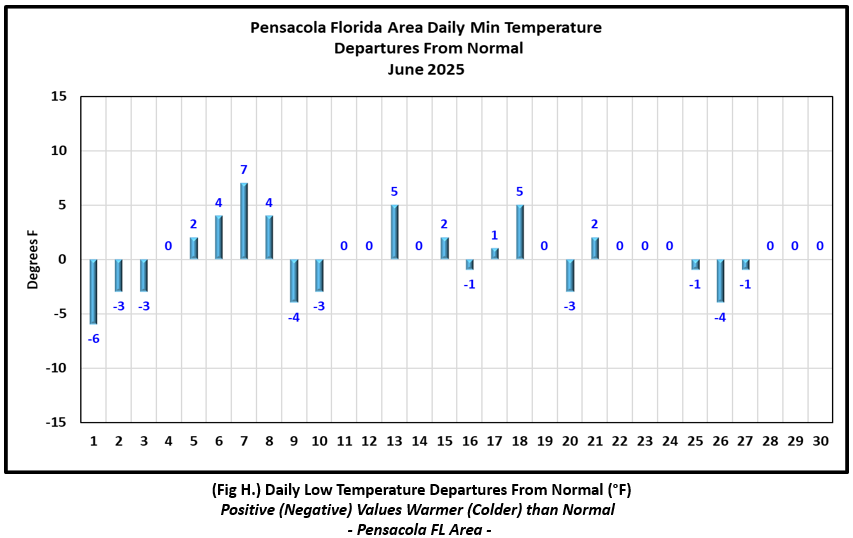
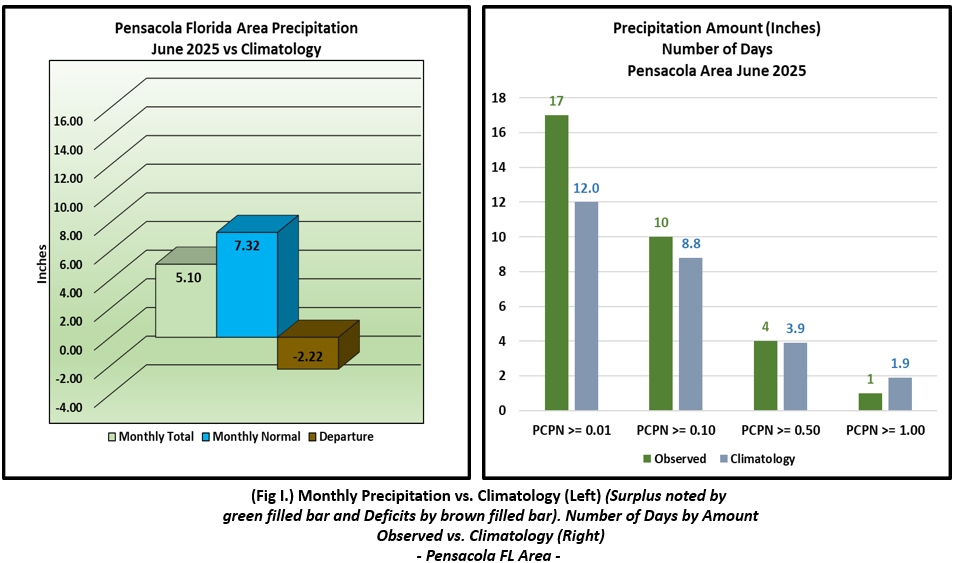
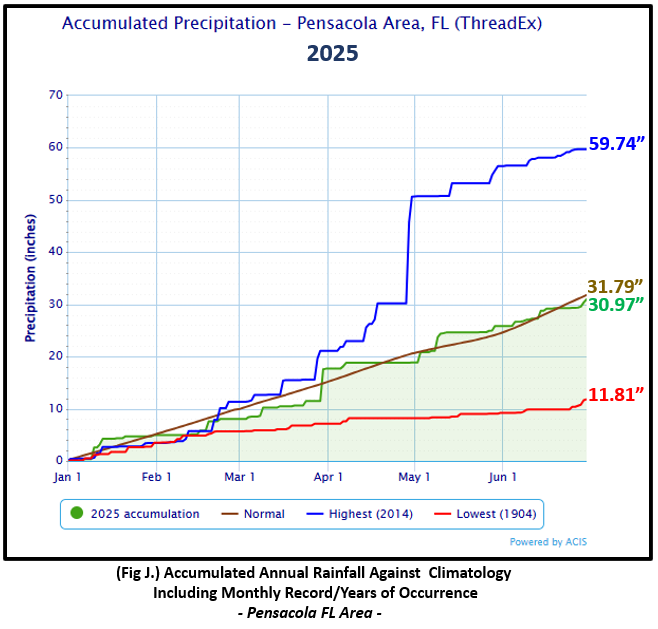
Pensacola Florida Area [Climate Normal Period 1991-2020, Climate Record Period 1879 to Present] - The average monthly high of 89.1° was 0.9° below normal. The average monthly low was 73.7° or 0.2° above normal. The average monthly temperature of 81.4° was 0.3° below normal. The highest temperature for the month was 95° on the 25th and 4° above the normal for the date. The month also opened up with the coolest low temperature on the morning of the 1st, 65° and 6° below the normal for the date. No record temperatures were reached. (Fig. F) shows a graphical representation of how the Pensacola area temperatures compared to the seasonal normal daily highs and lows, which are shown by the colored dashed lines. Bar graphs reflecting the daily high/low temperature departures from normal are provided in the table below (Figs. G and H). The rain gauge collected 5.10" for the month or 2.22" below normal. (Fig. I). The annual rainfall total ending June 30th is close to normal 31.48", but in deficit by 0.31" (Fig. J).
June top records for the month during the Period of Record for the Pensacola Area:
Click on the Pensacola Florida area climate graphics below to expand:
|
|
|
|
|
Additional June 2025 Climatology and Topics
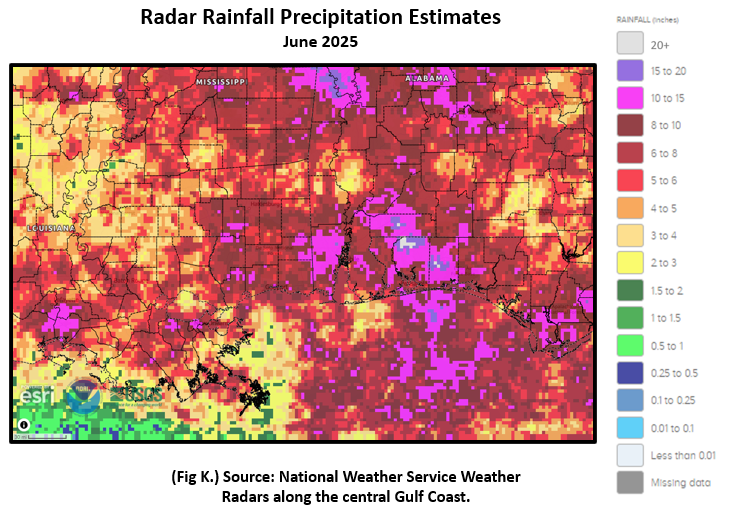
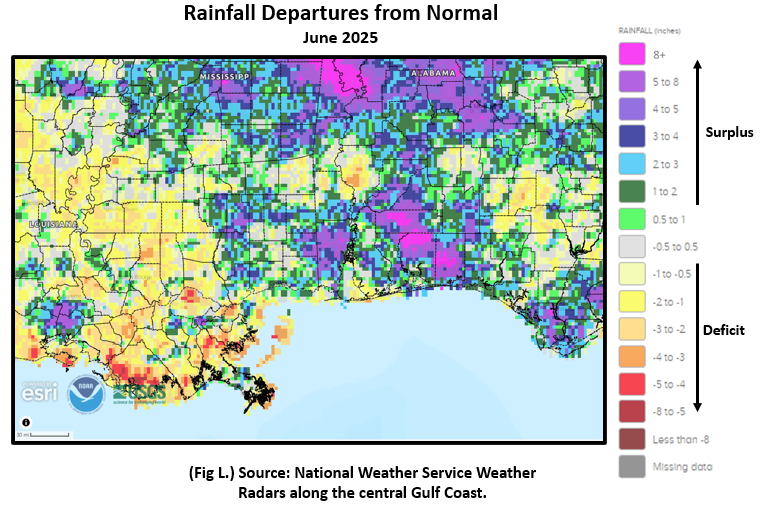
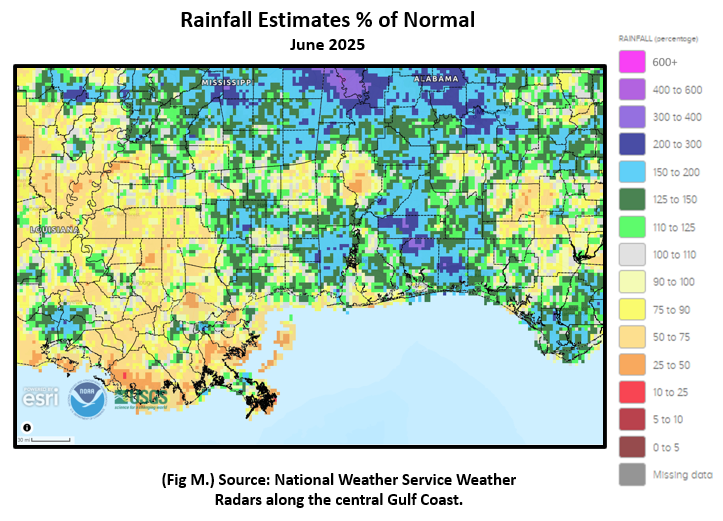
Much of the area saw a surplus, above the monthly normal rainfall. The larger excessive rainfall footprint swath was focused from southern Monroe Co., AL, southeastward to Okaloosa Co., in FL. Within this area, there were pockets of 15 to 20" total rains, 200-400% of normal and non-tropical related. As is typical for summer time convection, there were pockets of below normal monthly rainfall too, a few over the interior and along the coast. (Fig. K) shows the areal monthly rainfall total, (Fig. L) shows the areal rainfall departures from normal and (Fig. M), the areal percent of normal rainfall. Areal average temperatures are provided in (Fig. N).
|
|
|
July 2025 Climatology, Seasonal Climatology and Outlooks:
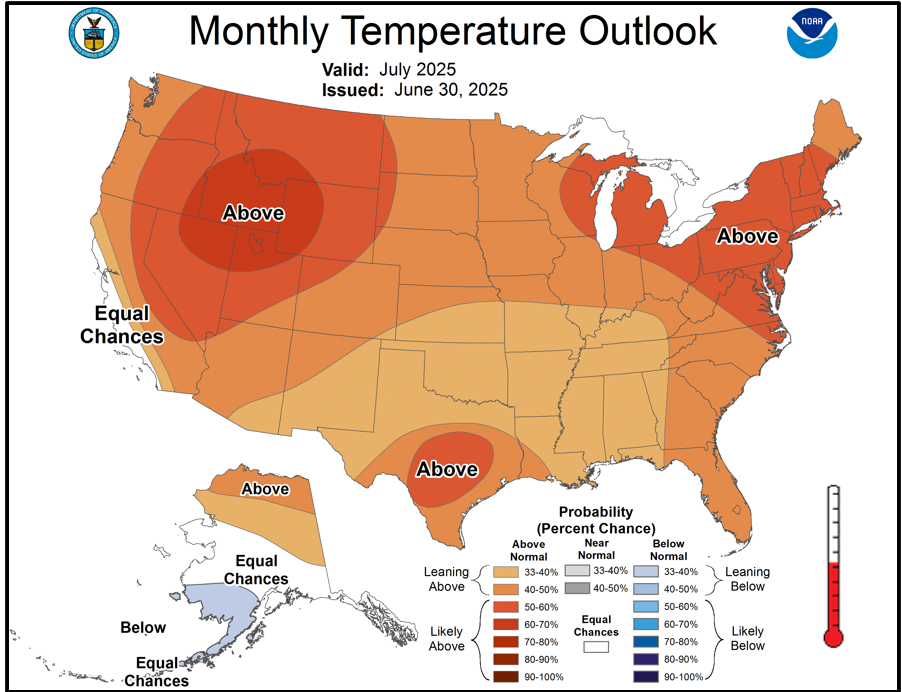
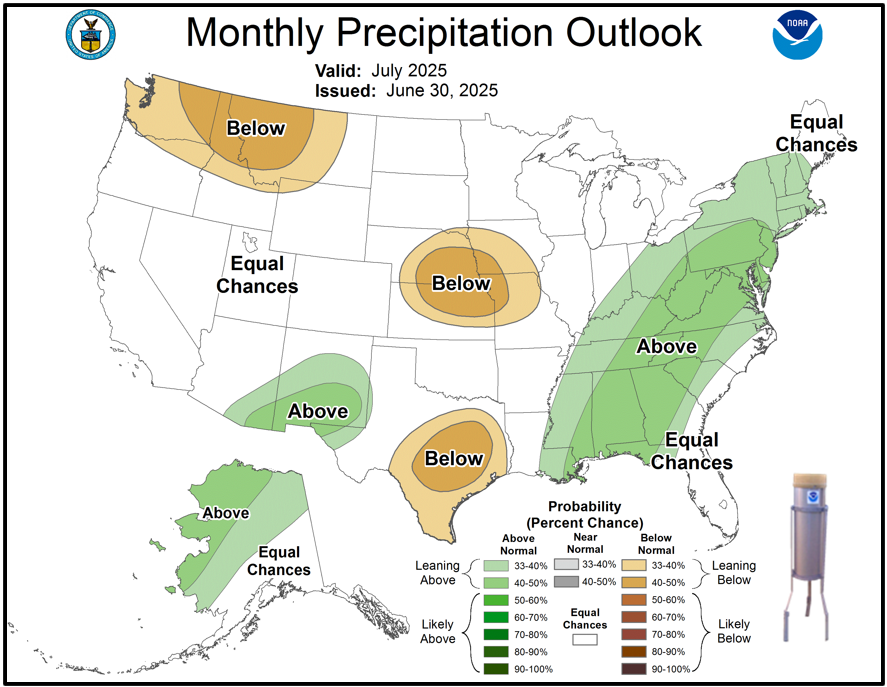
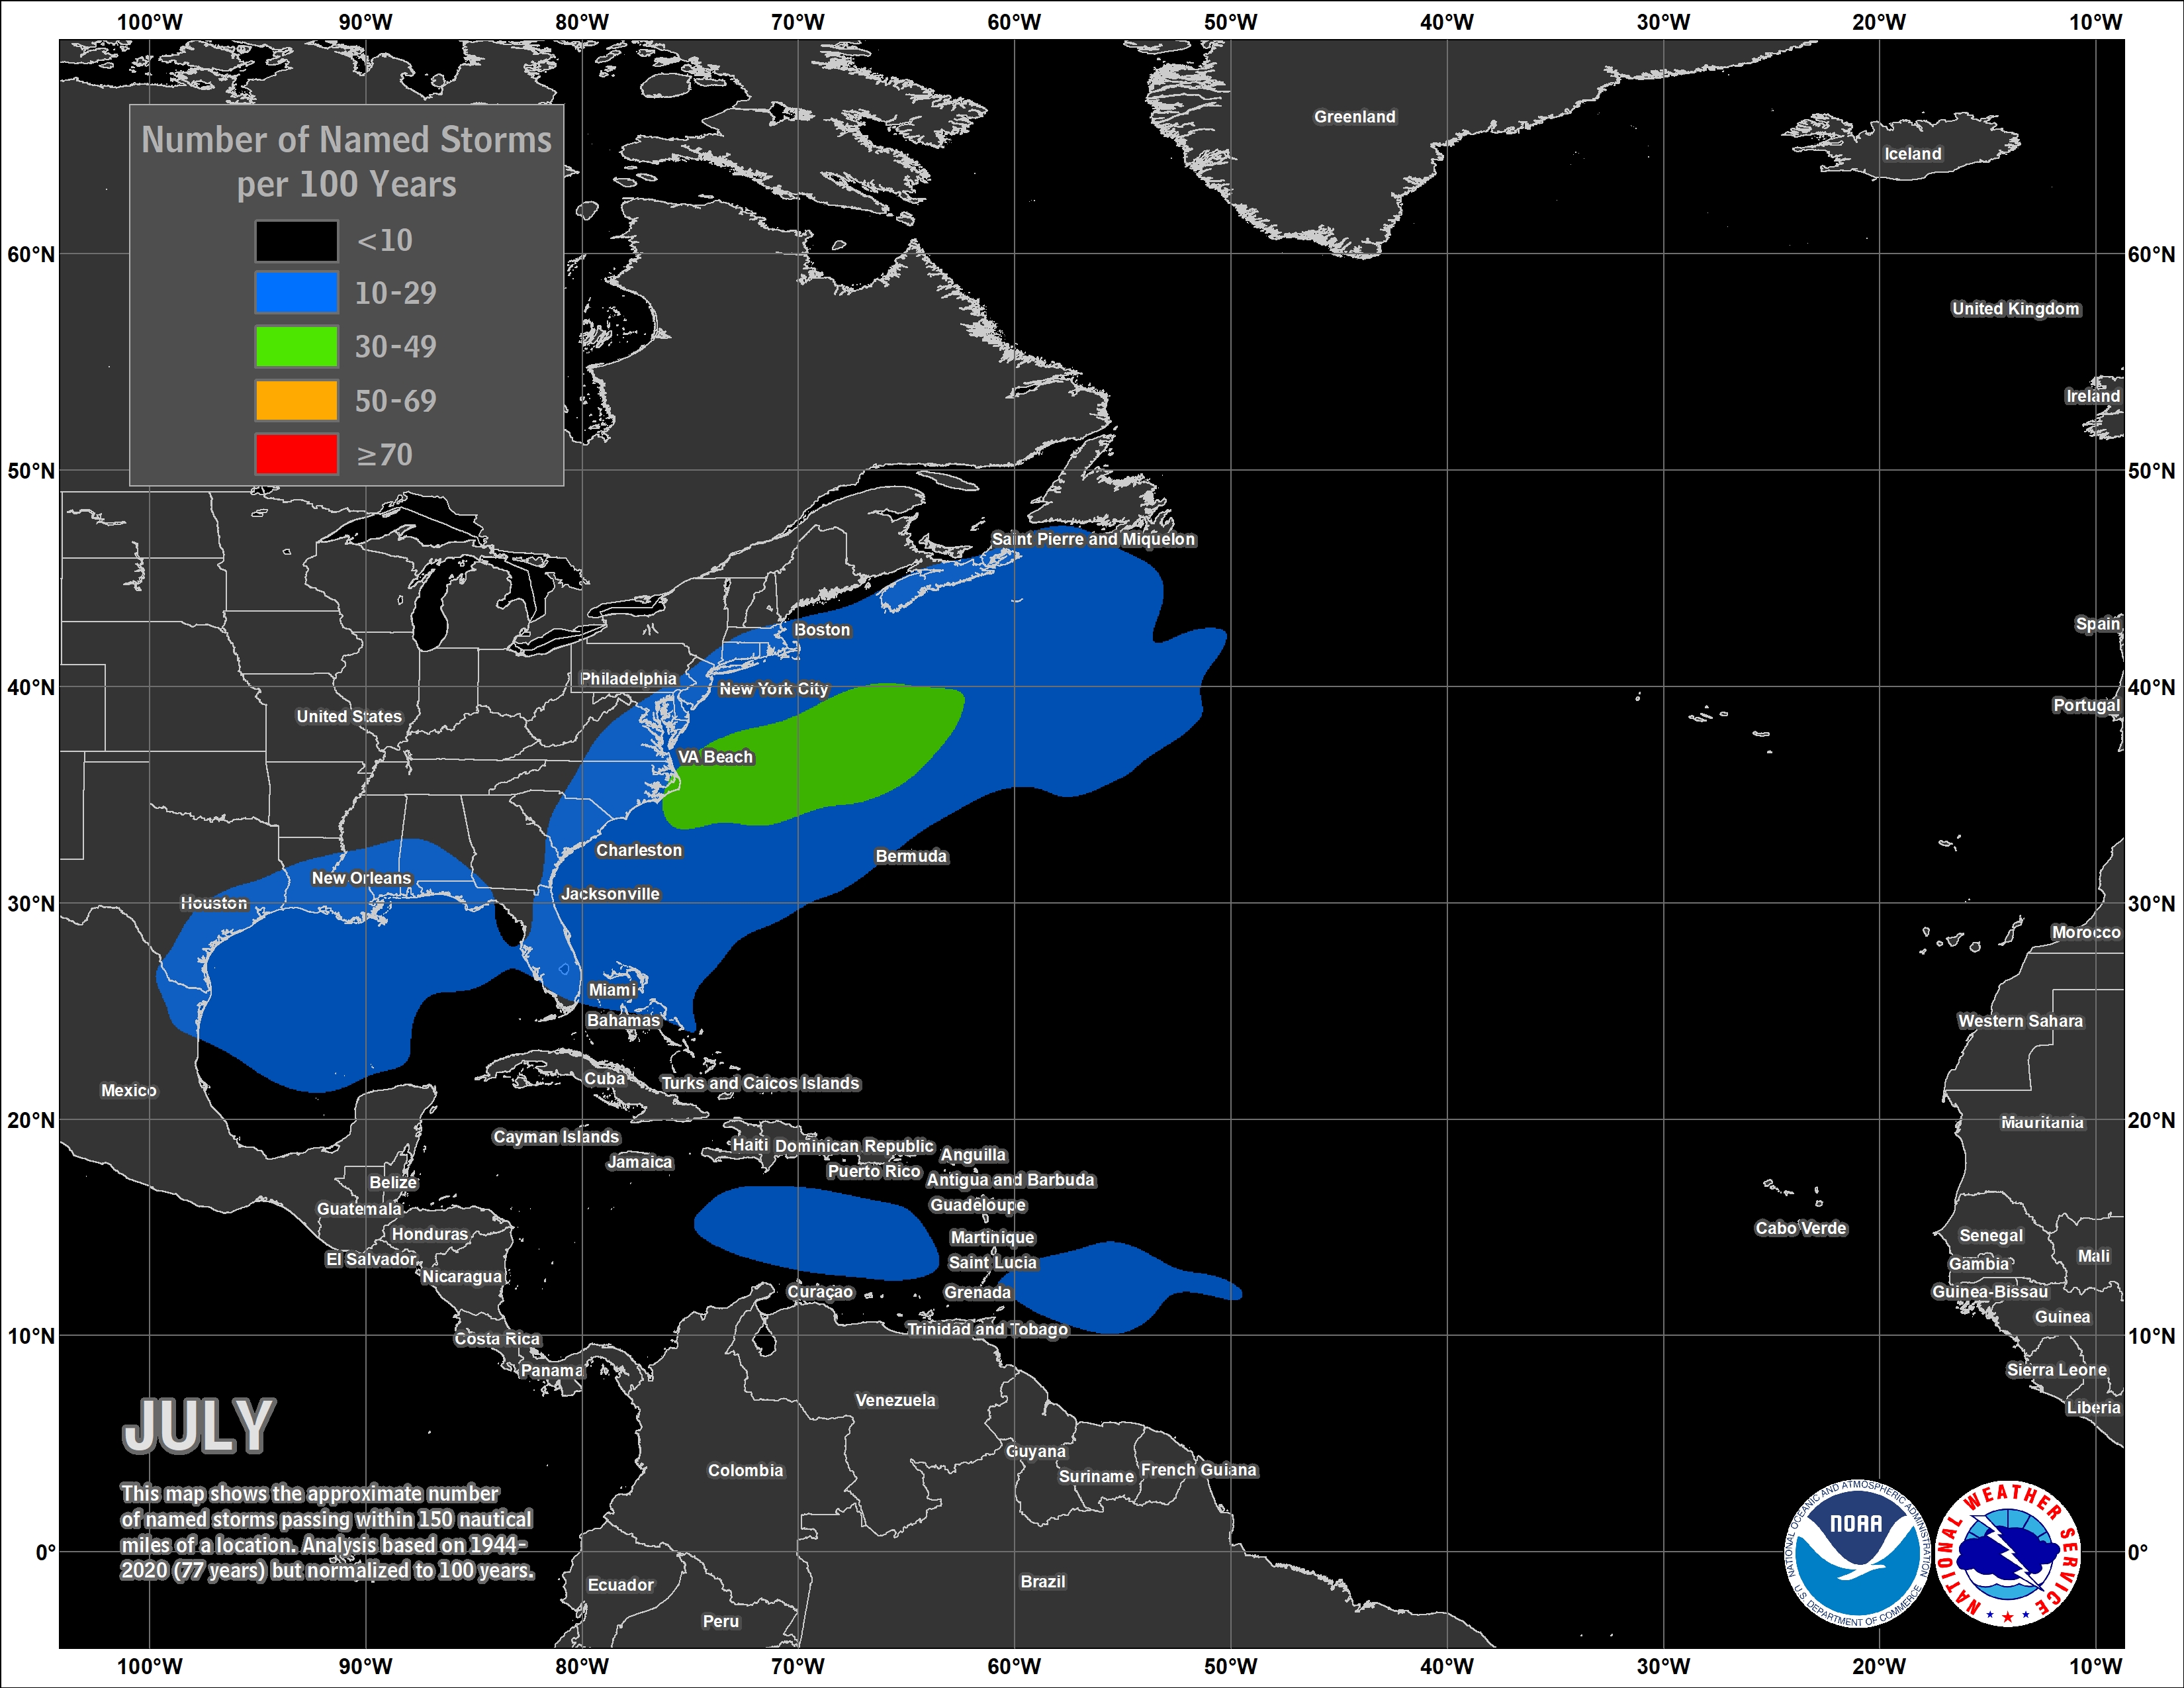
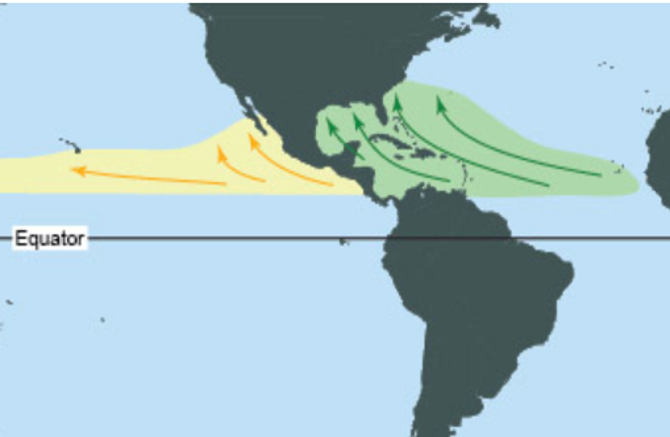
July temperatures are favored to lean above normal at 33-40% probability over the local area. A zone of above normal July precipitation is favored to be aligned from the New England States southwest across the Appalachians to the central Gulf coast. As we move into the month of July, typical development of tropical cyclones encompasses the Gulf to the western Atlantic, but begins to expand a bit eastward across the Caribbean to the western portions of the southern Atlantic Basin. The 2025 Atlantic Basin Hurricane Season Outlook is provided in the link below. It's highly encouraged to review your hurricane preparedness. Click on the Preparedness Tab on the NWS Mobile Tropical Webpage.
Click on the snap shots below to expand:
 July Normals July Normals |
|
Outlook |

|
|
|
Additional Climate Links:
The National Weather Service Mobile Alabama's Climate and Past Weather page provides climate data at your fingertips for many observation points in the local forecast area by accessing the NOWData tab as well as many other climate resources. The Climate Prediction Center Link provides short and longer range climatic outlooks and education about the larger scale global circulations that impact temperatures and weather. With the large agriculture and farming presence along the central Gulf coast, the Drought Monitor link provides updates on drought trends and impacts. Another very helpful resource is the Community Collaborative Rain Hail and Snow (CoCoRaHS) network, which is a large group of volunteers working together to measure and map precipitation (rain, hail, and snow). The aim of CoCoRaHS is to provide the highest quality data for natural resource, education and research applications. You can be a part of the CoCoRaHS team by becoming a volunteer rainfall observer.