October 2025 Climate Summaries
Mobile Alabama and Pensacola Florida Area
National Weather Service Mobile Alabama
November 4, 2025
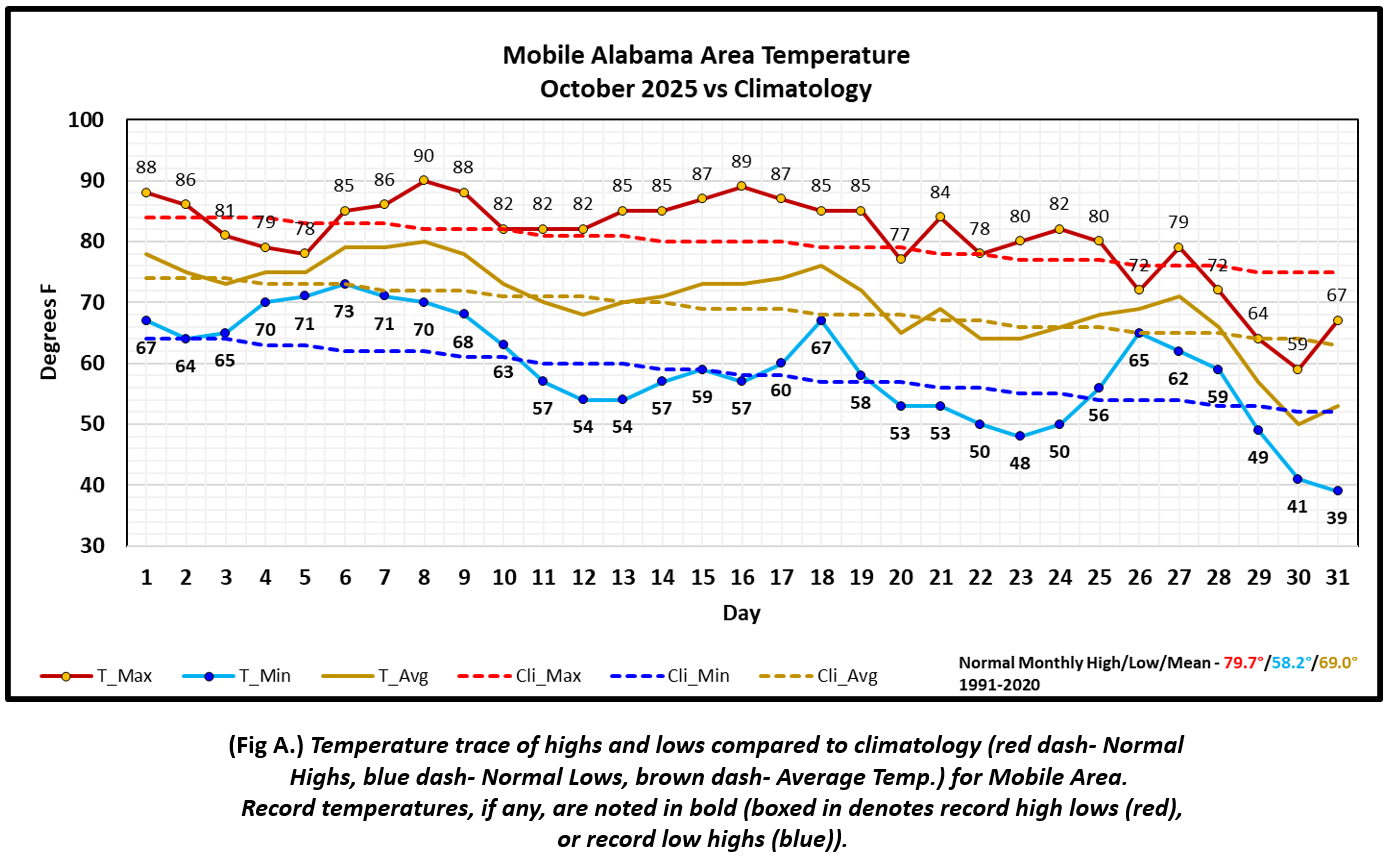
October 2025 in Review - Overall, October was typical as far as temperatures are concerned with monthly highs, lows, and averages close to what we come to expect as we begin to transition out of the summer season. A typical oscillation in highs and lows about the normal values were observed considering the occurrence of warmer periods before the southward passages of cold fronts resulted in periods of below normal temperatures. The more notable change occurred at the end of the month with both highs and lows sinking to well below normal following the passage of a strong cold front. More specifically during this time period, highs averaged 9.7° below normal at Mobile and 12.7° below normal at Pensacola from the 28th to the 31st. The coldest air of the season followed for the mornings of the 30th and 31st. Mobile plunged to 39° and Pensacola to 43°, both 13° below normal on Halloween morning.
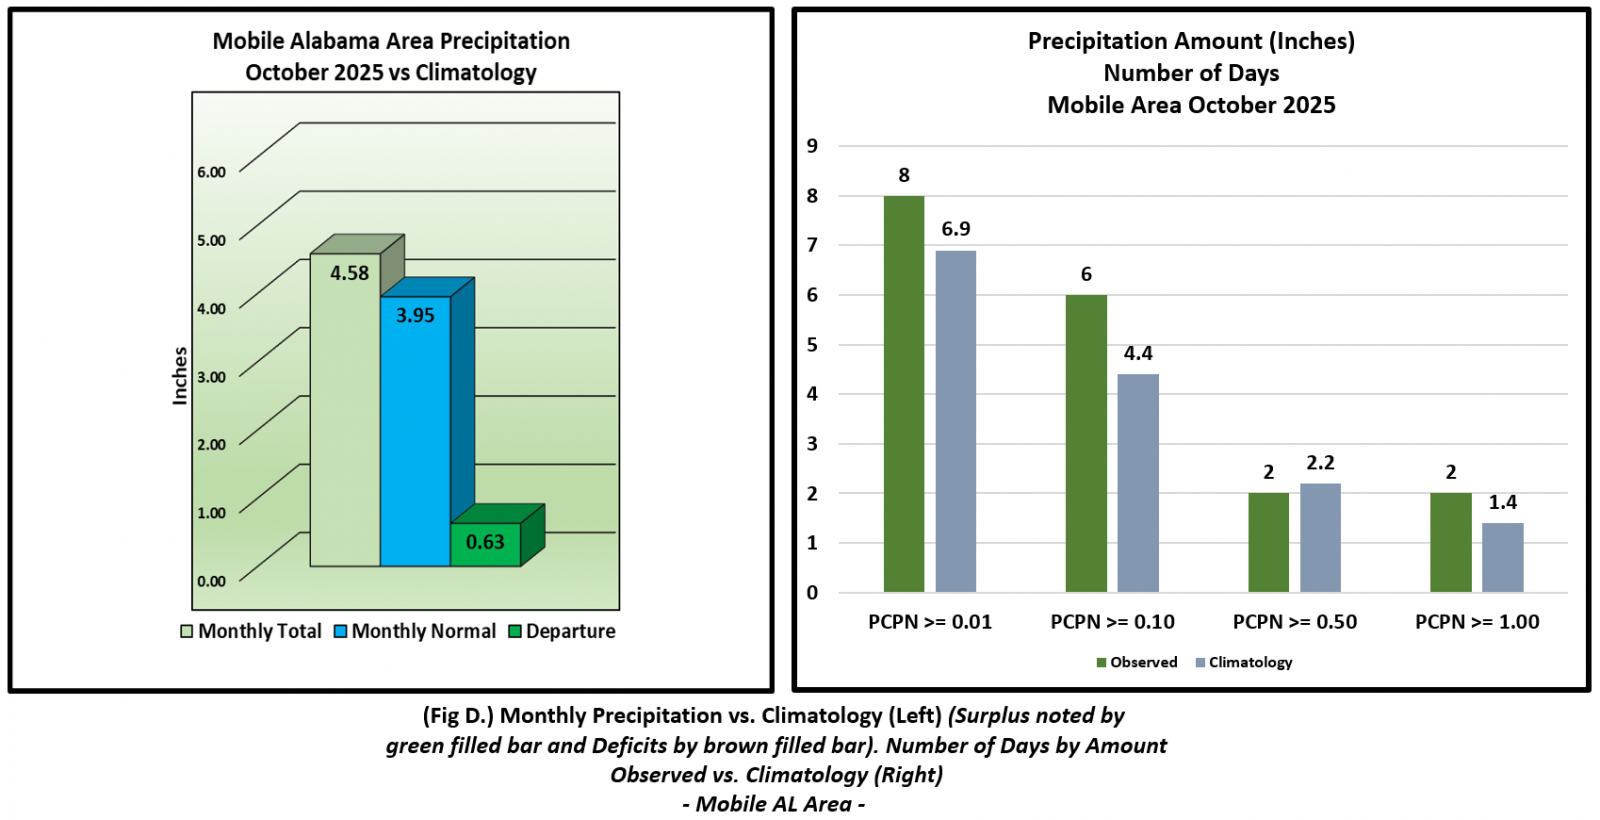
Mobile and Pensacola were both fortunate to receive enough rainfall which exceeded October monthly normal.
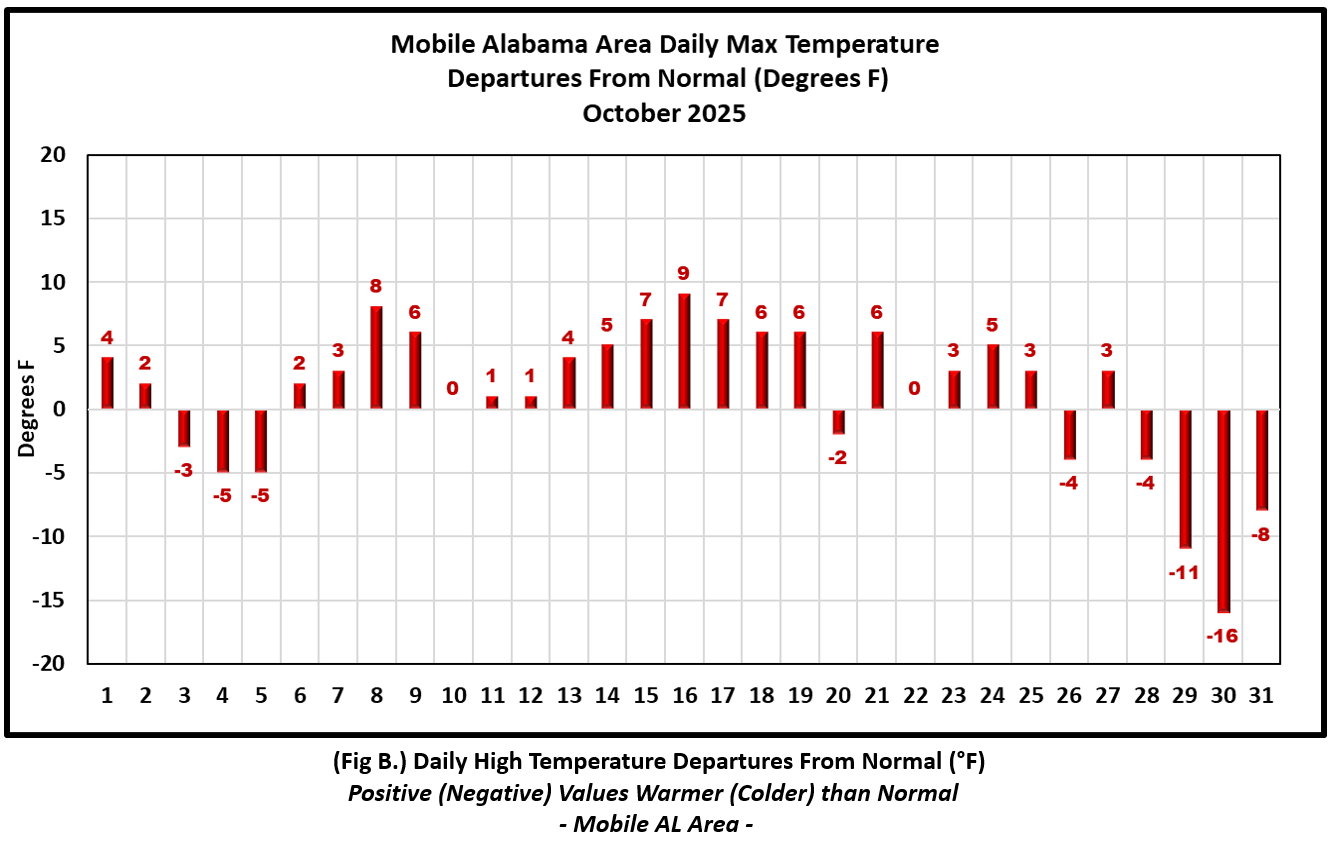
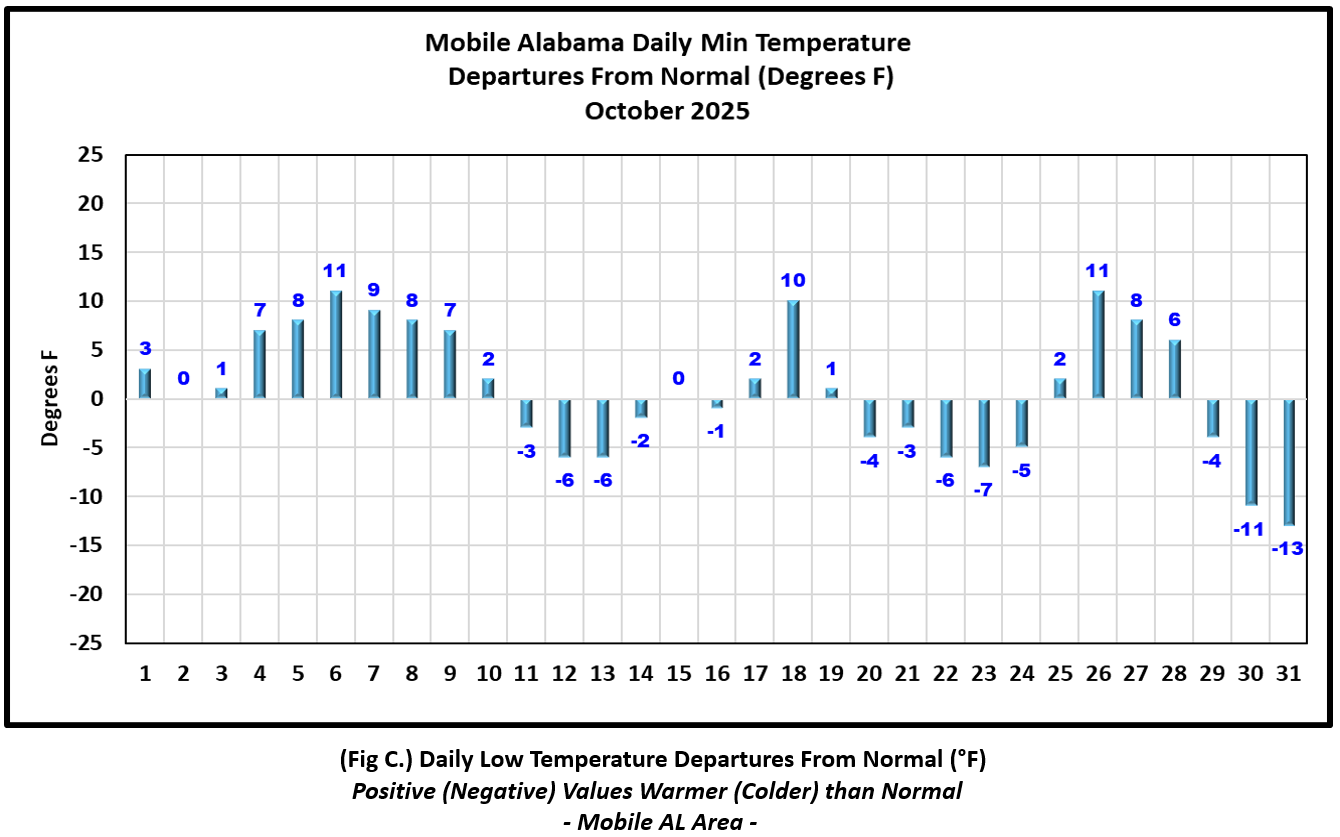
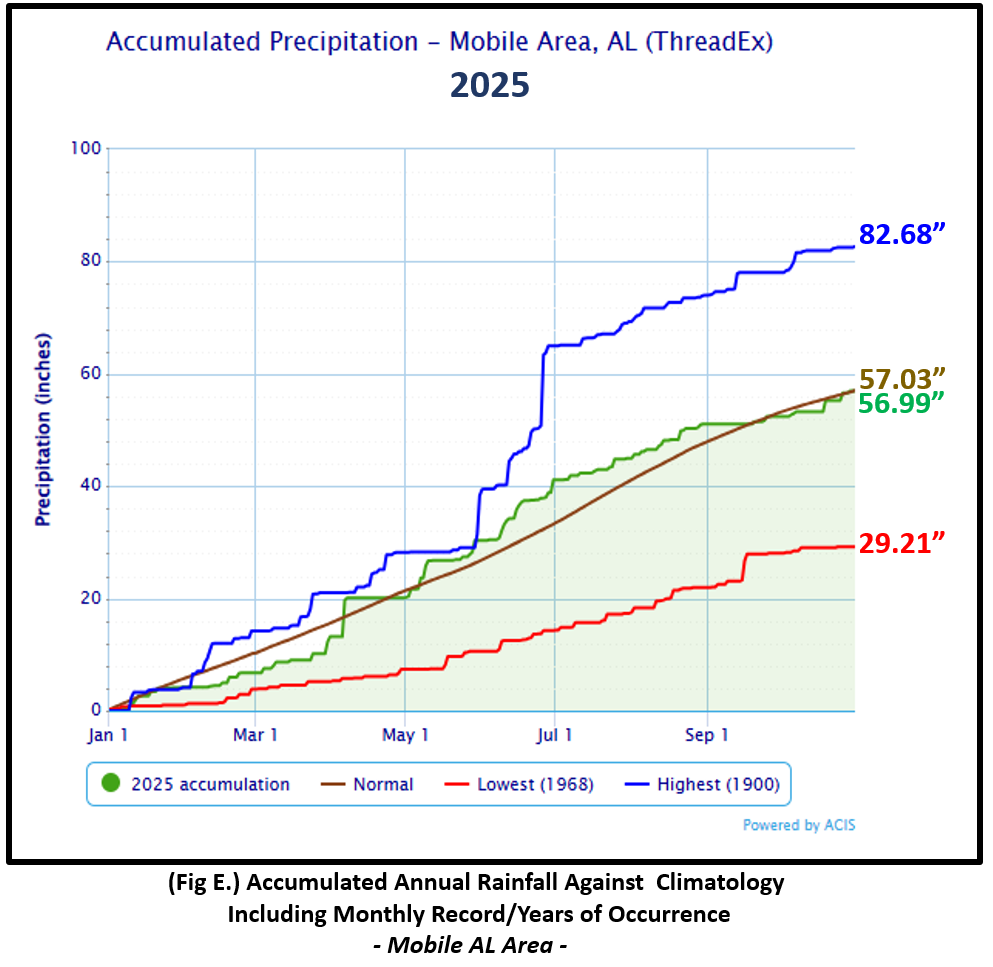
Mobile Alabama Area [Climate Normal Period 1991-2020, Climate Record Period 1872 to Present]- The average monthly high of 80.8° was 1.1° above normal. The average monthly low was 59.0° or 0.8° above normal. The average monthly temperature of 69.9° was 0.9° above normal. The highest temperature for the month was a toasty 90° by October standards occurring on the 8th and 8° above the normal for the date. The lowest temperature for the month was a crisp 39° on Halloween morning, or 13.0° below normal for this date. No new record temperatures were reached for the month. (Fig. A) shows a graphical representation of how the Mobile area temperatures compared to the seasonal normal daily highs and lows, which are shown by the colored dashed lines. Bar graphs reflecting the daily high/low temperature departures from normal are provided in the table below (Figs. B and C). Rainfall squeaked by the normal by a little over a half inch. The monthly total gauge catch was 4.58" (Fig. D) or 0.63" above the monthly normal. Annual rainfall is just about right on top of normal, 0.04" shy of normal for the Mobile area. (Fig. E)
October top records for the month during the Period of Record for the Mobile Area:
Click on the Mobile Alabama area climate graphics below to expand:
|
|
|
|
|
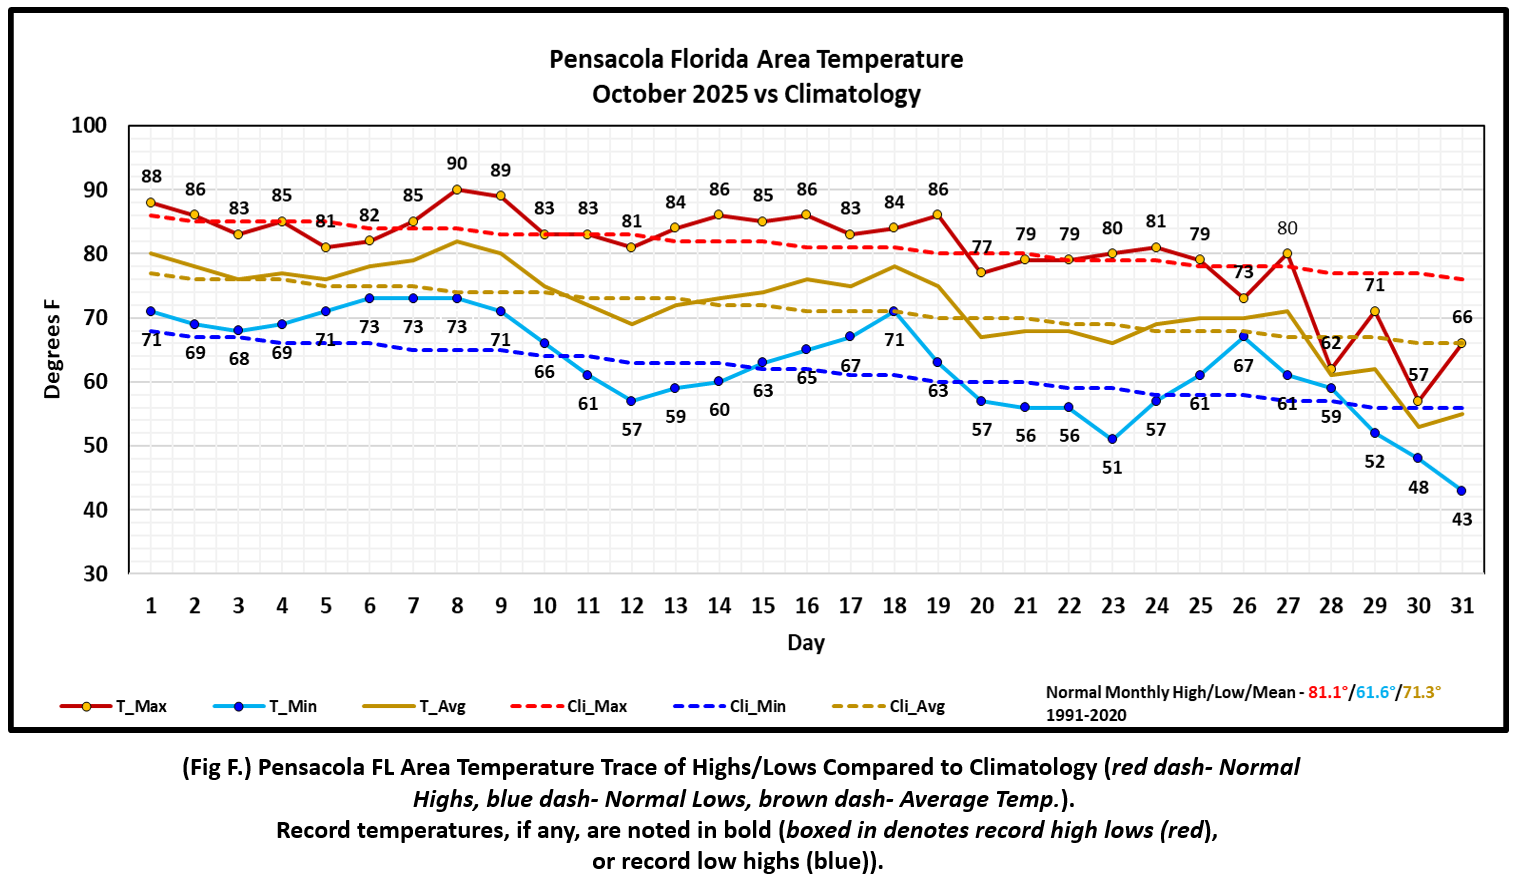
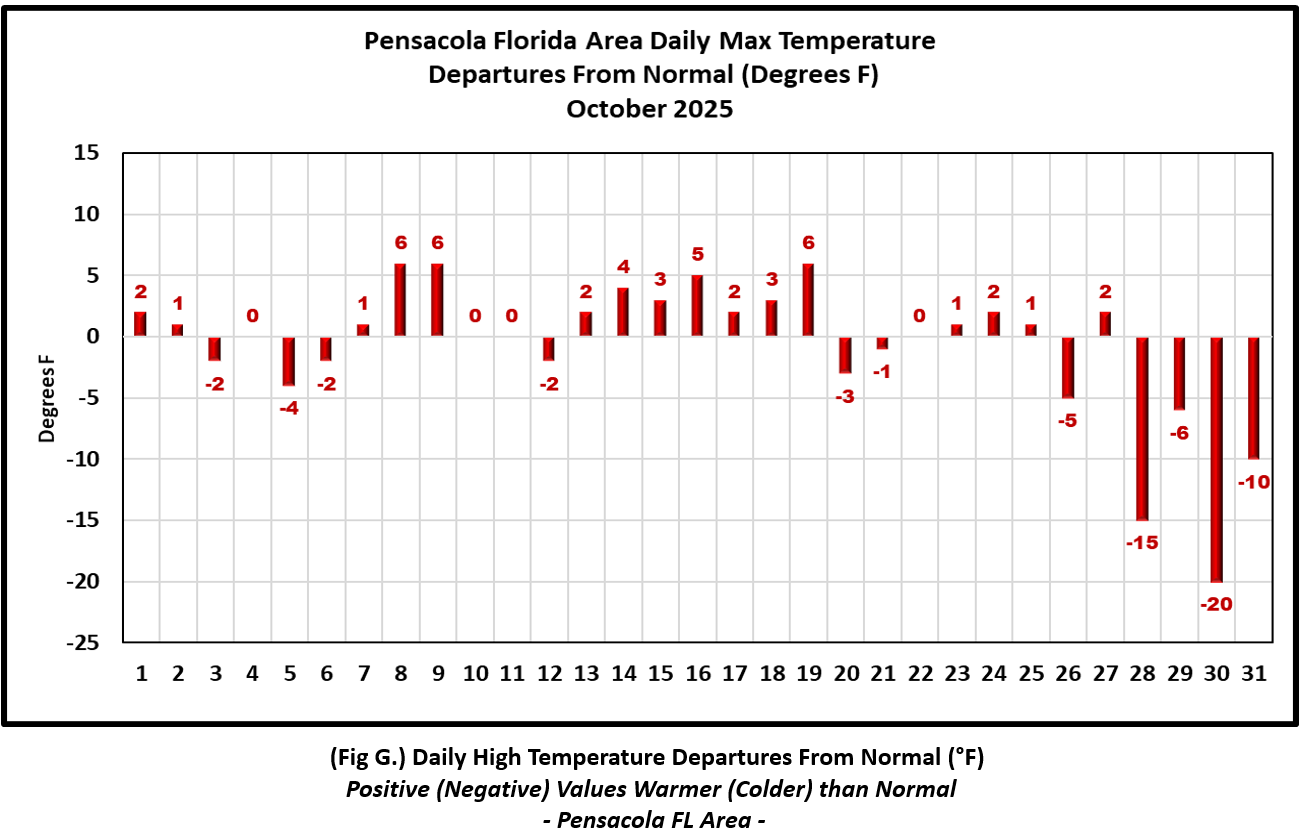
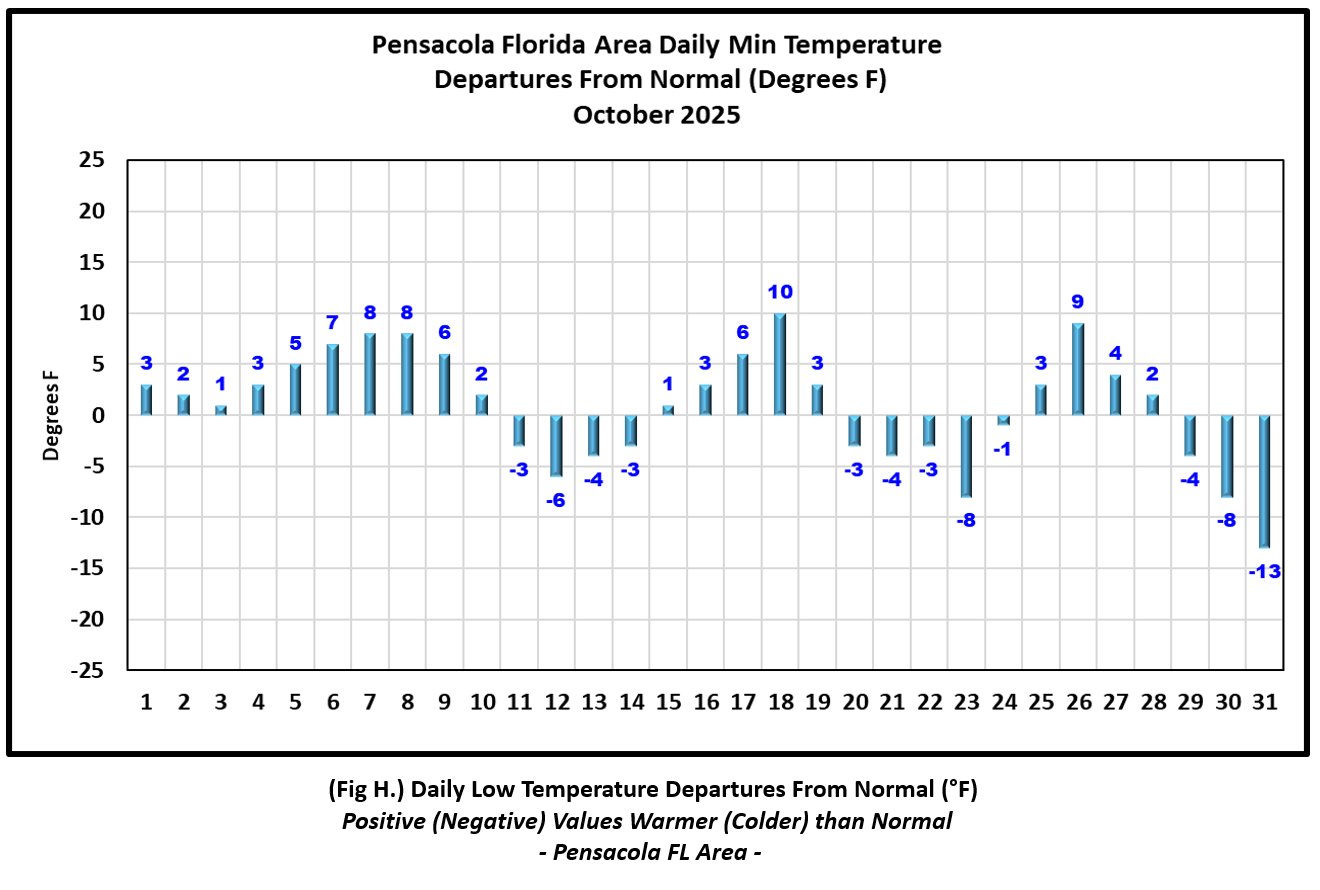
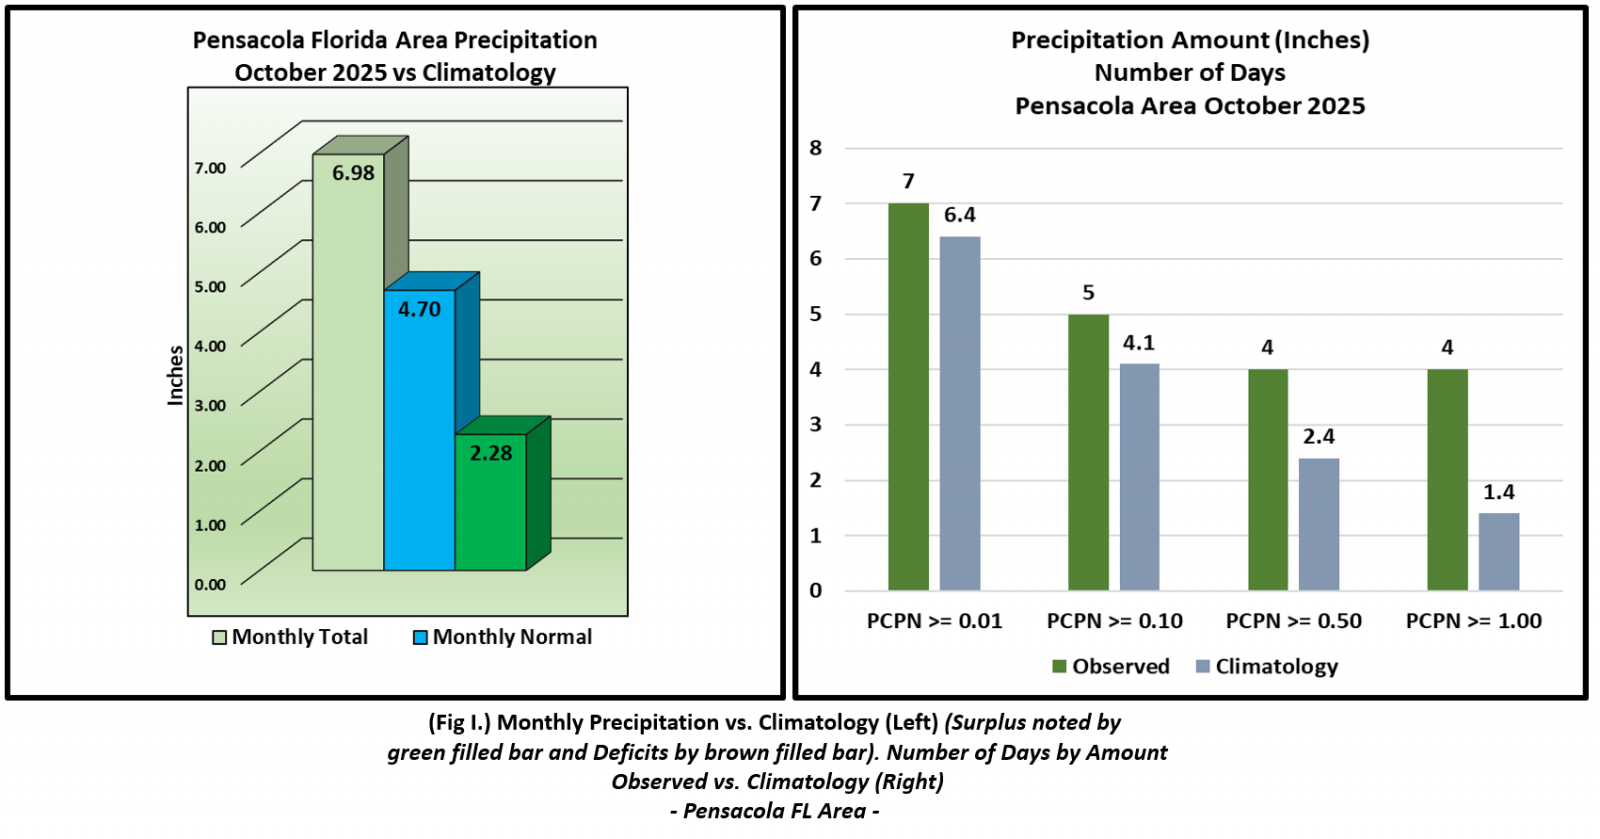
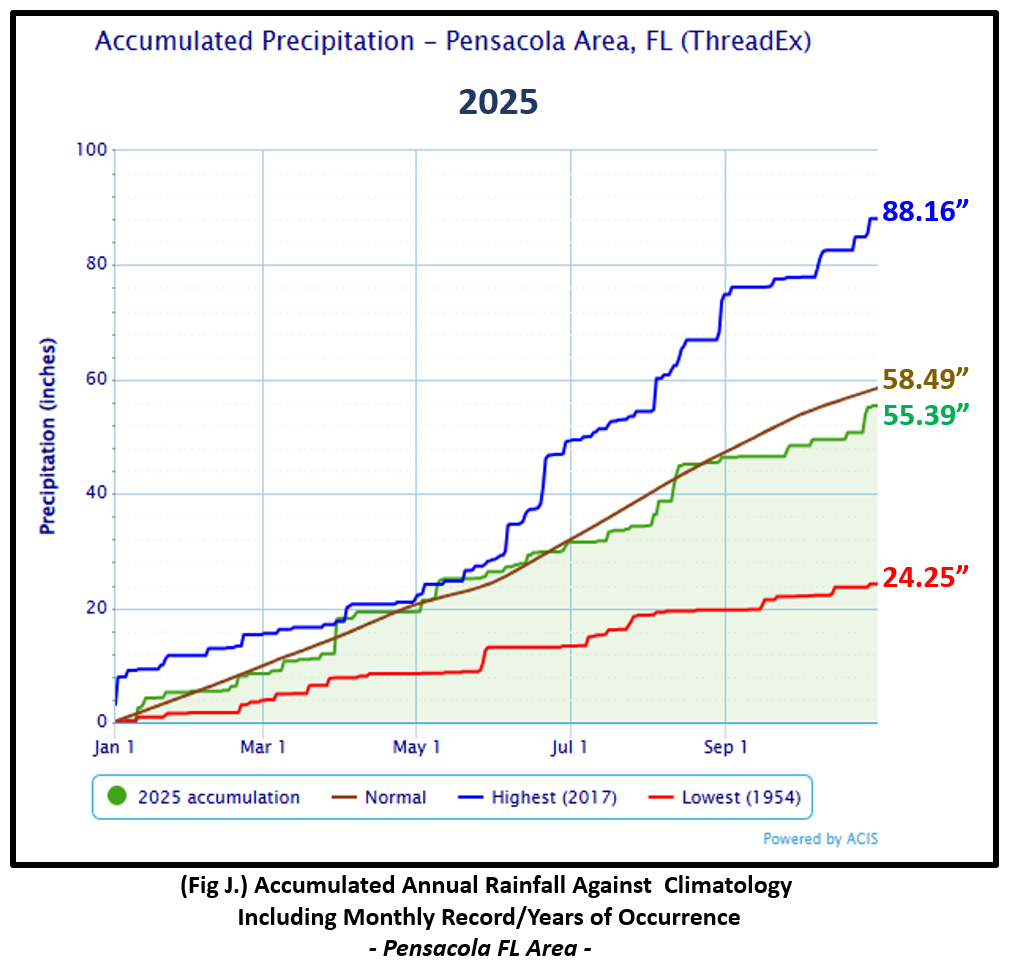
Pensacola Florida Area [Climate Normal Period 1991-2020, Climate Record Period 1879 to Present] - The average monthly high of 80.5° was 0.6° below normal. The average monthly low was 62.5° was 0.9° above normal. The average monthly temperature of 71.5° was 0.2° above normal. Same as Mobile, the highest temperature for the month was 90° on the 8th, 6° above the normal daily high temperature for the date. The lowest temperature for the month was a chilly, 43° on Halloween morning, 13° below the normal daily low temperature for this date. No new record temperatures were reached at Pensacola. (Fig. F) shows a graphical representation of how the Pensacola area temperatures compared to the seasonal normal daily highs and lows, which are shown by the colored dashed lines. (Figs. G and H) shows the daily high/low temperature departures from normal. Portions of the immediate coast saw some excessive rains for October and the footprint of higher rain tallies extended eastward into Pensacola where monthly rainfalls ended in a surplus by over two inches. Gauge catch totaled over a half foot at 6.98" (Fig. I), or 2.28" above the monthly normal. Despite this much needed rainfall, a deficit in annual rainfall remains at Pensacola now at 3.10" below normal to date. (Fig. J).
October top records for the month during the Period of Record for the Pensacola Area:
Click on the Pensacola Florida area climate graphics below to expand:
|
|
|
|
|
Additional October 2025 Climatology and Topics
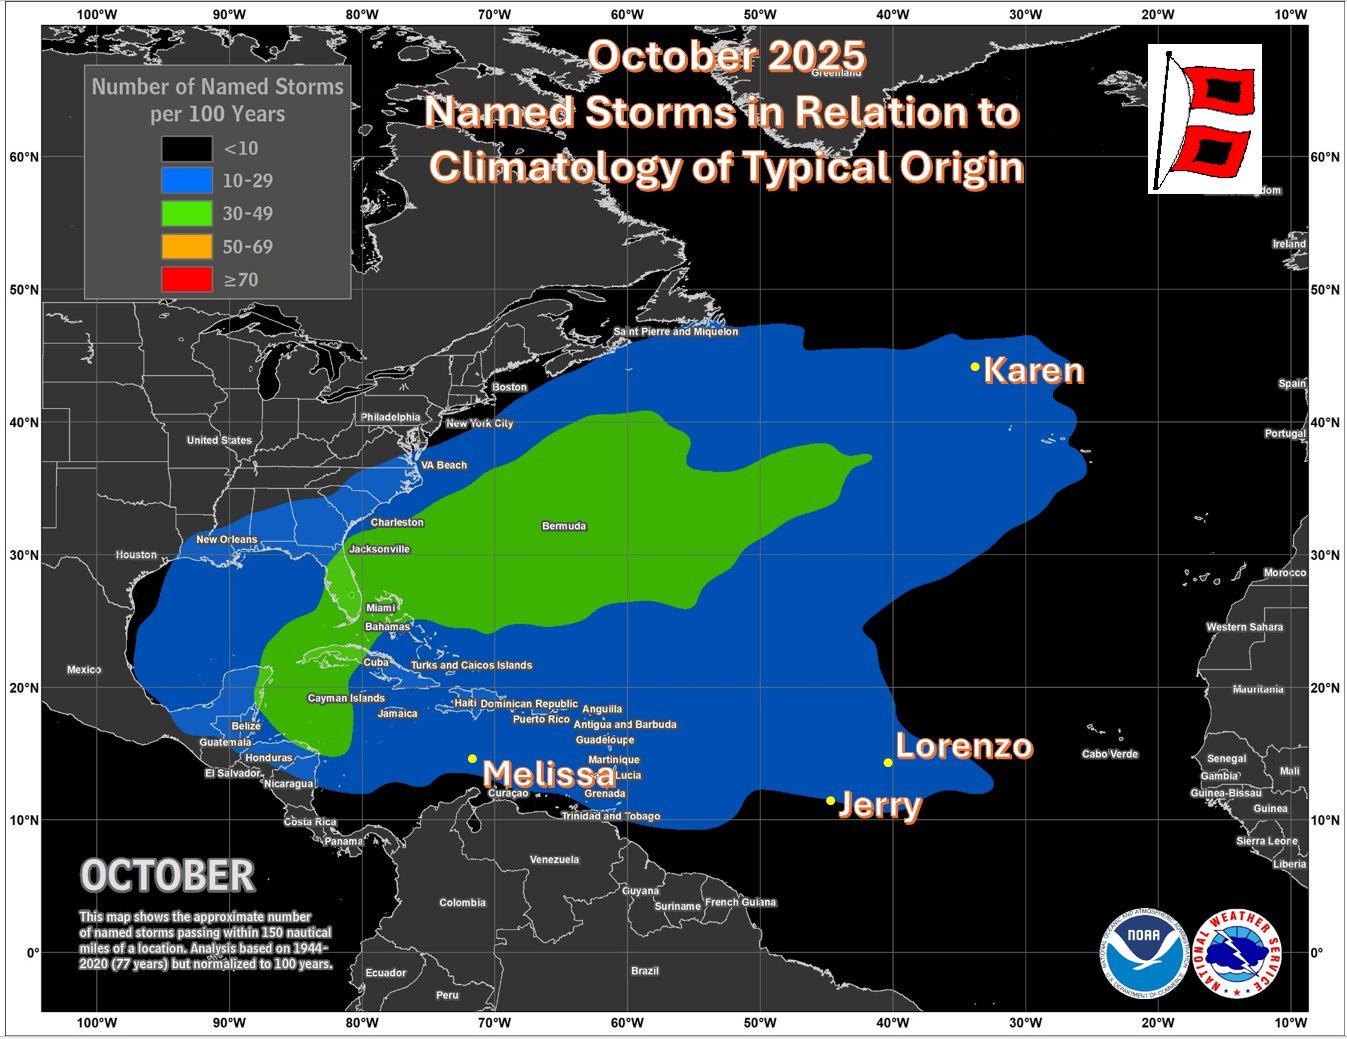
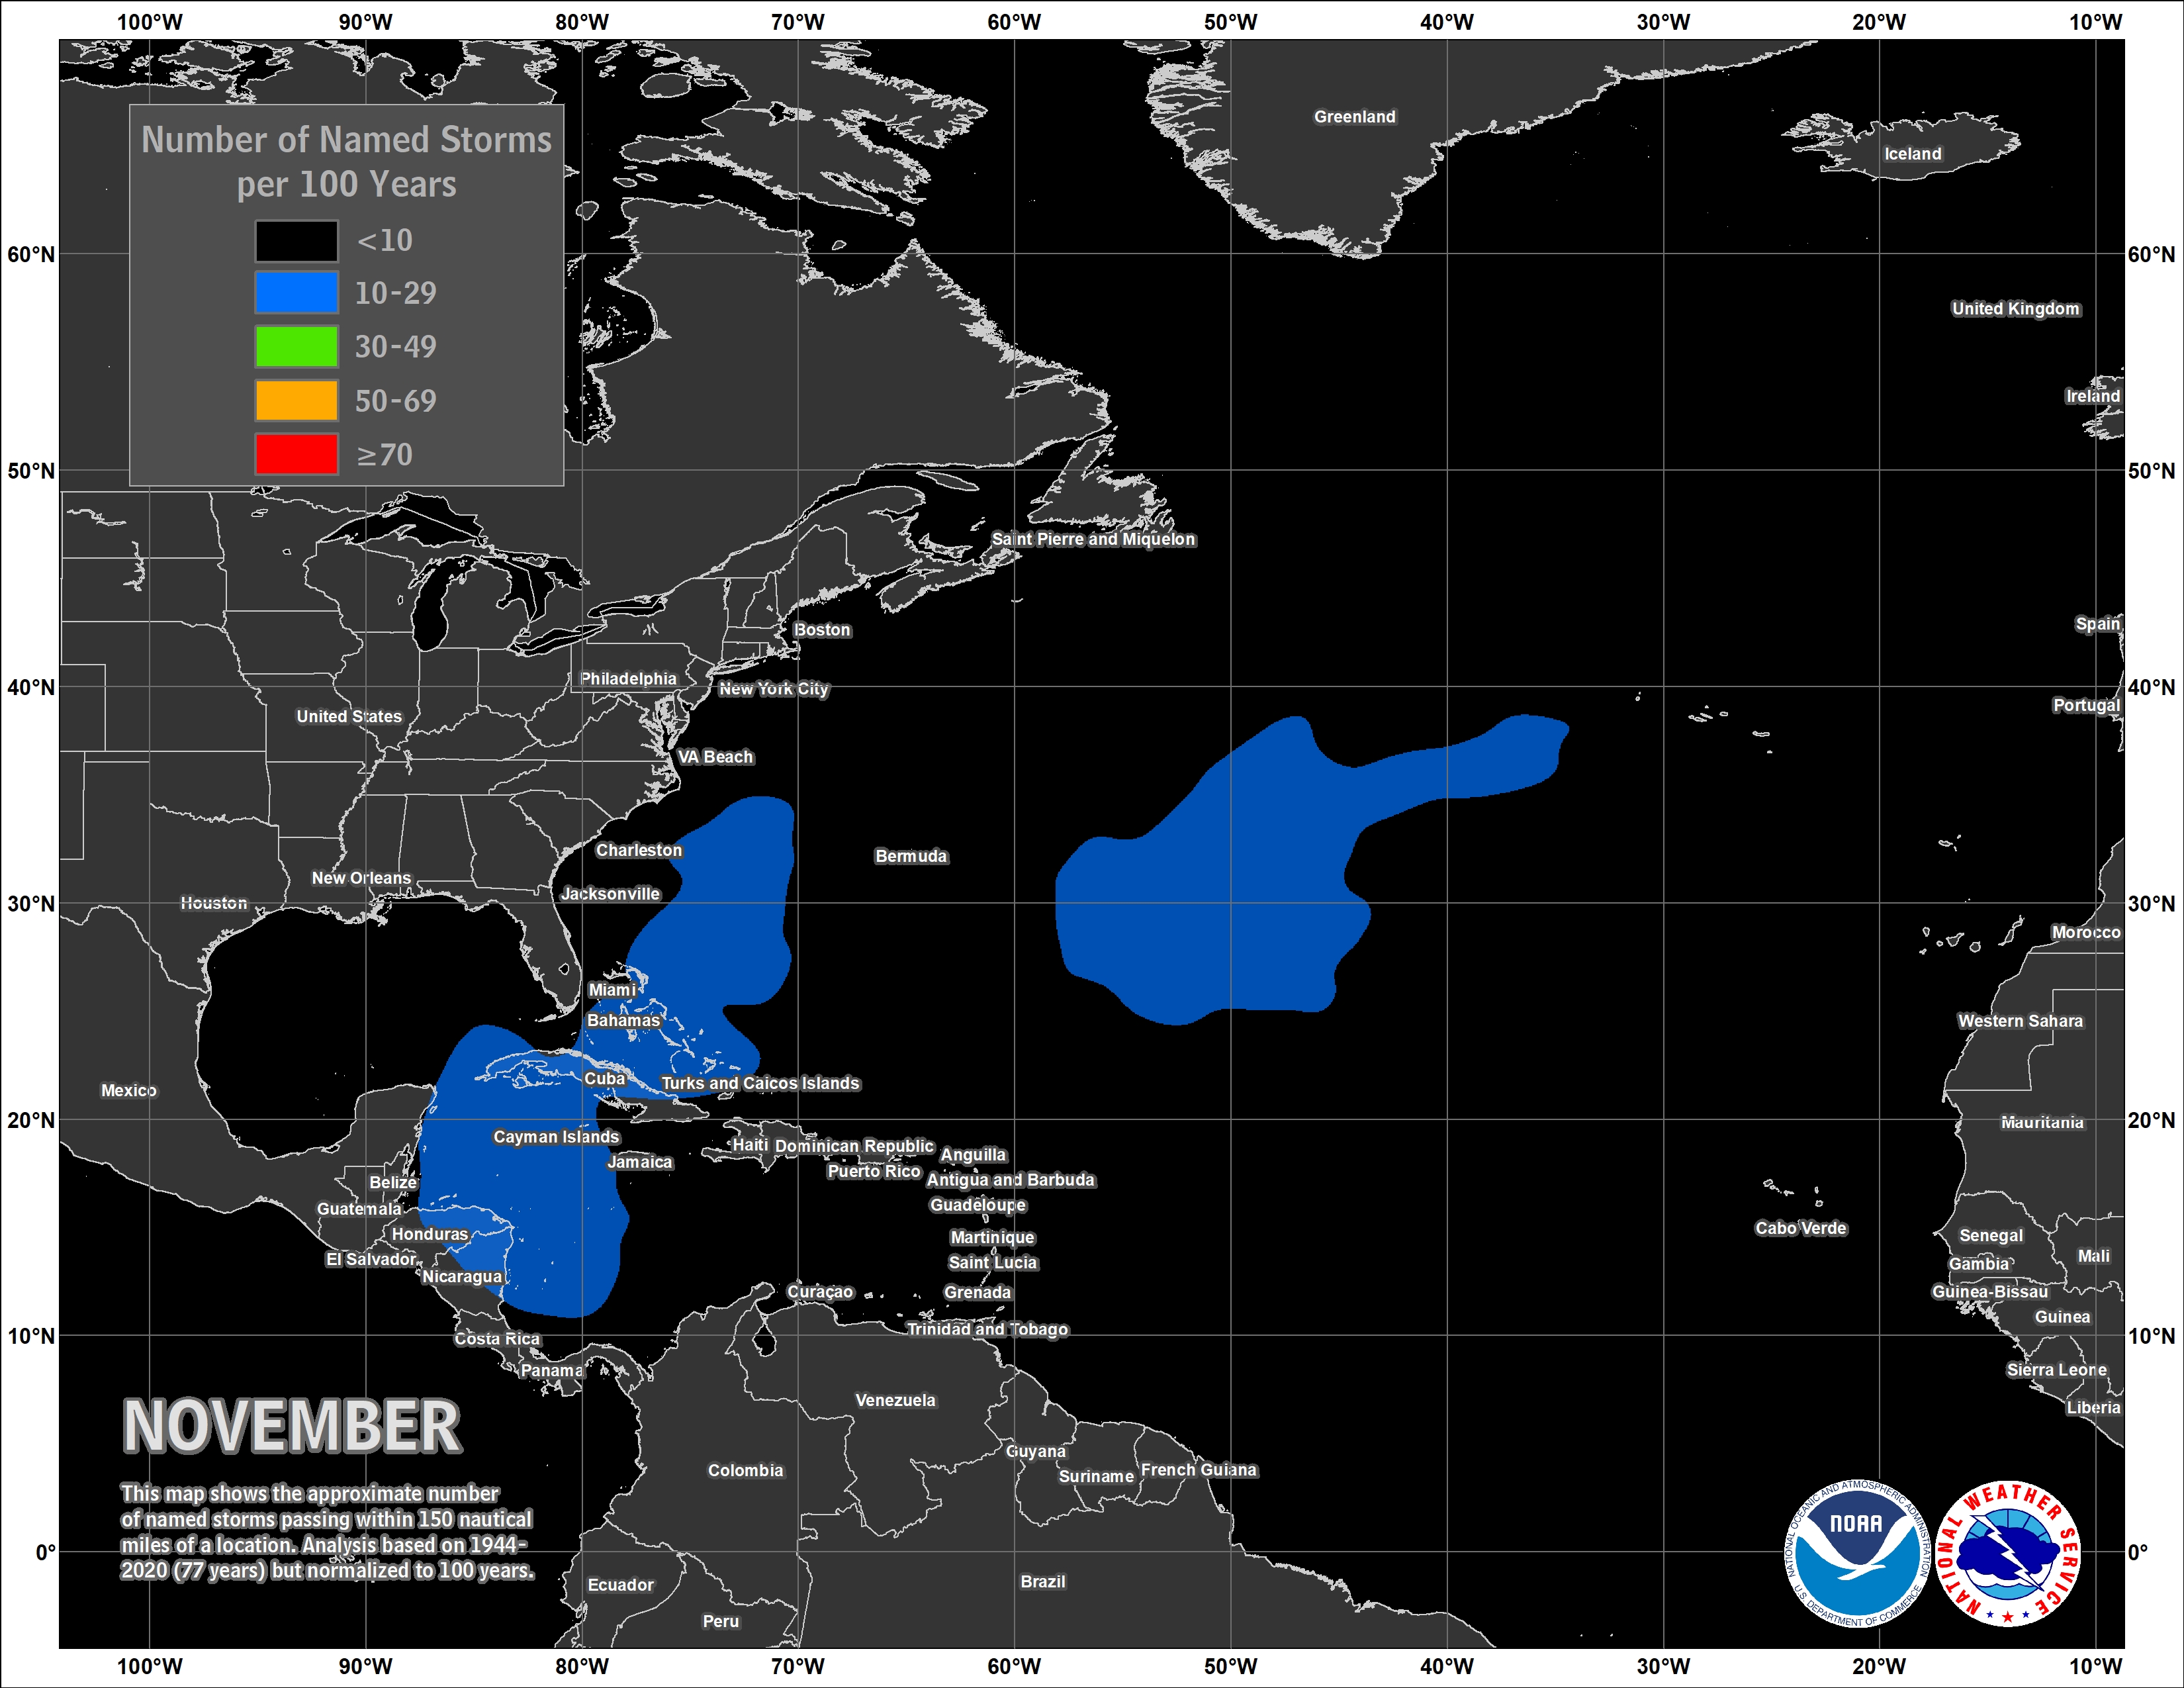
Portions of the central Gulf coast from coastal Mobile County, eastward across southern Baldwin County Alabama into coastal Escambia and Santa Rosa Counties in northwest Florida were the rainfall bright spots, seeing the heaviest amounts of the month. Wayne County Mississippi was the other area that saw an uptick in monthly rains. Southern Baldwin County to across the Perdido River areas saw a whopping 200 to 400% of monthly normal rains. (Fig. K) shows the areal monthly rainfall total, (Fig. L) shows the areal rainfall departures from normal and (Fig. M), the areal percent of normal rainfall. Much of the remainder of the area was short of monthly normal rainfall and with that came worsening drought conditions throughout the month (Fig. N). The Atlantic Basin saw four named storms Tropical Storm Jerry, Subtropical Storm Karen, Tropical Storm Lorenzo and Hurricane Melissa, (Fig. O), Considering these storms, a total of 13 named storms have formed in the Atlantic Basin for 2025, which verifies the long range outlook for number of named storms ranging from 13 to 19.
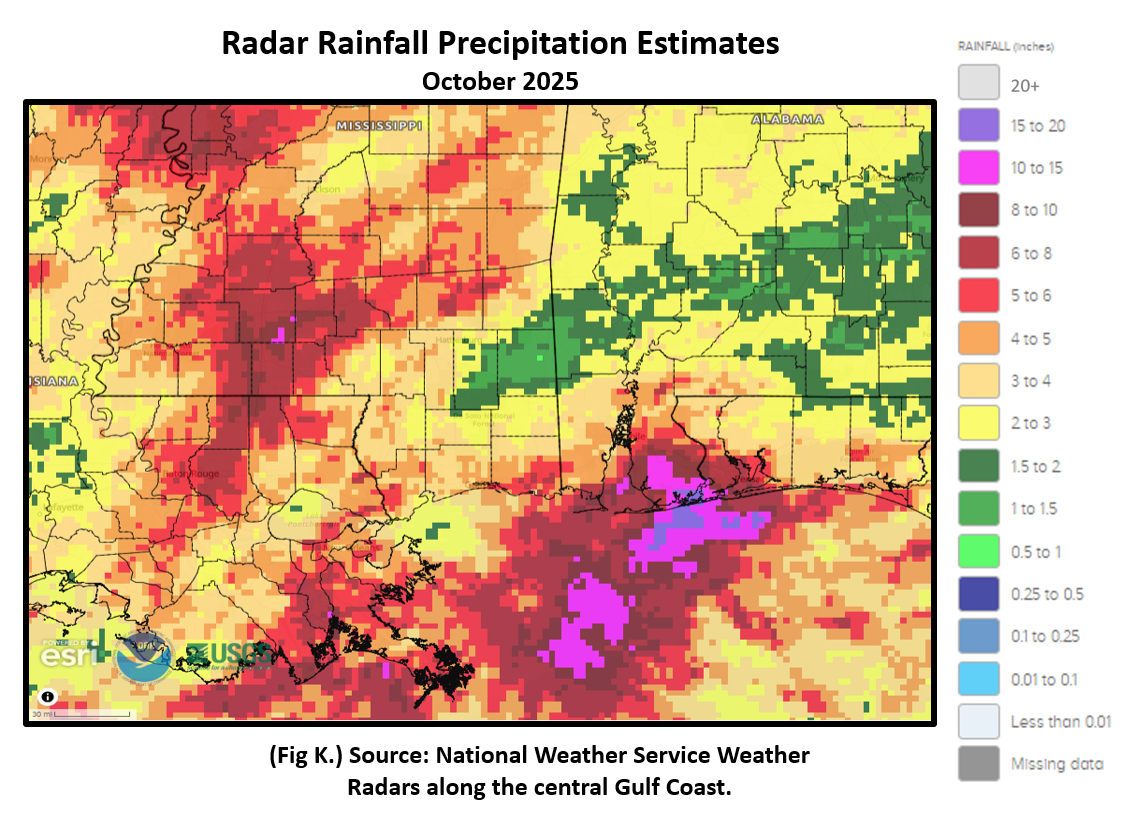 Figure K. Figure K. |
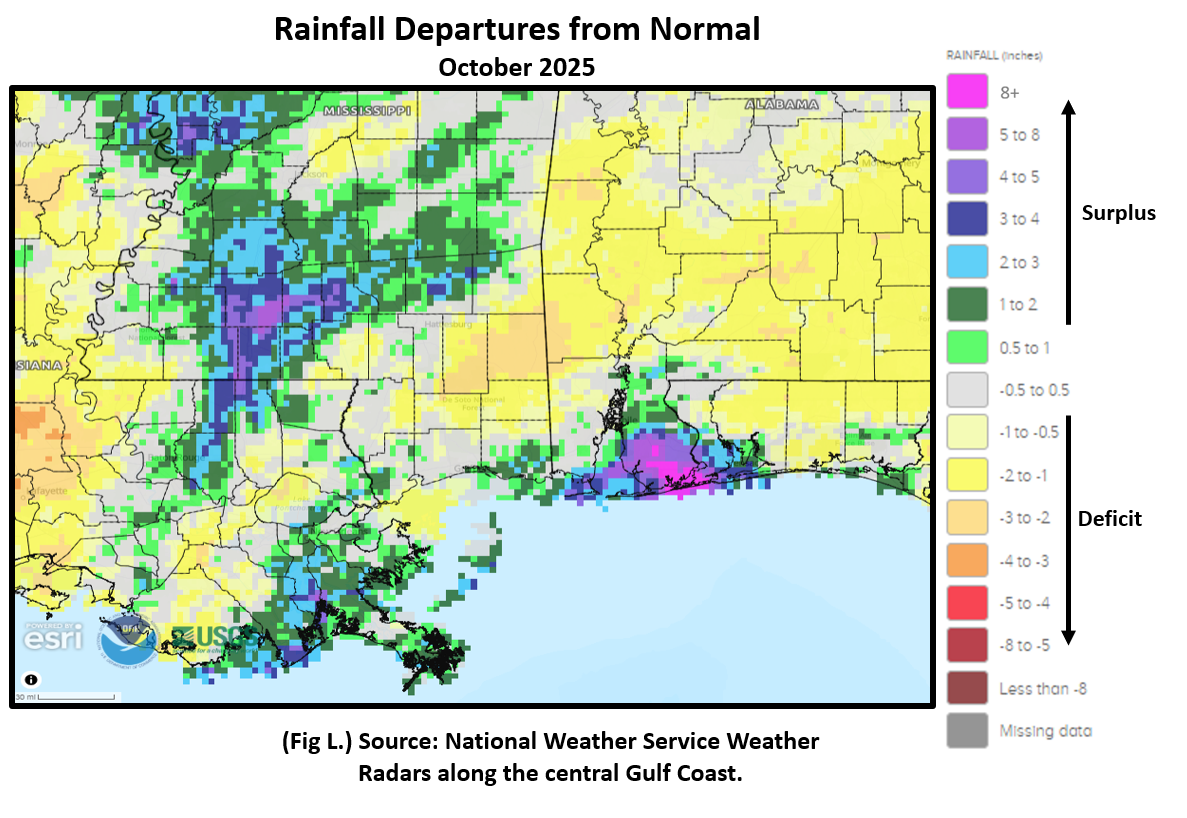 Figure L. Figure L. |
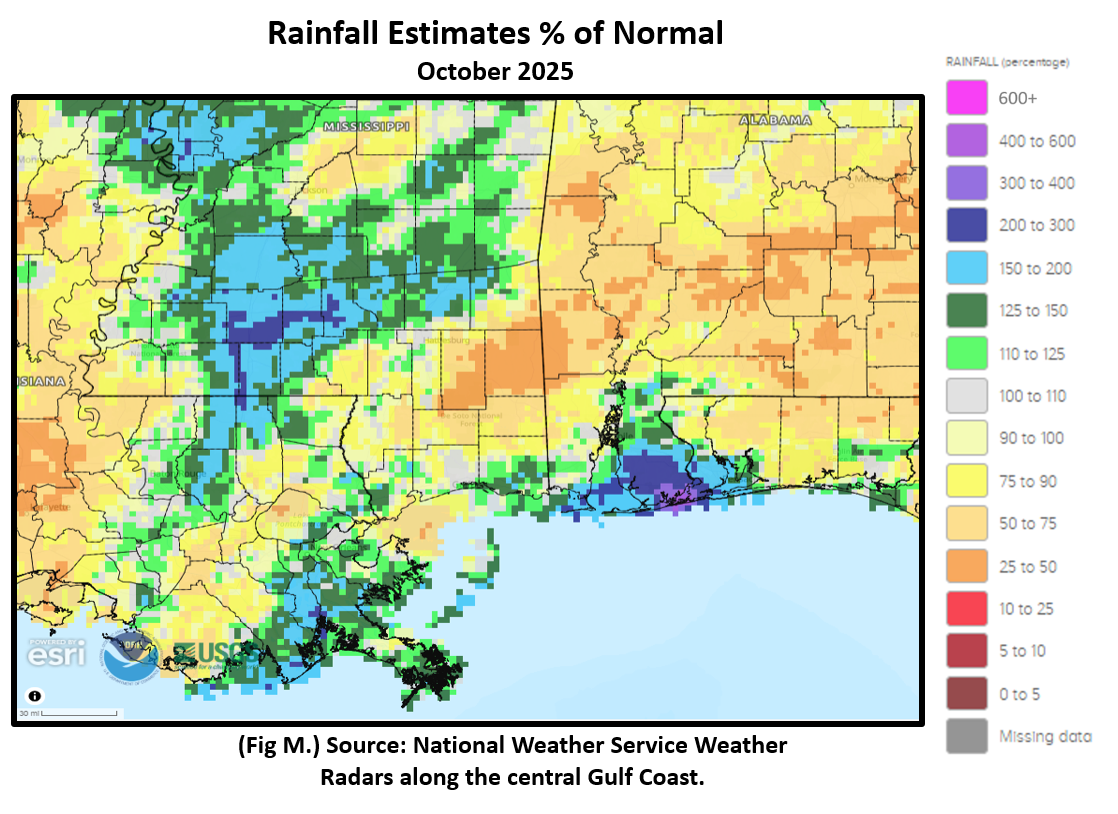 Figure M. Figure M. |
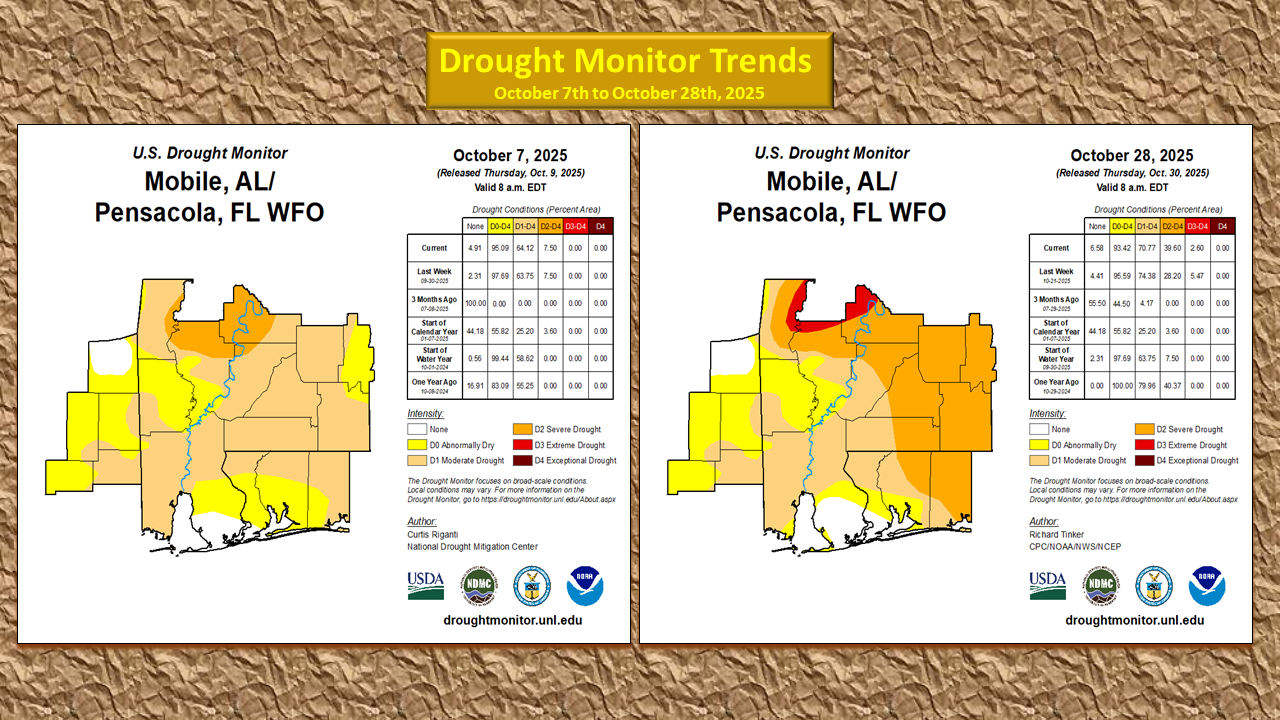 Figure N. Figure N. |
|
November 2025 Climatology, Seasonal Climatology and Outlooks:
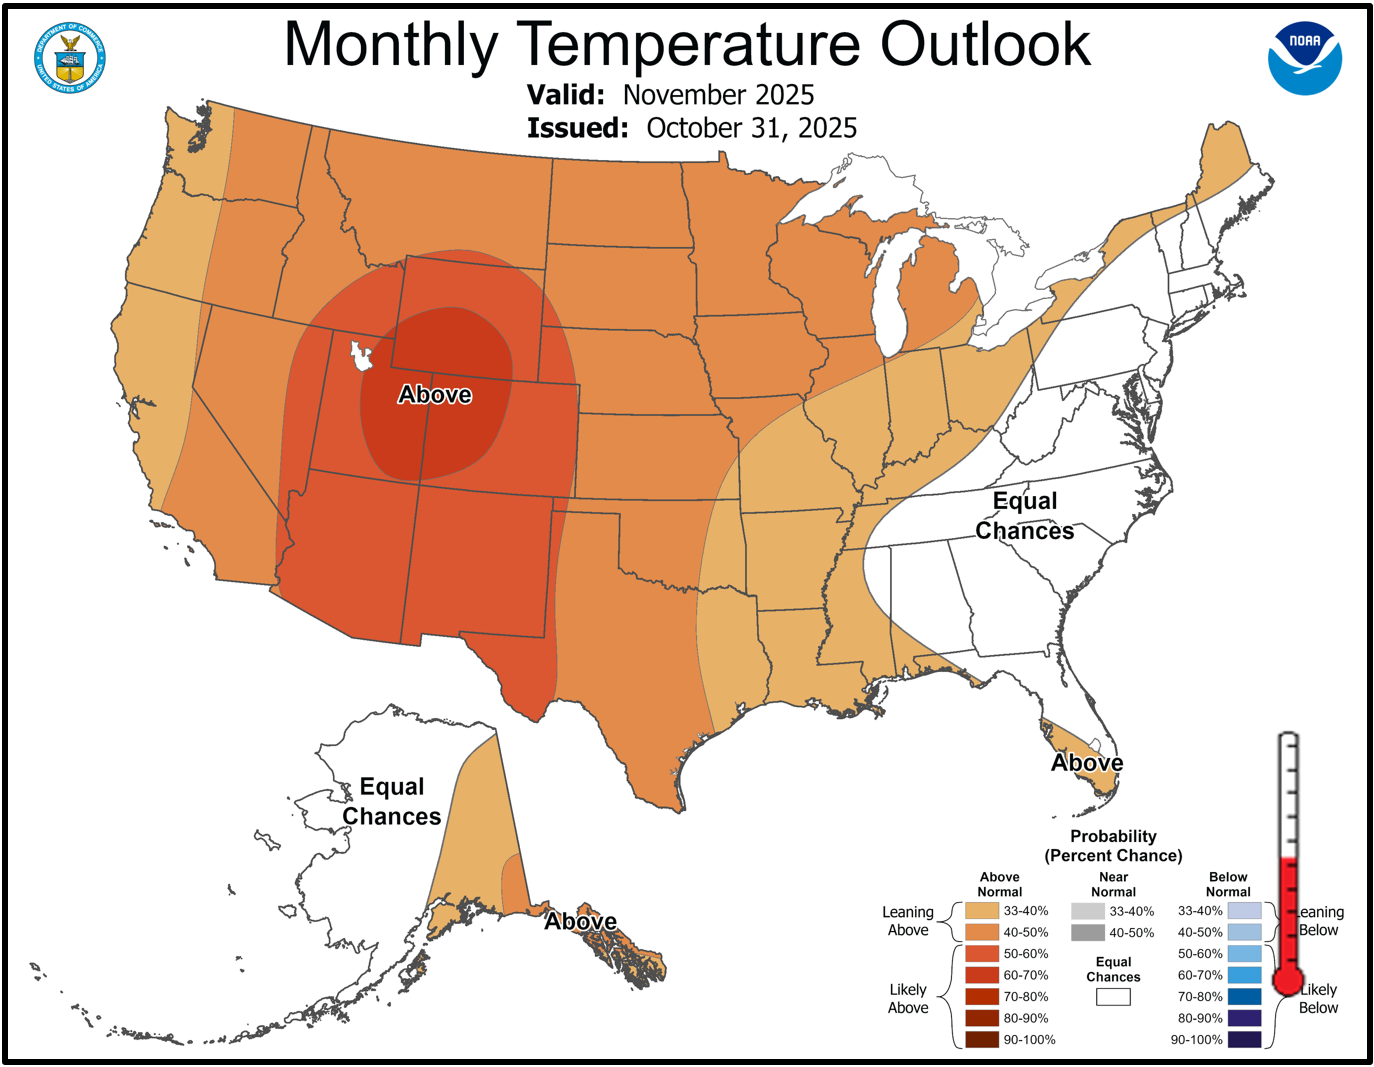
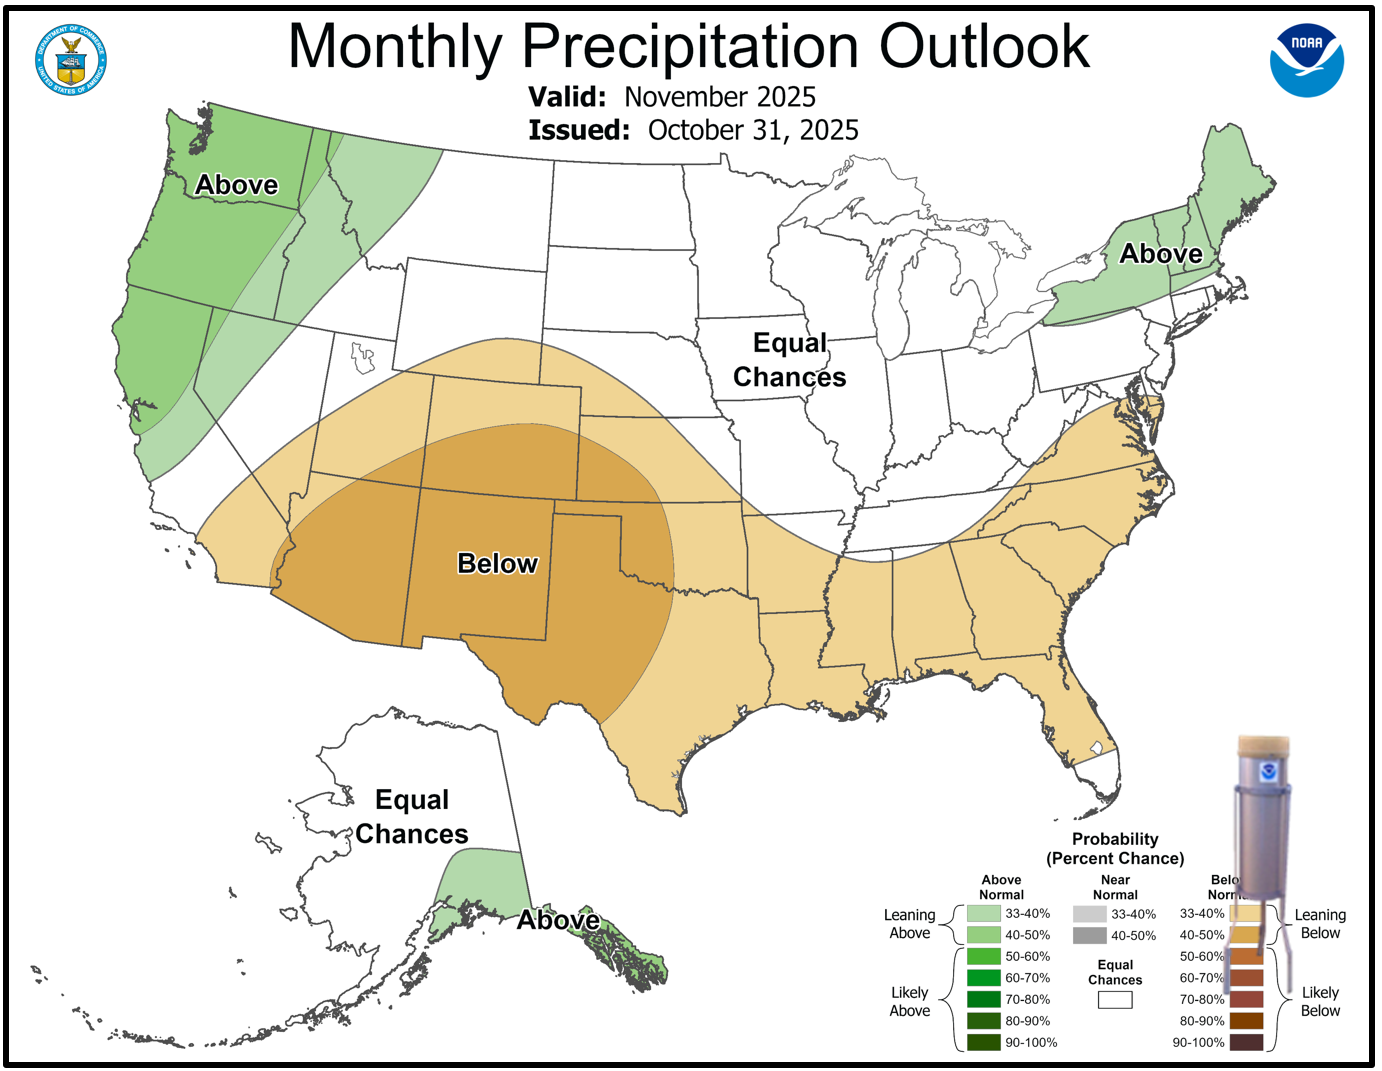
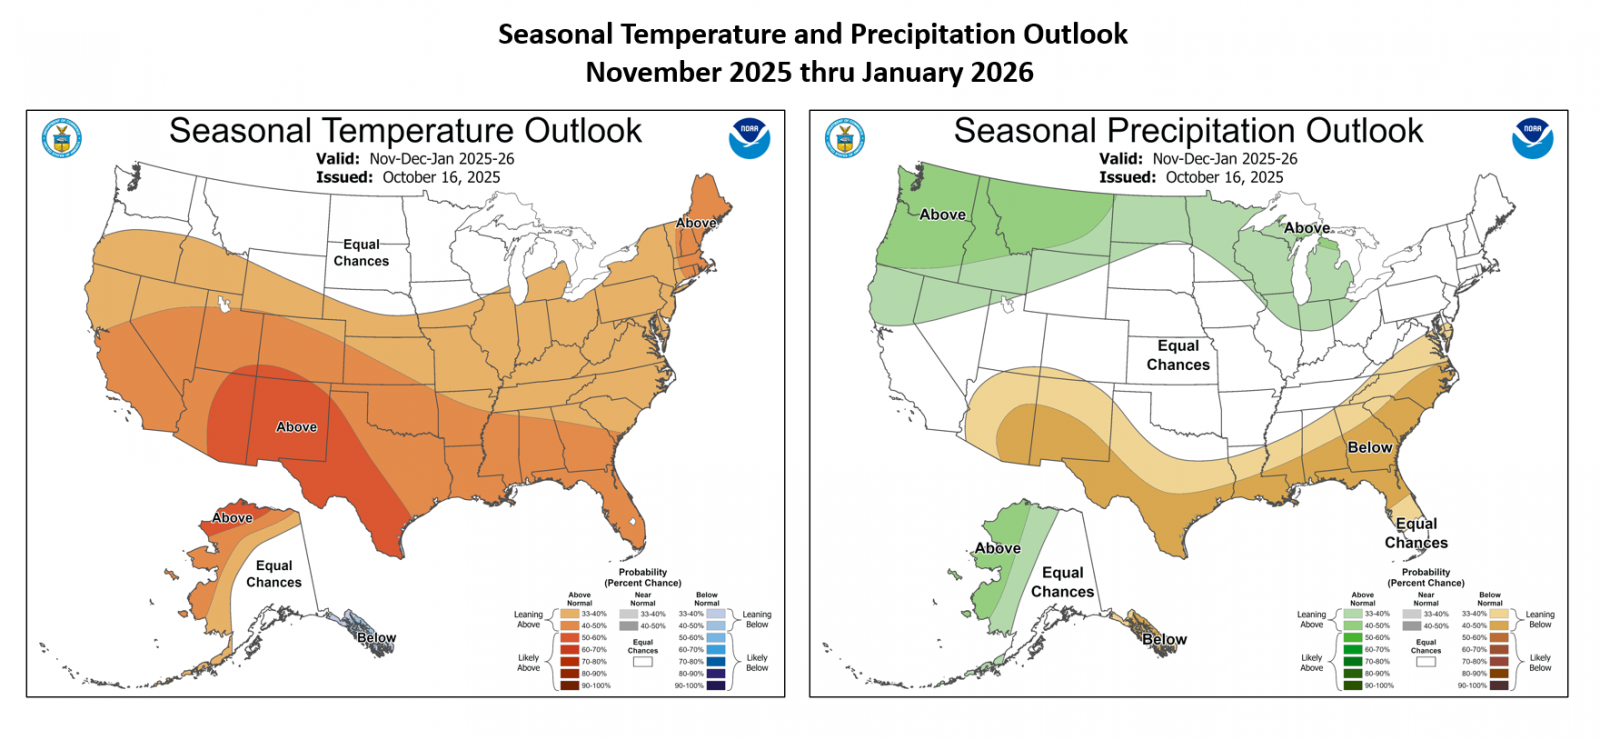
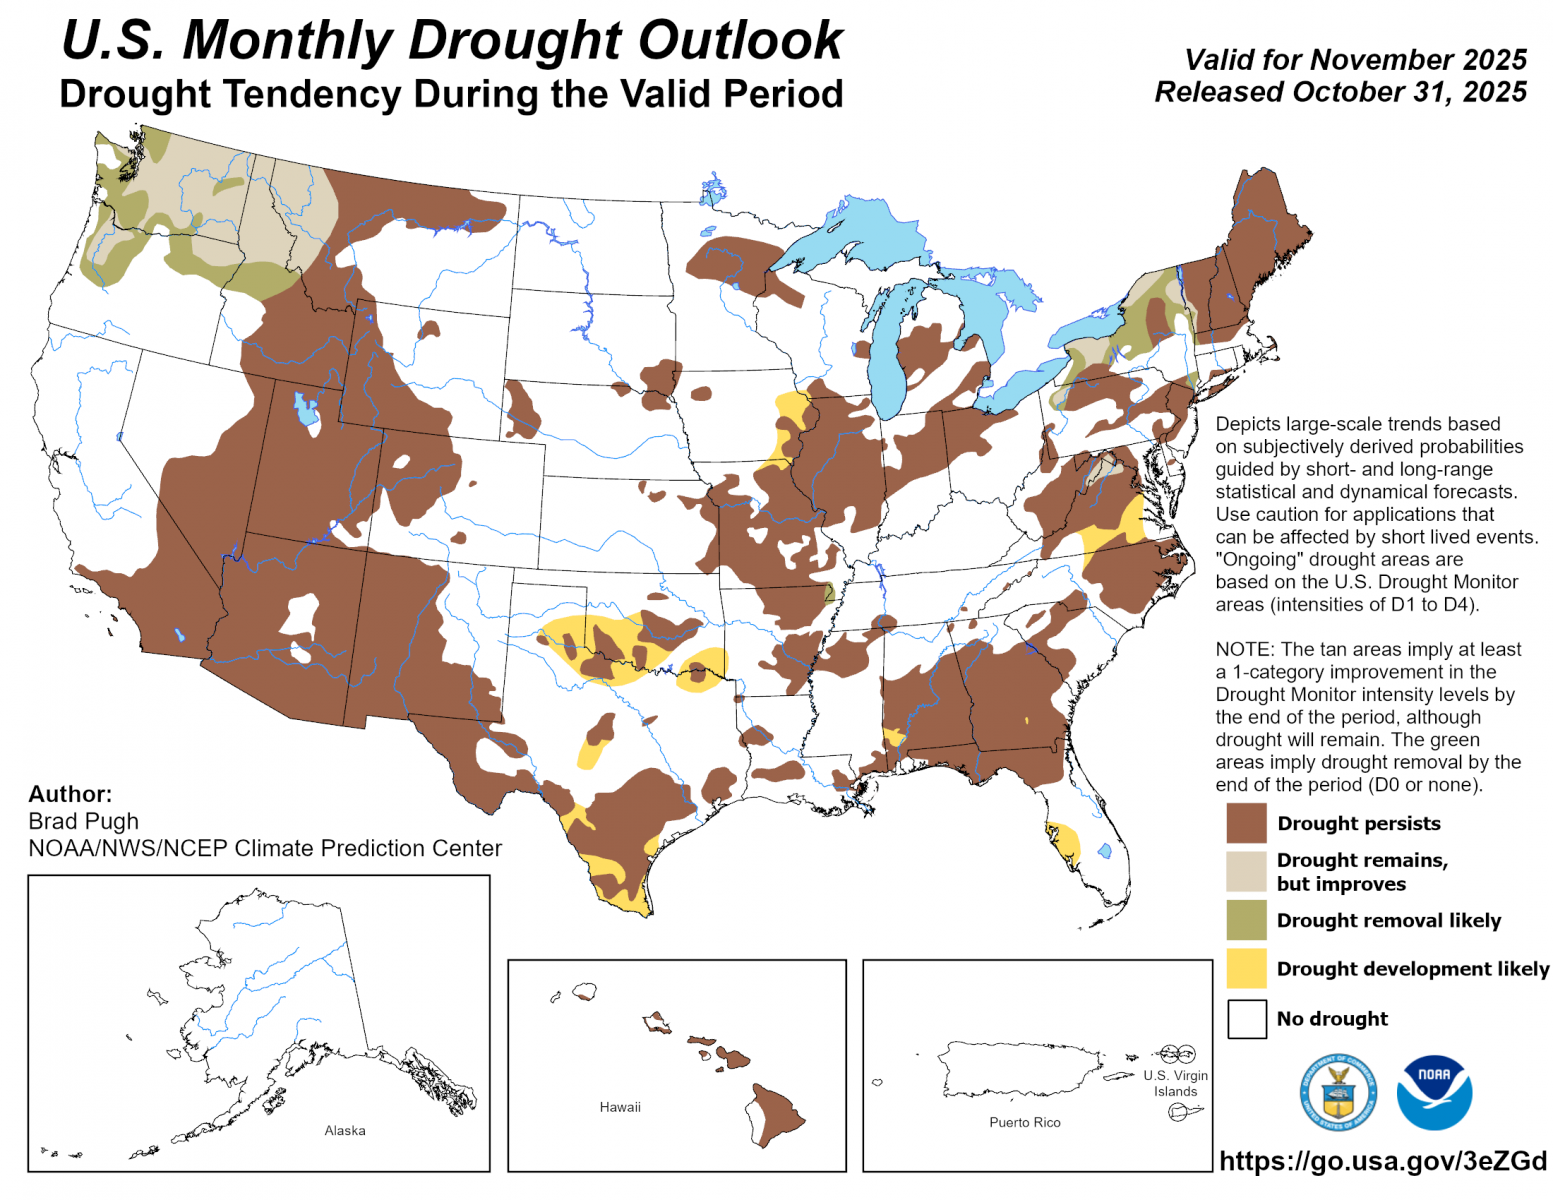
Looking ahead to November, the deep south is favored to see temperatures leaning above normal while precipitation is favored to lean below normal. Entering the cool season, a dry and warmer set up is favored as we close out the year and open 2026. Drought conditions look to persist over the southeast in the near term. The highest local drought impacts continue to focus on agriculture with poor to very poor crop condition with crops susceptible to disease and insect damage. Stress on livestock increases with supplemental feeding required. Please visit the National Integrated Drought Information System (NIDIS) for the latest updates on local and regional drought statements, impacts and outlooks.
Click on the snap shots below to expand:
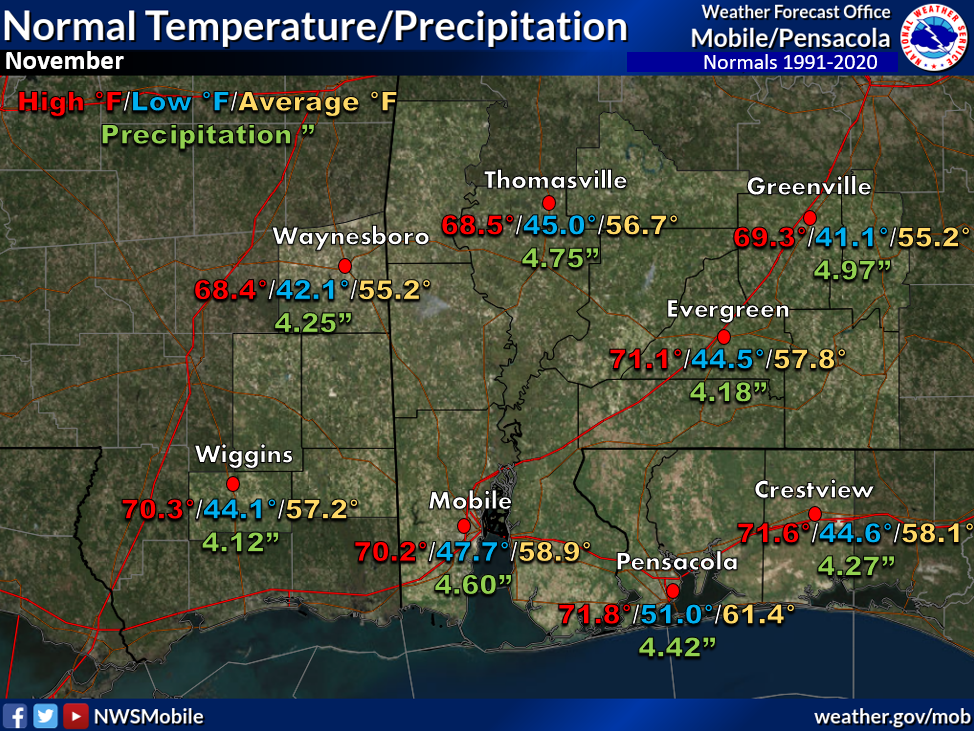 November Normals November Normals |
|
Outlook |
|
|
|
|
Additional Climate Links:
The National Weather Service Mobile Alabama's Climate and Past Weather page provides climate data at your fingertips for many observation points in the local forecast area by accessing the NOWData tab as well as many other climate resources. The Climate Prediction Center Link provides short and longer range climatic outlooks and education about the larger scale global circulations that impact temperatures and weather. With the large agriculture and farming presence along the central Gulf coast, the Drought Monitor link provides updates on drought trends and impacts. Another very helpful resource is the Community Collaborative Rain Hail and Snow (CoCoRaHS) network, which is a large group of volunteers working together to measure and map precipitation (rain, hail and snow). The aim of CoCoRaHS is to provide the highest quality data for natural resource, education and research applications. You can be a part of the CoCoRaHS team by becoming a volunteer rainfall observer.