September 2026 Climate Summaries
Mobile Alabama and Pensacola Florida Area
National Weather Service Mobile Alabama
October 1, 2026
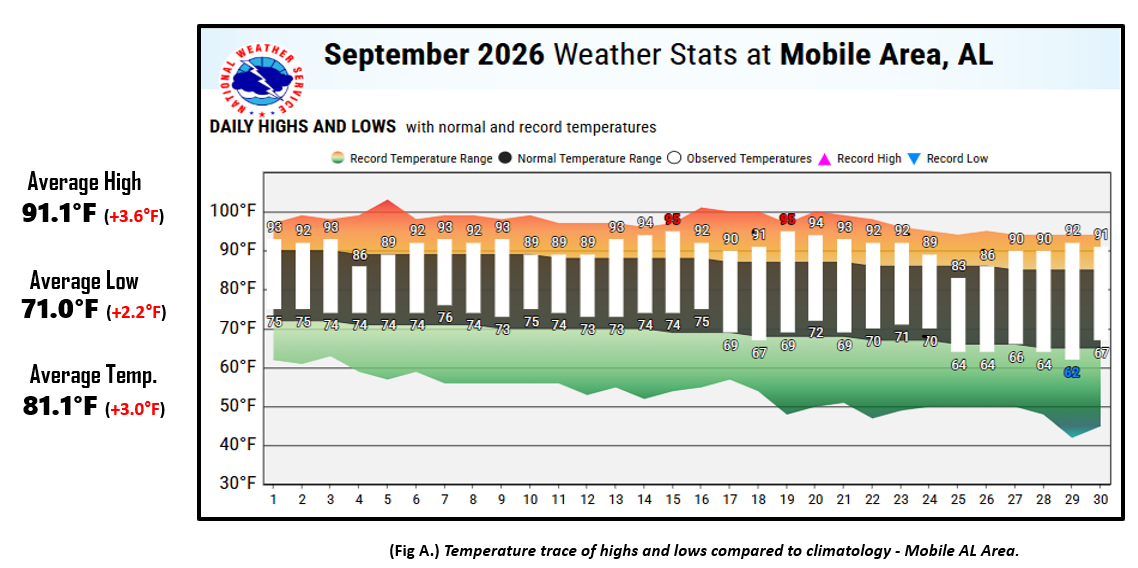
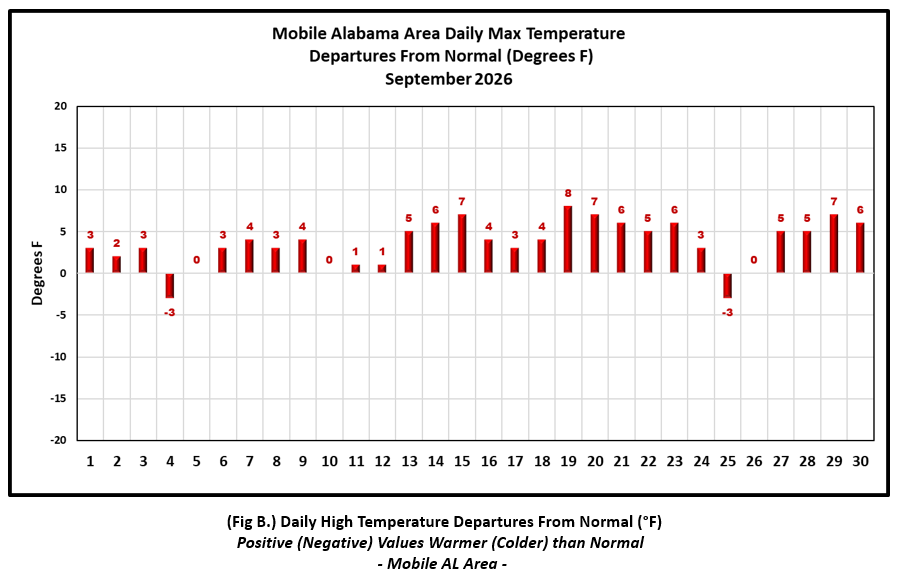
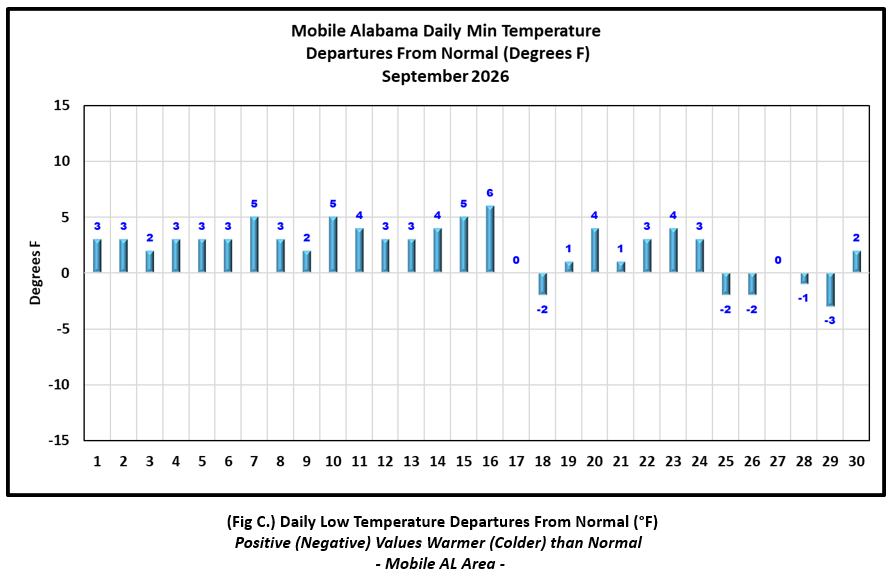
September 2026 in Review - September was a warmth month with both Mobile and Pensacola seeing above normal temperatures in all three metrics of monthly highs, lows, and means. Outside of only two days where highs were below normal, Mobile's numbers were at or well above normal for the month. For the Mobile area, highs averaged nearly four degrees above normal and broke into the top 10 warmest Septembers on record for the month. Lows at Mobile, in the mid 70's, were nearly steady state around 3.5° above normal through the 16th before more variability about the means were realized. At Pensacola, average highs straddled more closer to normal at less than a degree above off the pace. Lows averaged around 2.6° above normal through the 24th, before cooling and averaging 1.7° below normal to end the month. There were no daily record temperatures set at Mobile and Pensacola.
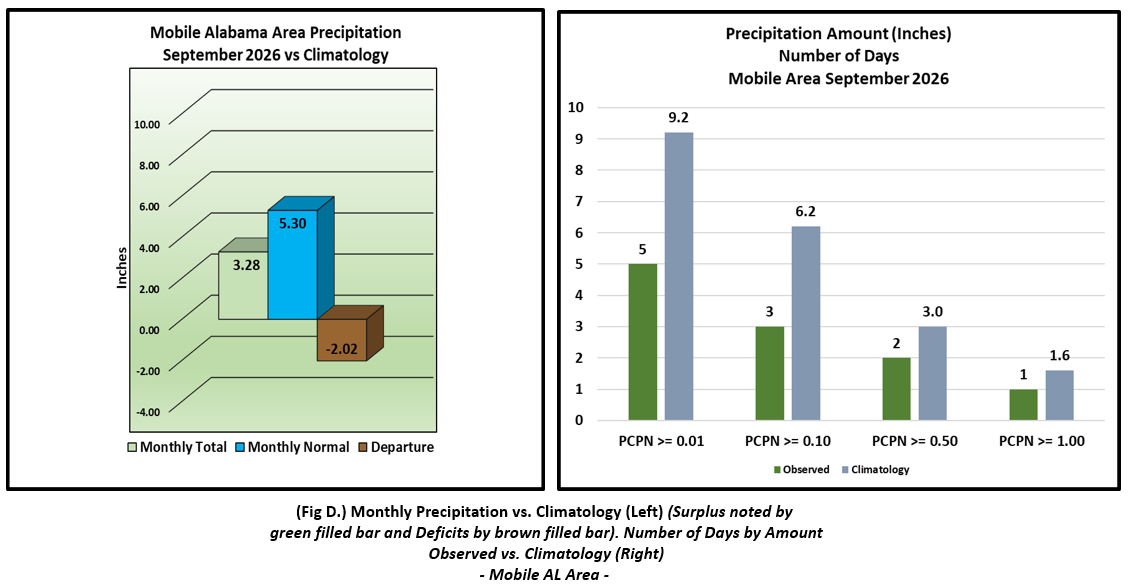
Mobile's September rainfall was lacking by nearly two inches below normal. On the flip side, southern portions of the Northwest Florida Panhandle saw bouts of heavier rain and Pensacola benefited with over a half foot of monthly rainfall resulting in a small surplus against normal September rainfall there.
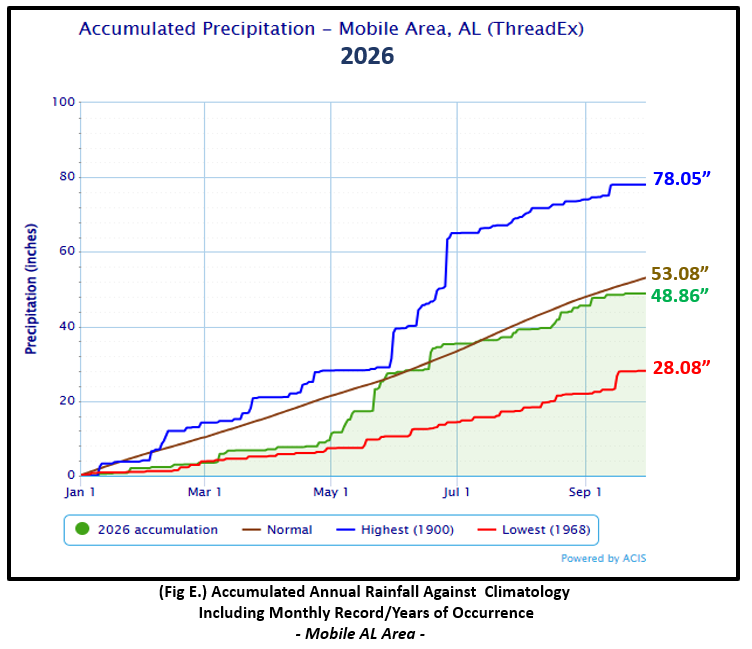
Mobile Alabama Area [Climate Normal Period 1991-2020, Climate Record Period 1872 to Present]- The average monthly high of 91.1° was 3.6° above normal. This cracked into the top ten warmest Septembers on record at number eight. The average monthly low was 71.0° or 2.2° above normal. The average monthly temperature of 81.1° was 3.0° above normal. The highest temperature for the month was 95° on the 19th or 8° above the normal for the date. It took the end of the month to finally get some "Fall" like temperatures. The lowest temperature for month, a cool 62° on the 29th, was 3.0° below normal for the date. No record daily temperatures were set. (Fig. A) shows a bar graphical representation of how the Mobile area daily temperatures compared to the seasonal normal daily highs and lows.(Figs. B and C) shows bar graph departures from normal. Only a few inches of rain was captured in the rain gauge, measuring 3.28" (Fig. D), and well shy of normal by 2.02". Below normal September rainfall has increased the annual rainfall deficit to 4.22" below the normal to date. (Fig. E).
September top records for the month during the Period of Record for the Mobile Area:
Click on the Mobile Alabama area climate graphics below to expand:
|
|
|
|
|
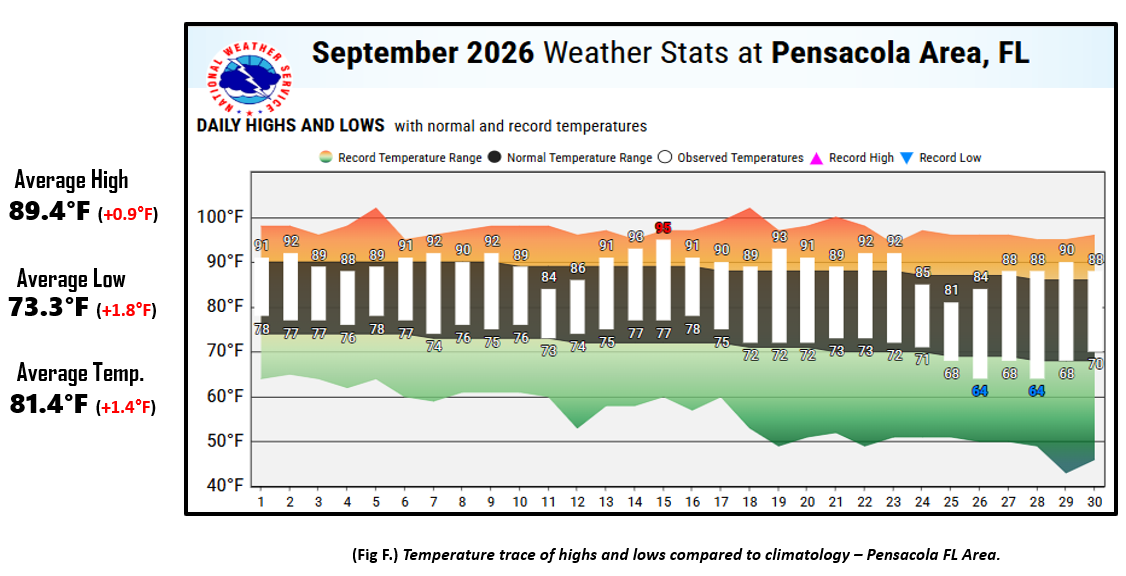
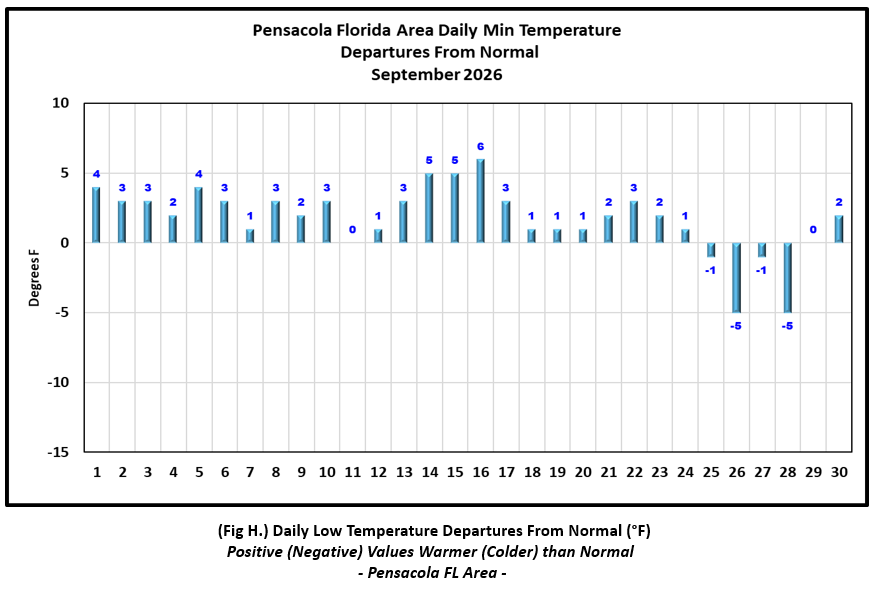
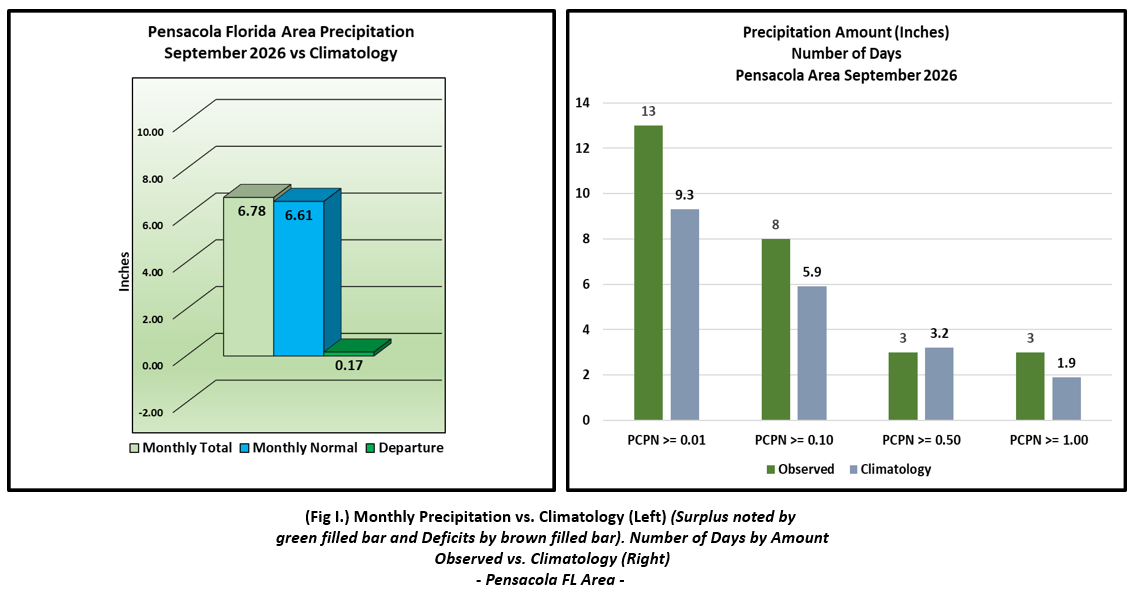
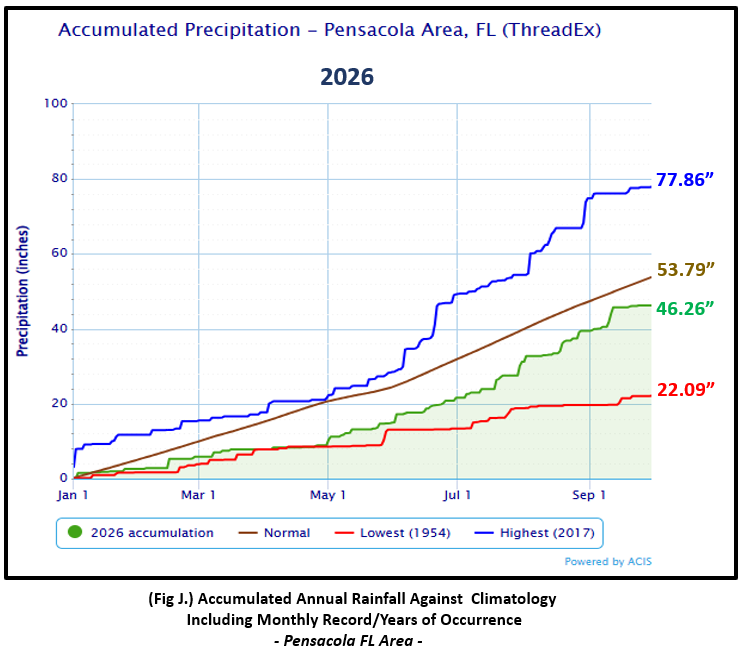
Pensacola Florida Area [Climate Normal Period 1991-2020, Climate Record Period 1879 to Present] - The average monthly high of 89.4° was 0.9° above normal. The average monthly low was 73.3° or 1.8° above normal. The average monthly temperature of 81.4° was 1.4° above normal. The highest temperature for the month was 95°, occurring on the 15th and 6° above normal for the date. The lowest temperature for the month was 64° on the 26th and 28th, 5.0° below normal for these days. No record daily temperatures were set. (Fig. F) shows a bar graphical representation of how the Pensacola area daily temperatures compared to the seasonal normal daily highs and lows.(Figs. G and H) shows bar graph departures from normal.(Fig. F). Pensacola saw nearly two times as much of monthly rainfall compared to Mobile. 6.78" was recorded and a hair above normal by 0.17" (Fig. I). Despite the better rainfall, annual rainfall of 46.26" has changed the deficit little since last month at 7.53" below normal to date (Fig. J).
September top records for the month during the Period of Record for the Pensacola Area:
Click on the Pensacola Florida area climate graphics below to expand:
|

|
|
|
|
Additional September 2026 Climatology and Topics
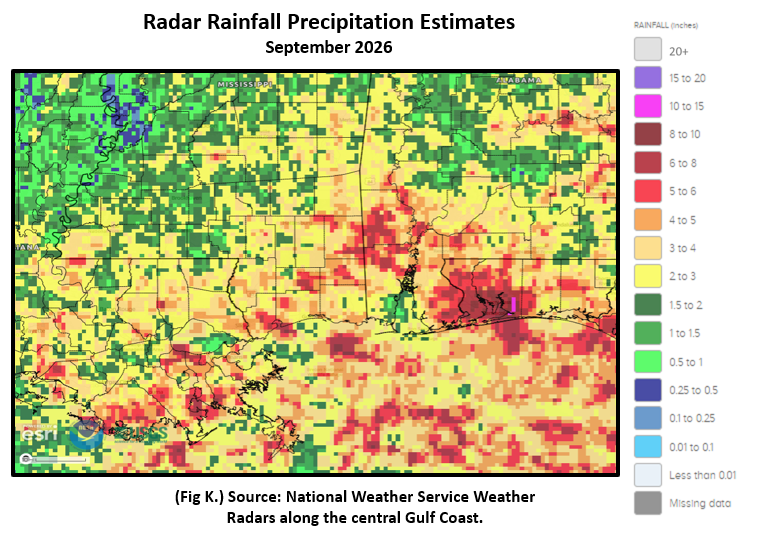
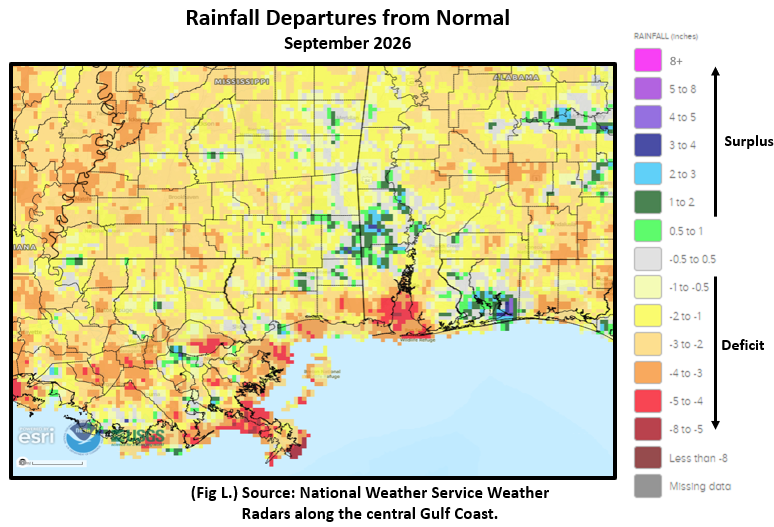
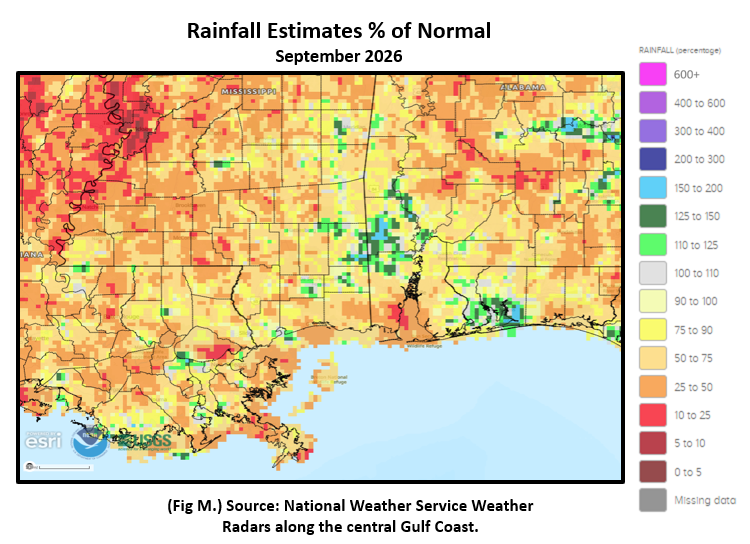
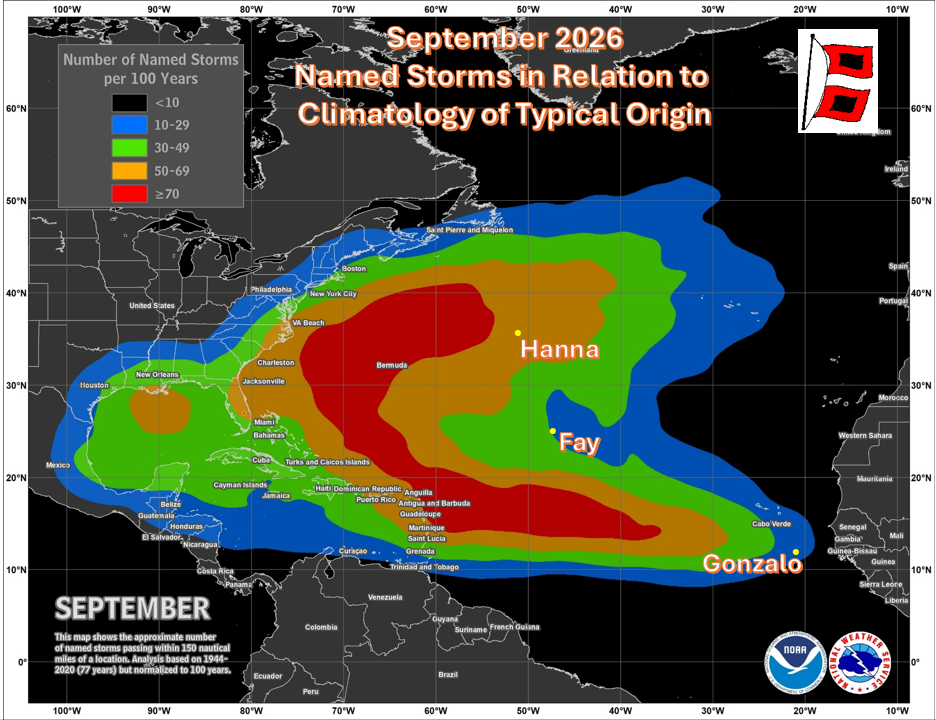
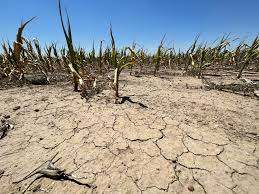
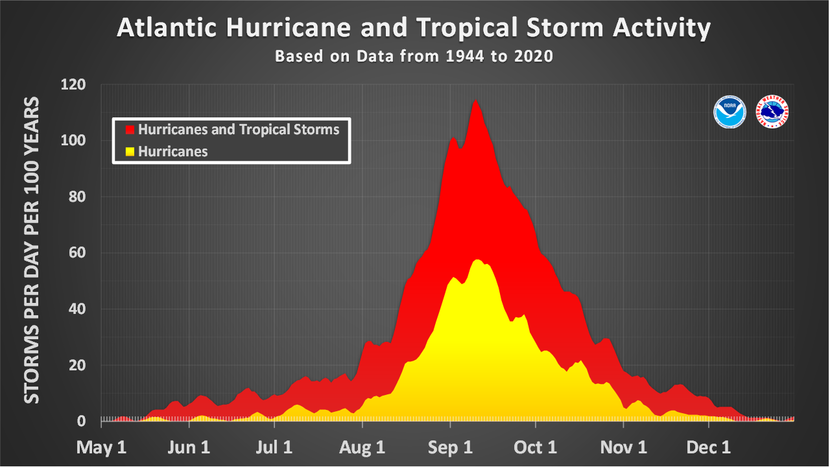
There were pockets of better rainfall during the month from portions of southeast Mississippi to over the interior of southwest Alabama. The best concentration of rains, upwards of 6 to 10" and 1 to 4" above normal, was over the Northwest Florida Panhandle primarily from Pensacola to Milton to Navarre Beach. (Fig. K) shows the areal distribution of monthly rainfall, (Fig. L) shows the areal rainfall departures from normal and (Fig. M) percent of normal rains. We entered the month of September with moderate to severe drought taking another foothold over the interior, north of the I-10 corridor. Drought worsened through the month with severity expanding eastward to across the I-65 corridor (Fig. N). With September being the typical peak in the Atlantic Basin Hurricane Season, September 2026 was quite the opposite. Only three tropical storms formed. In fact, history has been made as this is the first year since the weather satellite era of 1960, that no hurricane has yet to form. Factors contributing to this:
The three tropical storms to form in the Atlantic Basin were Fay, Gonzalo and Hanna the latter half of the month. (Fig. O).
|
|
|

|
|
October 2026 Climatology, Seasonal Climatology and Outlooks:
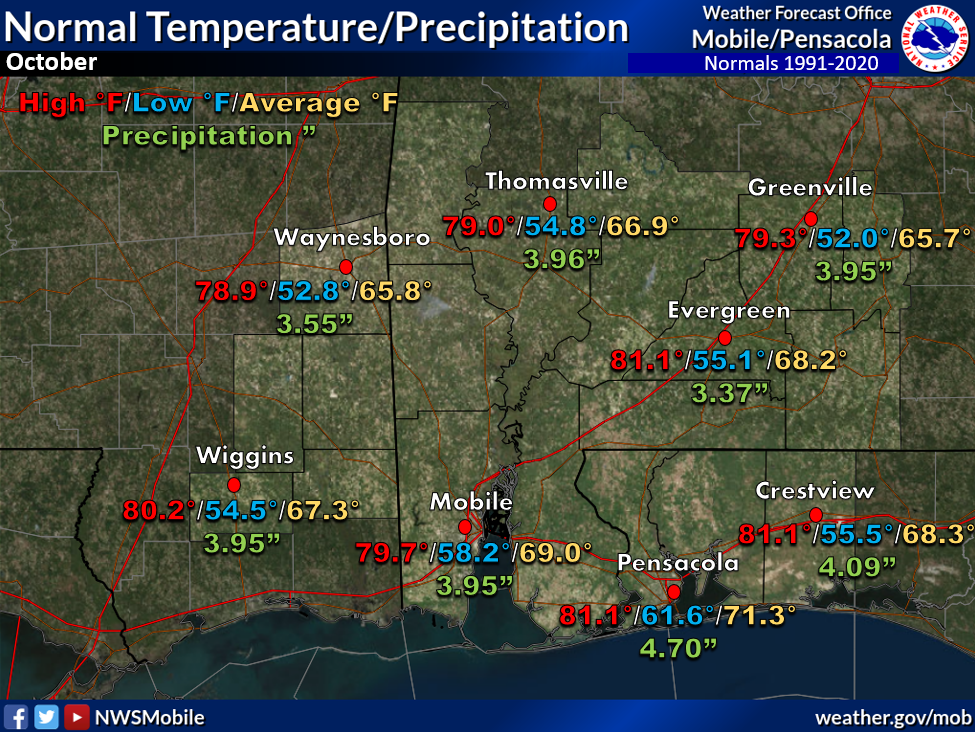
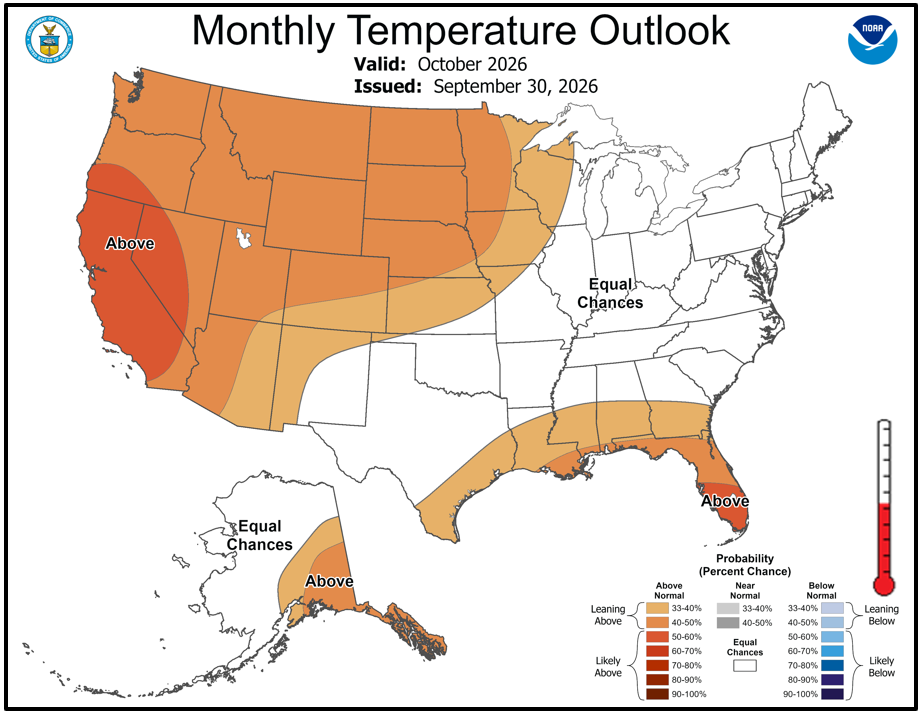
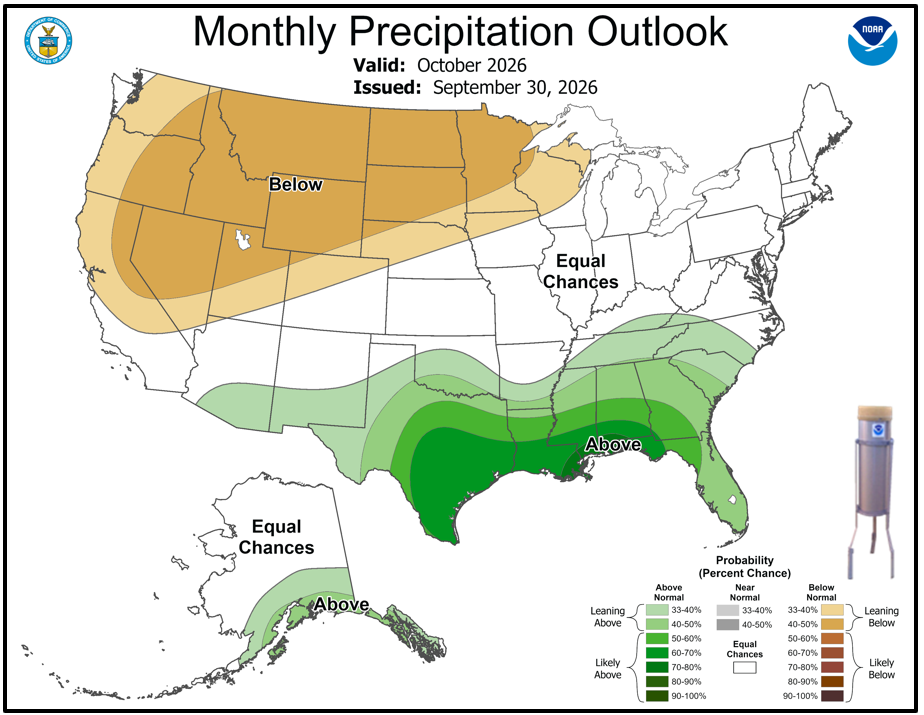
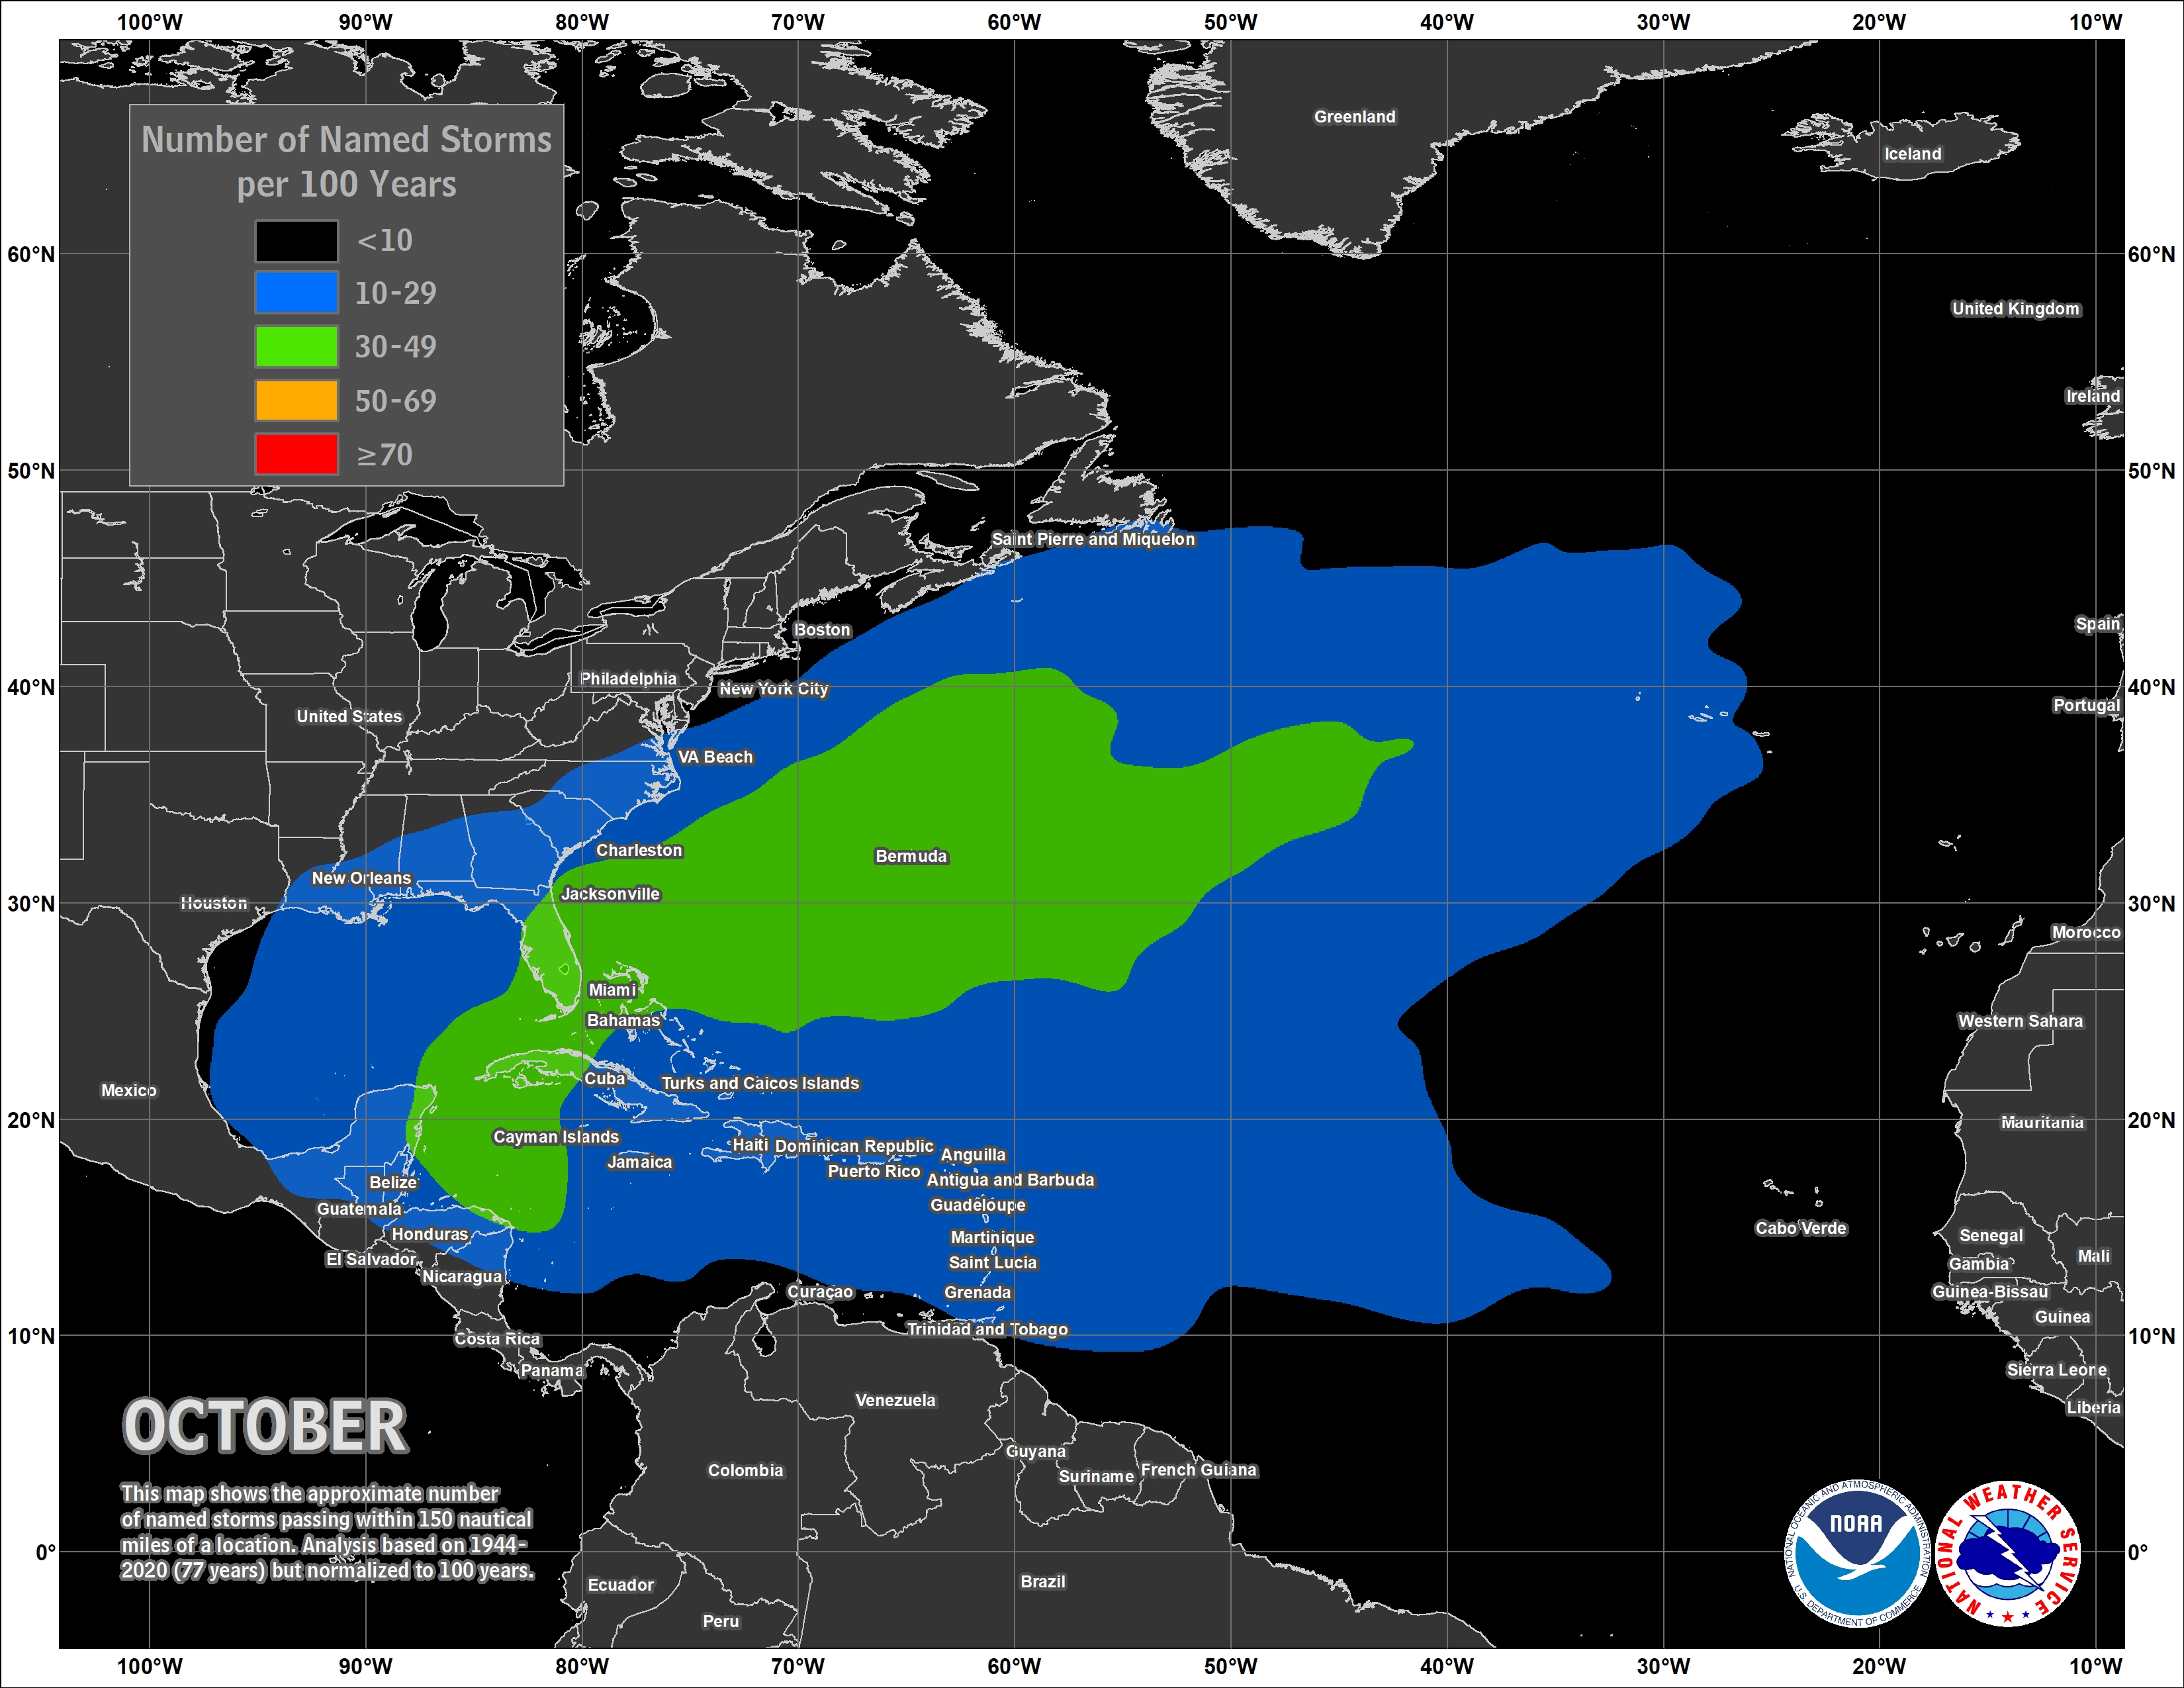
Looking ahead to October, temperatures are favored to lean above normal over the deep south. Although typically a drier month, October this year will likely be wet with a 60% chance favorability over the deep south. There are indications that drought will improve or lose its grip over the deep south in its entirety by the end of December. Although we are moving out of the climatological peak of hurricane season, take note that October does see a climatological spike in tropical cyclone occurrences with the points of origin typically from the northwest Caribbean, Gulf and off the southeast US coast. Don't let the lower activity fool you as October can most certainly see hurricanes, of which could be closer to home. Stay vigilant and ready. For further information, refer to the link, Tropical Cyclone Preparedness.
Click on the snap shots below to expand:
 October Normals October Normals |
|
Outlook |

Outlook |
|

|
|
|

|
Additional Climate Links:
The National Weather Service Mobile Alabama's Climate and Past Weather page provides climate data at your fingertips for many observation points in the local forecast area by accessing the NOWData tab as well as many other climate resources. The Climate Prediction Center Link provides short and longer range climatic outlooks and education about the larger scale global circulations that impact temperatures and weather. With the large agriculture and farming presence along the central Gulf coast, the Drought Monitor link provides updates on drought trends and impacts. Another very helpful resource is the Community Collaborative Rain Hail and Snow (CoCoRaHS) network, which is a large group of volunteers working together to measure and map precipitation (rain, hail and snow). The aim of CoCoRaHS is to provide the highest quality data for natural resource, education and research applications. You can be a part of the CoCoRaHS team by becoming a volunteer rainfall observer.






 Follow us on X
 Follow us on Facebook
 Follow us on YouTube
 MOB RSS Feed