Review of the 2023 Monsoon Across the Southwest U.S.
Compiled by NOAA/NWS Phoenix. Published January 3, 2023.
Note: Click on images for full-resolution versions.
Overview
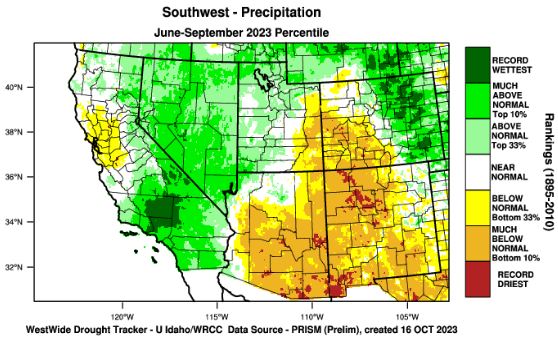
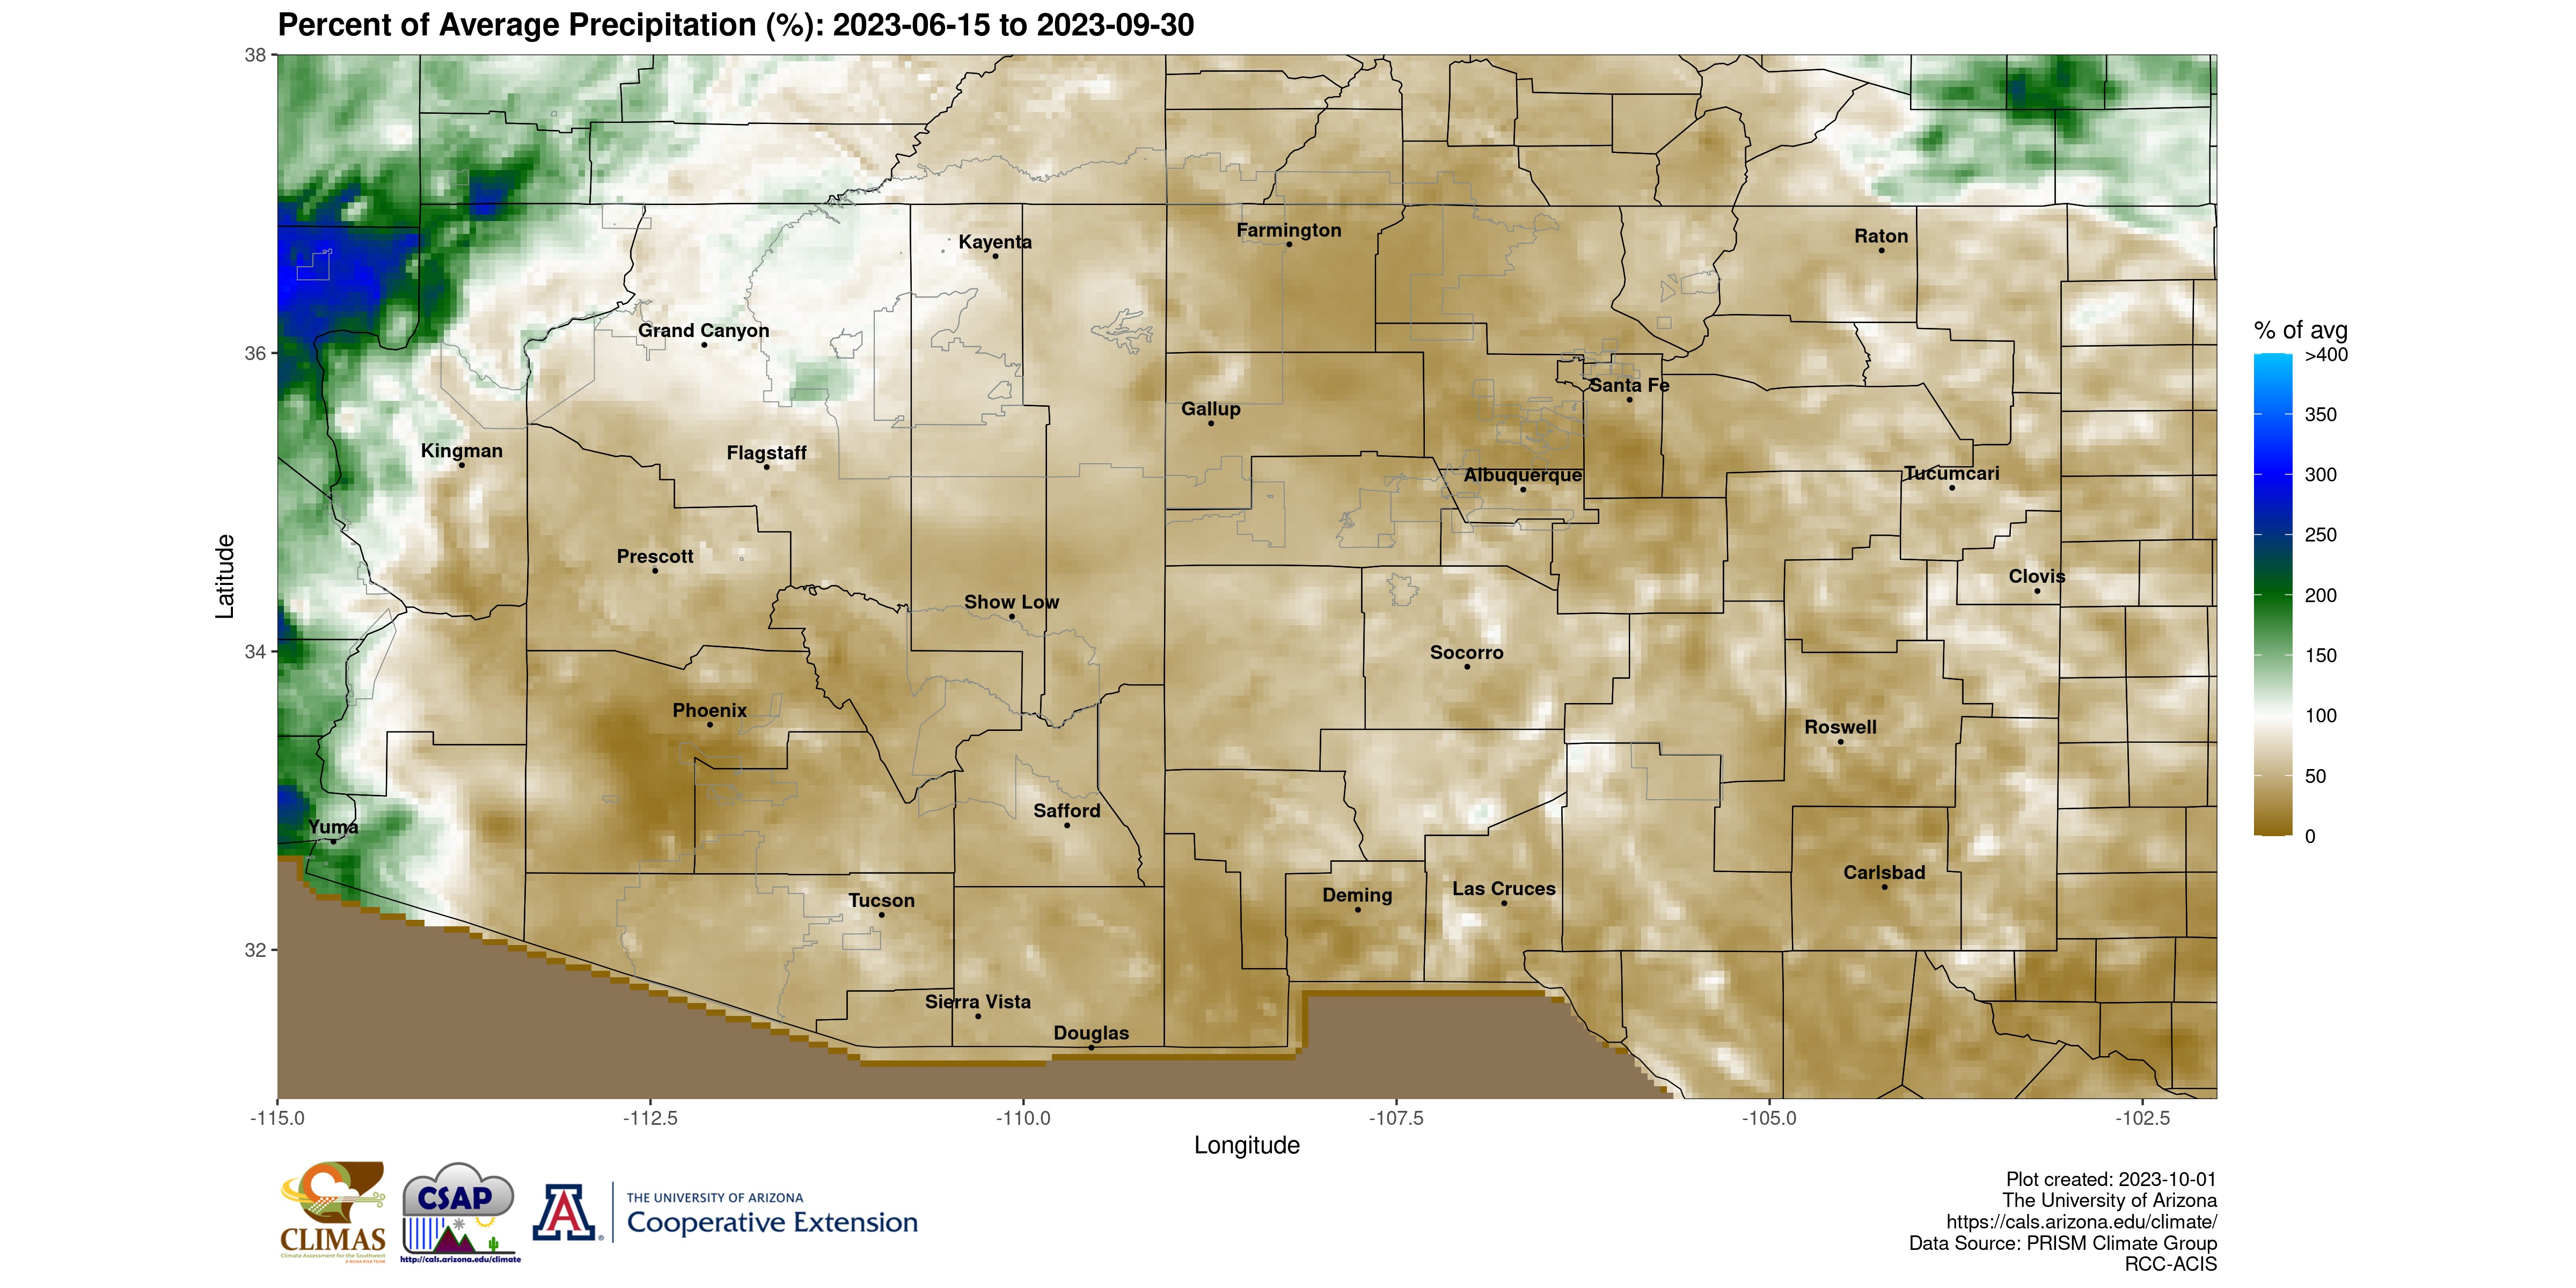
After two fairly wet monsoon seasons in 2021 and 2022, a complete reversal was observed for the 2023 Monsoon with much drier than normal conditions across a large portion of the southwestern U.S., especially across central and southern Arizona into New Mexico and west Texas (Fig. 1). Most of these areas received 50% or less of normal precipitation (Fig. 2). However, across extreme western Arizona through southern California and most of the Great Basin Region, precipitation was actually above normal due to a combination of rainfall from Tropical Storm Hilary that impacted the region in mid-August and a couple of heavy rainfall events in early September.
|
|
Fig. 1. Precipitation ranking for June-September 2023. Source: WestWide Drought Tracker.
|
|
Fig. 2. Percent of average precipitation between June 15th and September 30th, 2023. Source: CLIMAS/OSU PRISM.
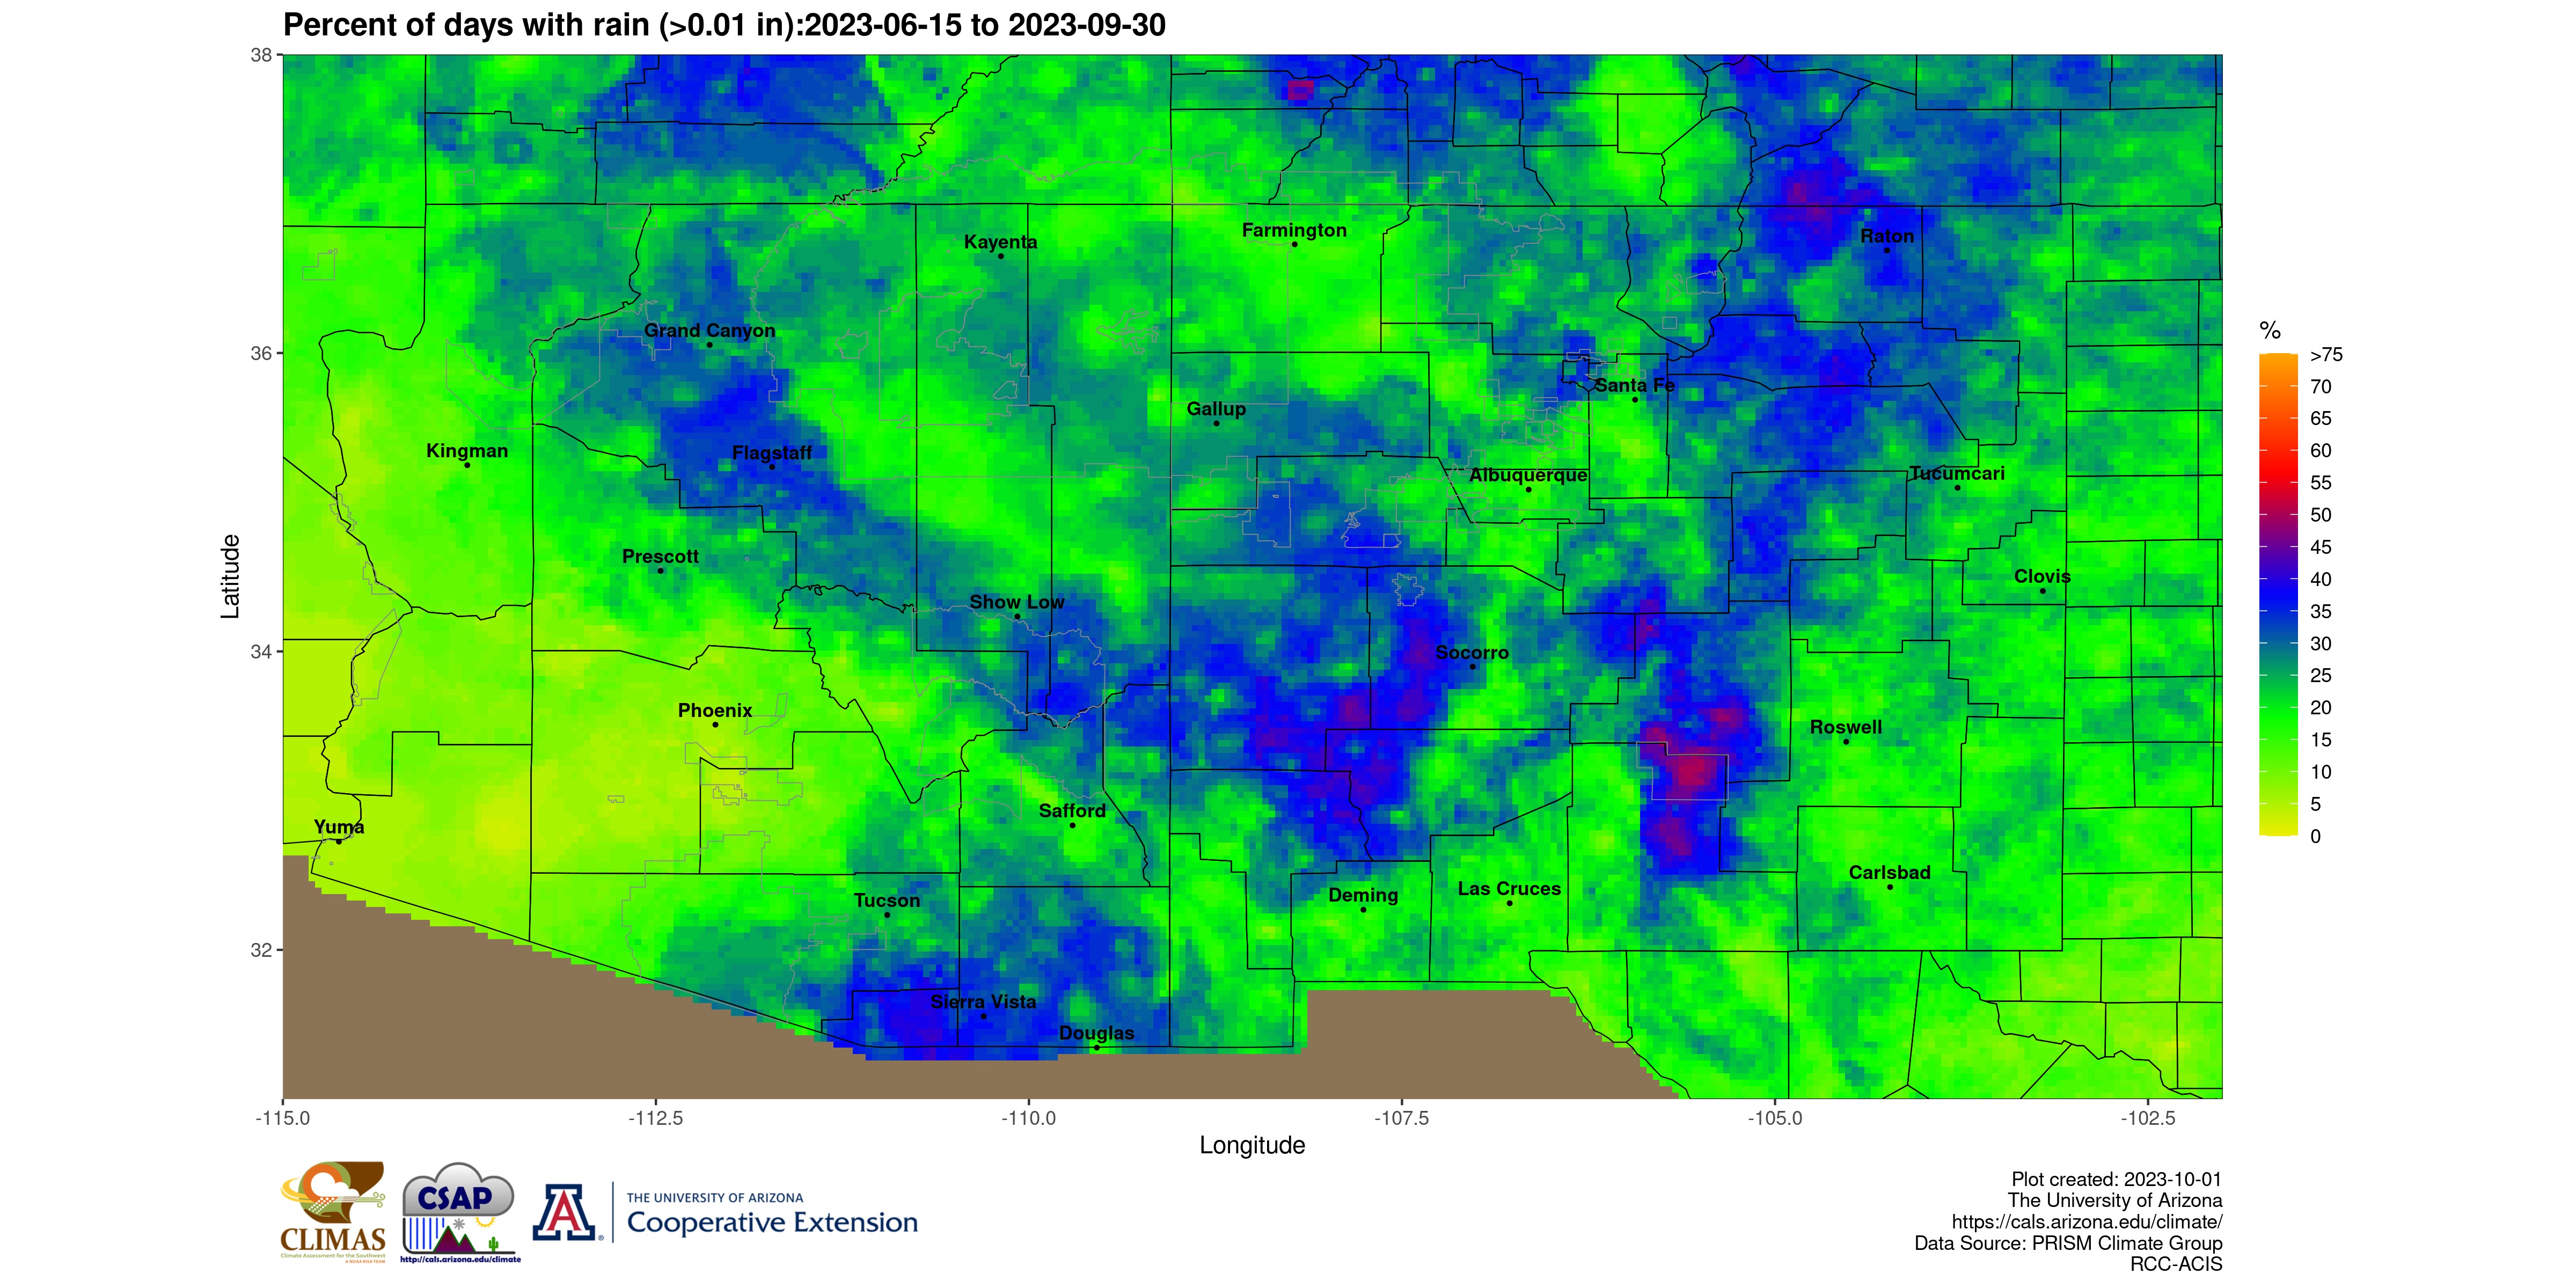
Overall, the higher terrain areas in northern and eastern Arizona and New Mexico experienced the most frequent precipitation activity during the monsoon season with a third to nearly half of the 107 days observing at least 0.01”. On the other hand, the lower desert areas, especially from south-central through southwest Arizona saw less than 10% of days with measurable precipitation during the 107 day stretch (Fig. 3).
|
|
Fig. 3. Percent of days with measurable precipitation (>0.01 in) between June 15th and September 30th, 2023. Source: CLIMAS/OSU PRISM.
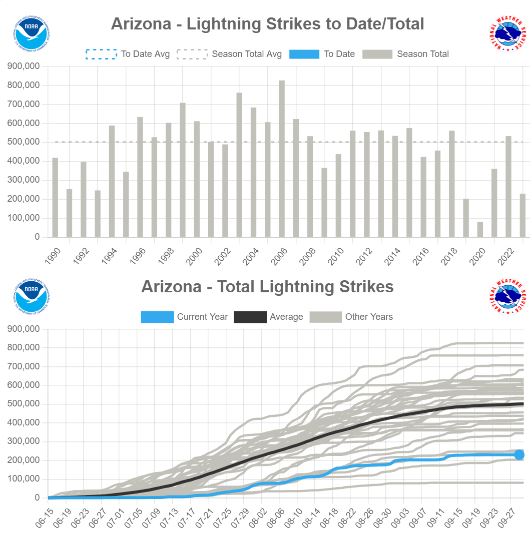
Widespread thunderstorm activity is often associated with the North American monsoon. One metric used to gauge such activity is the amount of lightning strikes across the region. Data from the Vaisala National Lightning Detection Network (NLDN) shows that the 2023 Monsoon had the third fewest total lightning strikes across Arizona (since 1990), behind 2019 and 2020, with just over 200,000 total strikes (Fig. 4).
|
|
Fig. 4. Total lightning strikes across Arizona for the monsoon season for each year between 1990-2023. Source: NLDN.
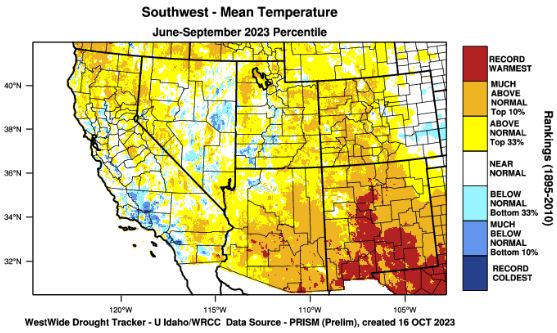
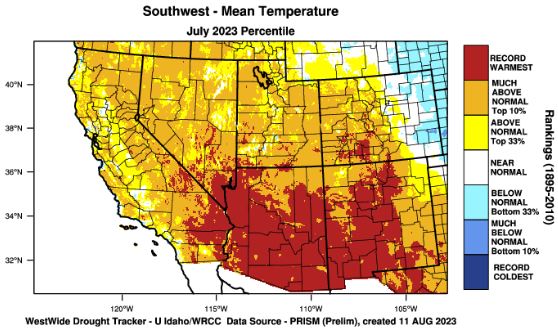
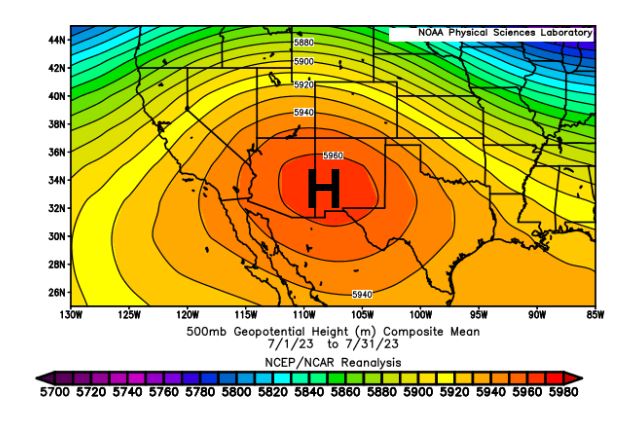
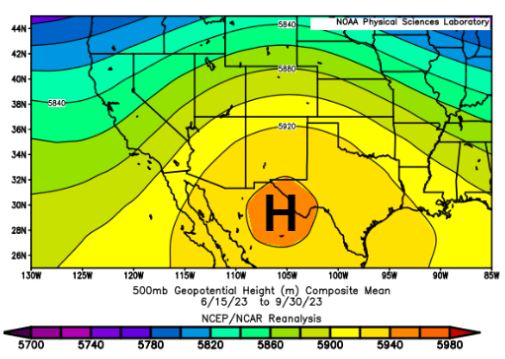
Not surprisingly, given the much drier than normal monsoon with very little thunderstorm activity observed across the majority of the southwest U.S., temperatures were significantly elevated. The majority of the region saw well-above normal to record temperatures during the June to September period (Fig. 5). This was compounded by a record warm July across the majority of region (Fig. 6). The main culprit for a record warm July was an anonymously strong high pressure at the mid-levels that was directly centered across Arizona through New Mexico (Fig 7). This stagnant pattern resulted in large-scale sinking air across the majority of the region, suppressing thunderstorm activity and increasing surface temperatures.
|
|
Fig. 5. Temperature ranking for June-September 2023. Source: WestWide Drought Tracker.
|
|
Fig. 6. Temperature ranking for July 2023. Source: WestWide Drought Tracker.
|
|
|
Fig. 7. (Left) 500 mb Geopotential Height Composite Mean for July 2023. (Right) 500 mb Geopotential Height Composite Anomaly for July 2023. Source: NCEP/NCAR Reanalysis.
Thanks to a very wet 2022-2023 winter season across the western U.S., drought conditions were limited or eliminated altogether in early 2023. Unfortunately, due to the very hot and dry monsoon, drought conditions returned and in a significant way, especially across the majority of Arizona and New Mexico. Just before the start of the monsoon season, nearly all of Arizona and a large portion of New Mexico were experiencing drought-free conditions. Then, by early October, the southeastern half of Arizona and most of New Mexico were experiencing severe to extreme drought conditions. On the flip side, across extreme western Arizona through California and most of the Great Basin, given that above-normal precipitation was observed, there was a reduction in the drought conditions (Fig. 8).
|
|
Fig. 8. Depiction of drought conditions via the U.S. Drought Monitor prior to and after the monsoon.
Typical Monsoon Pattern
During the monsoon, the subtropical high pressure (often known as the “Monsoon High”) strengthens, expands, and drifts northward (Fig. 9). As it drifts northward during the course of the summer months, it will cause a reversal in the overall wind pattern from west-to-east to east-to-west. This reversal in the wind pattern results in a significant increase in atmospheric moisture across the southwestern U.S. This moisture combined with the summer heat results in a favorable pattern for periodic episodes of shower and thunderstorm activity across the region.
|
|
Fig. 9. Animation showing the typical gradual development, northward migration, and ultimate demise of the “monsoon high” through the summer. The black contours and red/blue colorfill represent the height (in meters) of the 500 mb pressure level, representing the vertical middle of the atmosphere. The cool/blue (warm/red) colors in the north (south) represent lower (higher) density air; temperature is directly proportional to pressure, thus blue (red) colors are associated with cool (warm) air. The blue/magenta/cyan lines represent precipitable water values (PWAT, the amount of water vapor in the atmosphere if condensed into liquid) of 1.0/1.5/2.0”. As the monsoon high builds, greater PWAT values move north. The inset trace is for Phoenix, AZ, showing the seasonal moisture trend. Graphic produced by Paul Iñiguez, former Science and Operations Officer at NWS Phoenix. Data source: NCEP NARR.
For most of the region as a whole, approximately 50% of the annual precipitation occurs during the June to September period. However, that amount varies significantly from less than 20% across extreme western Arizona to almost 70% in the mountains of southern New Mexico and far west Texas (Fig.10). The increase in clouds, showers, and thunderstorms provide relief from the region’s relentless heat by limiting the surface heat and spreading rain-cooled air down to the surface.
|
|
Fig. 10. The percent of annual rainfall which arrives during the core monsoon months of June through September. Typically the season’s rains are more notable across New Mexico and far southeast Arizona. Graphic produced by Paul Iñiguez, former Science and Operations Officer at NWS Phoenix. Data source: NCEI NClimGrid.
The 2023 Monsoon Weather Pattern
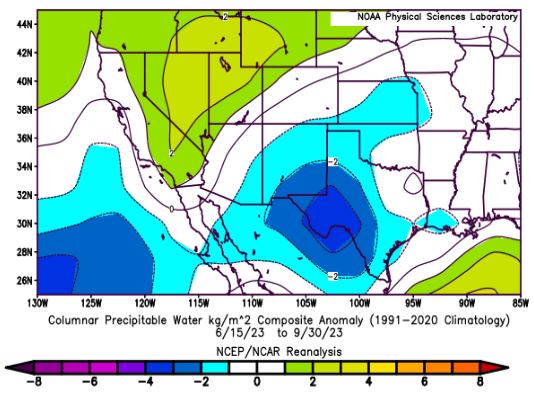
Throughout most of the 2023 monsoon, the “Monsoonal High” was generally positioned in an unfavorable location, over northern Mexico (Fig. 11). The overall location of the high resulted in a higher frequency of dry, westerly flow aloft across most of the southwest U.S. (Fig. 12). As a result, more frequent episodes of lower than normal precipitable water values (a measure of the amount in the moisture in the atmosphere) were observed (Fig 13). With more limited moisture in place, the amount of atmospheric instability was lower, resulting in lower potential for showers and thunderstorms.
|
|
Fig. 11. 500 mb Geopotential Height Composite Mean for the period of June 15th to September 30, 2023. Source: NCEP/NCAR.
|
|
Fig. 12. 500 mb Zonal Wind Composite Anomaly for the period of June 15th to September 30, 2023. Positive values indicate westerly flow aloft. Source: NCEP/NCAR.
|
|
Fig. 13. Precipitable Water Values Composite Anomaly for the period of June 15th to September 30th, 2023. Source: NCEP/NCAR.
Significant Events During Monsoon 2023:
Despite there being a low frequency of thunderstorm days compared to normal, there were some notable high impact events that occurred during this monsoon season:
August 19-21, 2023-Tropical Storm Hilary
Tropical Storm Hilary rode up the Baja Peninsula and made landfall across the southern California coast. The tropical moisture resulted in widespread moderate to heavy rainfall activity across most of southern California and into the Great Basin Region with widespread totals ranging between 2-6 inches (Fig. 14). Several desert areas in southern California saw a year's worth of rainfall with Hilary, with several locations reporting significant flash flooding as well as mudslides and rockslides.
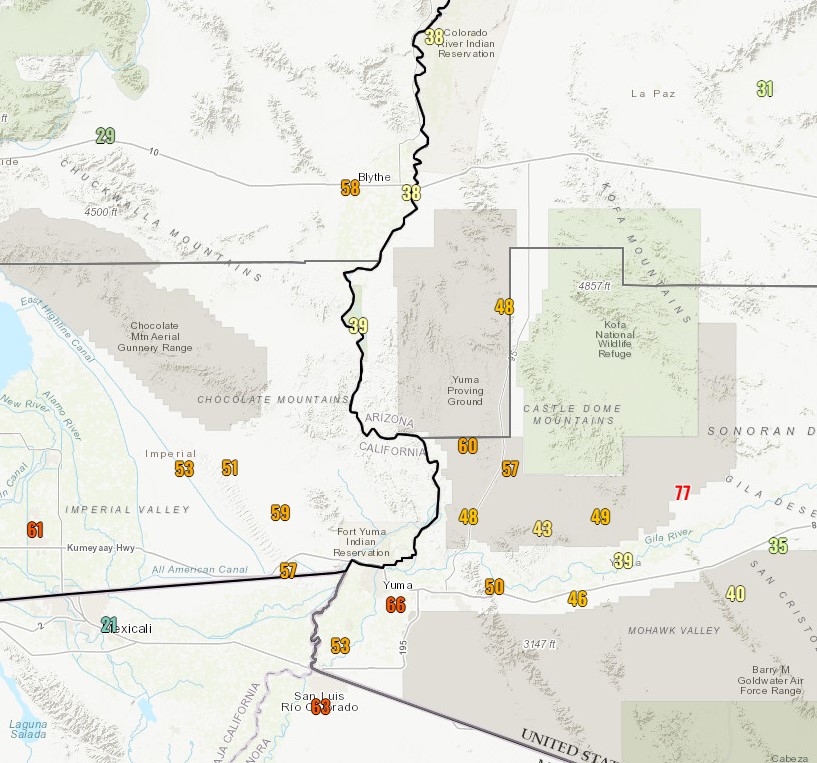
Further east across the eastern half of Imperial and Riverside counties into southwest Arizona, the strong wind field on the eastern side of Hilary’s circulation resulted in strong, damaging winds ranging between 55-70 mph during the afternoon and evening hours on August 20th (Fig. 15). These strong winds resulted in areas of dense blowing dust along with several locations in the Yuma area reporting property damage in the form of downed trees, powerlines, and roof damage.
|
|
Fig. 14. Total rainfall amounts associated with Tropical Storm Hilary. Data source: MRMS Online Viewer.
|
|
Fig. 15. Peak wind gusts on August 20th, 2023. Data Source: NWS NOAA Weather and Hazards Viewer.
August 31, 2023-Damaging winds and significant dust storm impact the Phoenix Metro Area
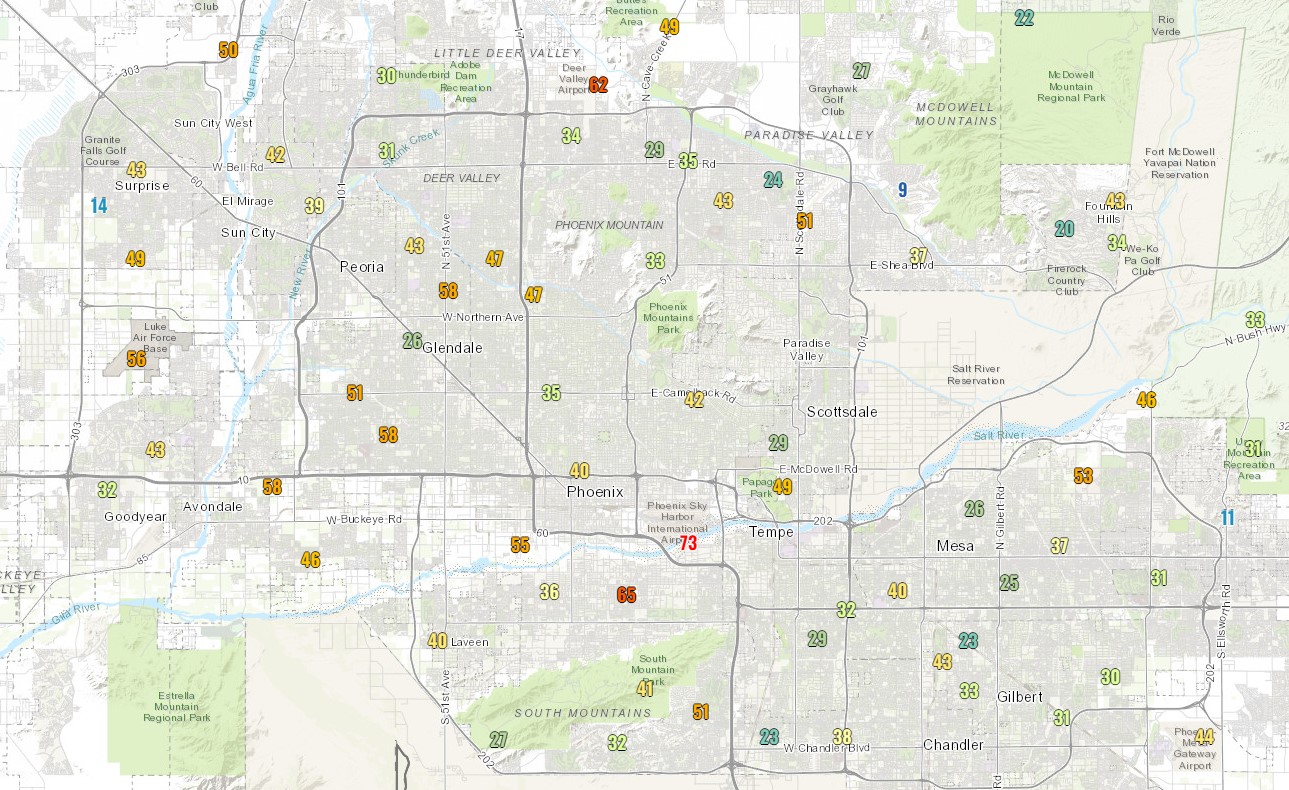
On the evening of August 31, 2023, a complex of severe thunderstorms developed across portions of southeast AZ and then moved northwestward into south-central AZ. A strong outflow boundary emanating from the thunderstorm complex resulted in a significant dust storm that impacted the majority of the Phoenix metro area with visibilities reduced to a quarter mile or less and damaging winds in excess of 55 mph (Fig. 16.) Winds of this magnitude resulted in several downed trees and powerlines. Lightning activity caused a significant stoppage for more than two hours at the Arizona State University Home Opener Football Game (Fig. 17).
|
|
Fig. 16. Peak wind gusts on August 31st, 2023. Data Source: NWS NOAA Weather and Hazards Viewer.
|
|
Fig. 17. Scene at the Arizona State University Home Opener Football Game on August 31st, 2023 showing the visibility significantly reduced due to the dust storm. Dust storm was followed by lightning activity, which caused a stoppage for more than two hours. Source: azcentral.com
September 1-2, 2023-Significant flash flooding impacts southeast California and southwest Arizona
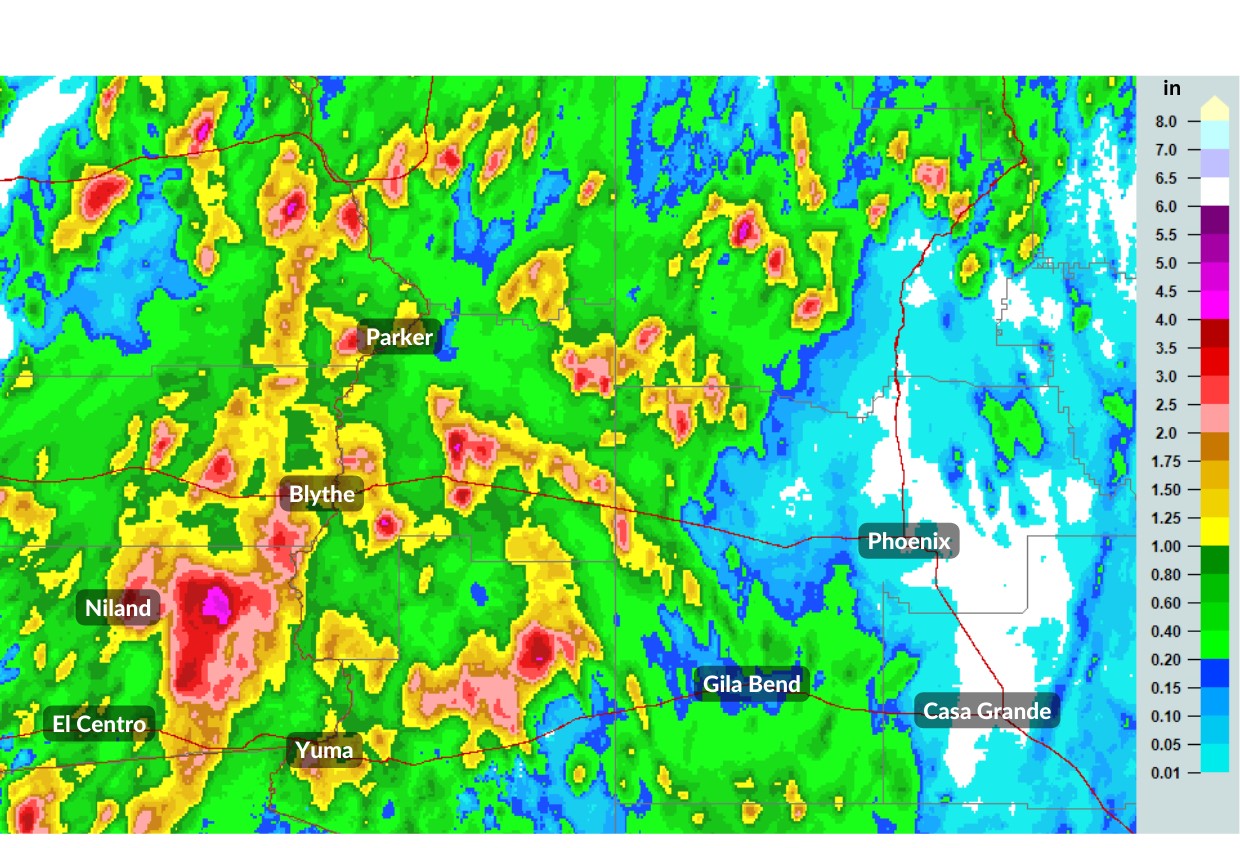
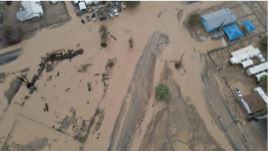
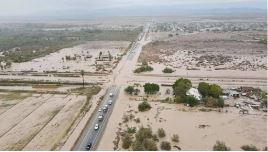
On September 1, heavy rainfall activity was observed across Yuma county in southwest Arizona as well as across Imperial and Riverside Counties in southeast California. Rainfall totals were estimated at between 1-4 inches (Fig. 18). Considerable flash flooding was observed across many areas, especially in southeast California, resulting in roads being washed away, leading to swift water rescues. The hardest hit area was the town of Niland, where several homes and businesses as well as the agricultural fields were heavily impacted by the flood waters (Fig. 19).
On September 2nd, thunderstorms developed during the early afternoon hours across portions of Yuma and La Paz Counties, where totals upwards of 2” were reported. This led to several reports of flash flooding due to overflowing washes. The Yuma area broke a daily rainfall record of 1.67”.
|
|
Fig. 18. Total Rainfall amounts across southeast California and southwest Arizona on September 1-2, 2023. Data source: MRMS Online Viewer.
|
|
|
Fig. 19. Scenes in Niland, CA showing the flood waters inundating roads, homes, businesses, and agricultural fields. Source: Holtville Tribune
September 12, 2023-Supercell Thunderstorm impacts the Phoenix Area
A supercell storm moved from west to east across the Phoenix metro, leading to extensive wind damage in the form of downed trees, powerlines, and roof damage. A full event writeup can be accessed here: September 12: Extensive Wind Damage from Supercell Storm in Phoenix Metro Area
NWS Services During the 2023 Monsoon
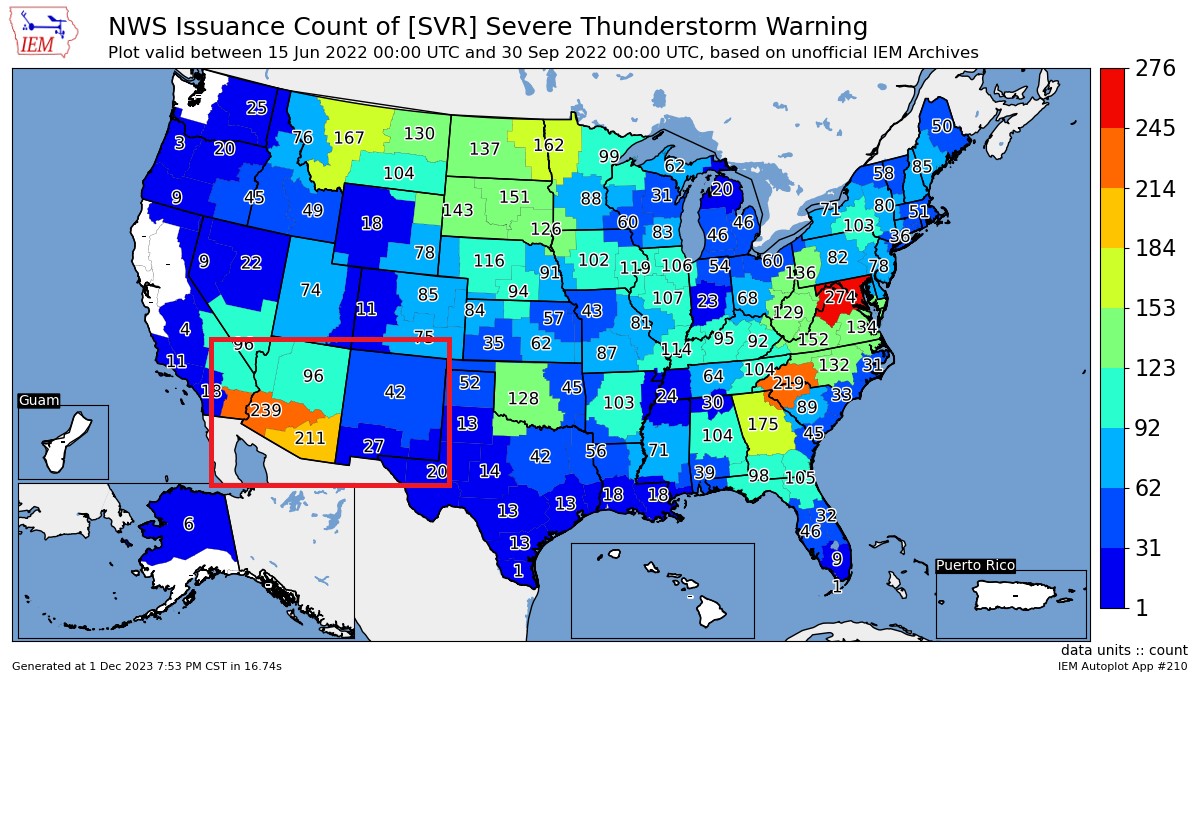
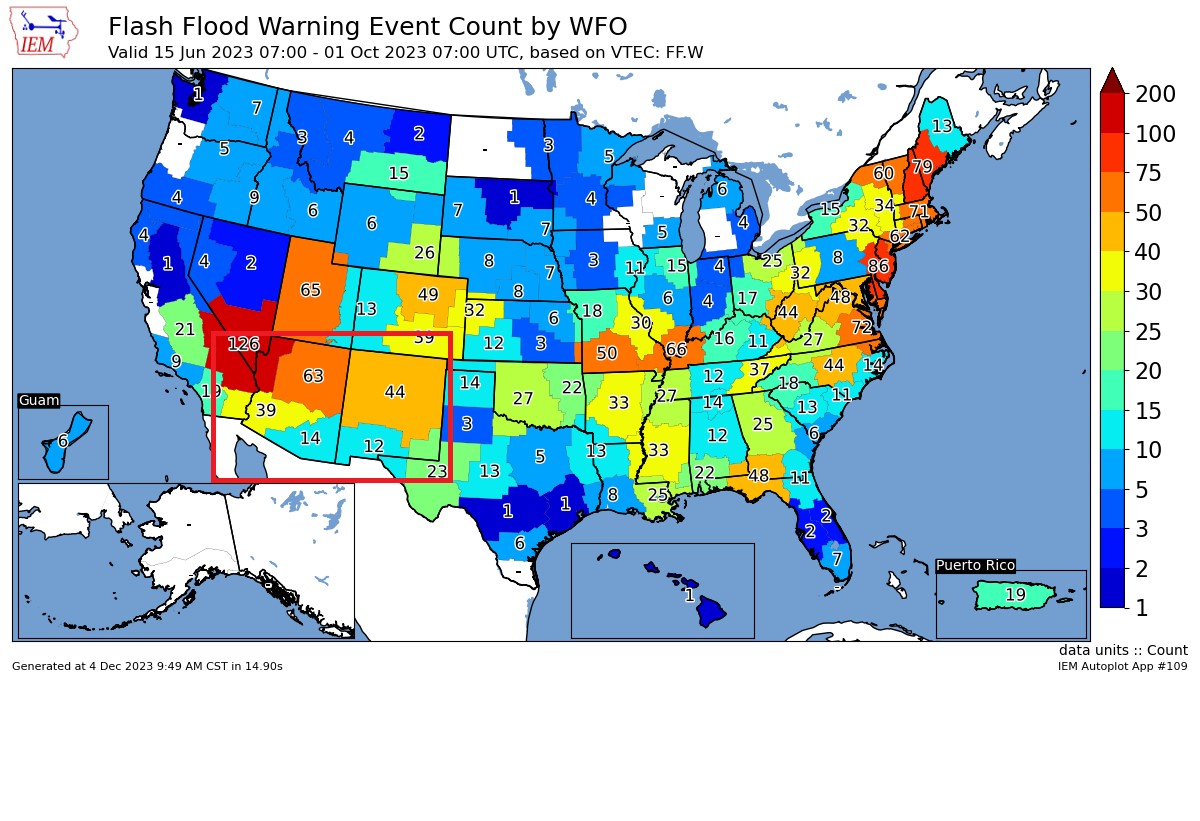
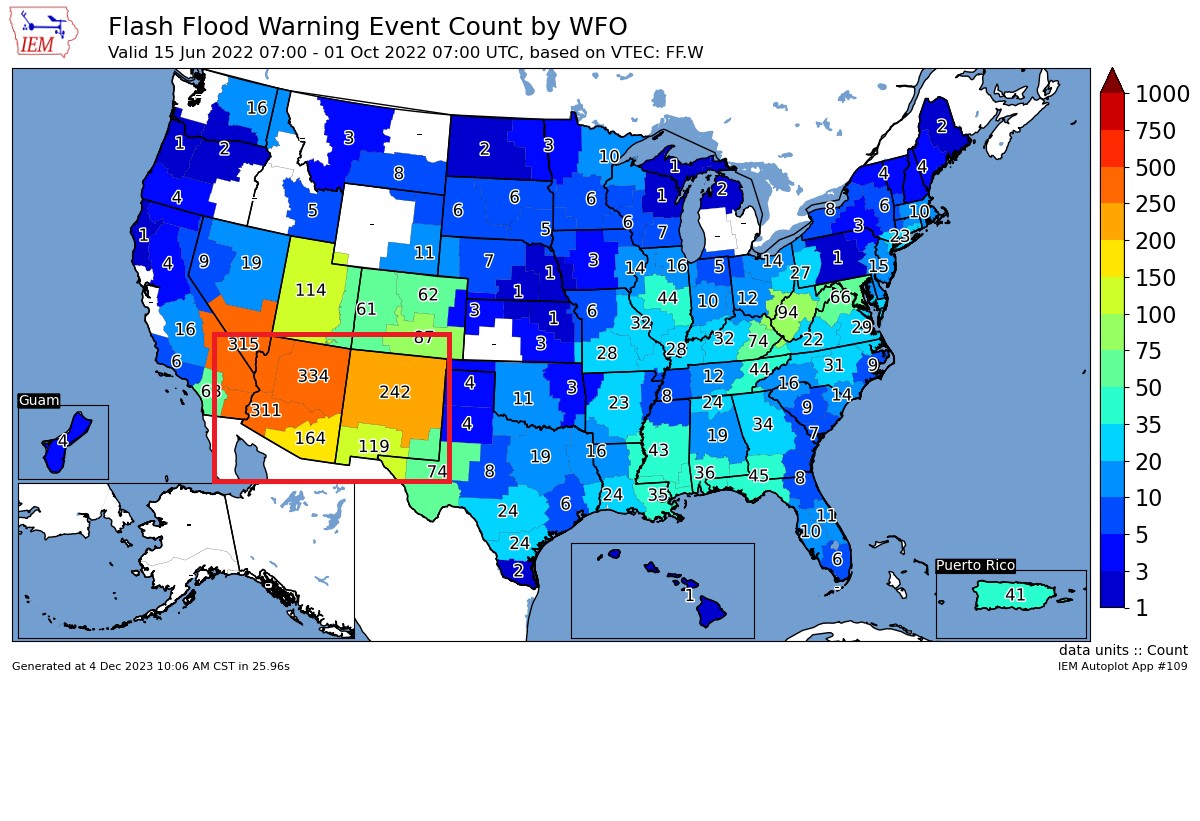
As it would be expected given the more inactive monsoonal activity, the total number of severe thunderstorm and flash flood warnings combined on average were significantly lower in 2023 compared to 2022 across the southwestern U.S. (Figs. 20-21). The Flash Flood Warning totals specifically were dramatically lower as there was approximately an 80% reduction in the total number of warnings in 2023 compared to 2022. This conceptually makes sense given that the overall pattern that was observed during the 2023 monsoon favored more infrequent heavy rainfall events.
|
|
|
|
Fig. 20a. Number of Severe Thunderstorm Warnings issued by each NWS office between June 15-September 30 of 2023. The red rectangle outlined denotes the southwestern U.S. region. Fig. 20b. Same as the top figure but for 2022. Source: Iowa Environmental Mesonet
|
|
|
|
Fig. 21a. Number of Flash Flood Warnings issued by each NWS office between June 15-September 30 of 2023. The red rectangle outlined denotes the southwestern U.S. region. Fig. 21b. Same as the top figure but for 2022. Source: Iowa Environmental Mesonet
The highest concentration of severe thunderstorm warnings included mostly the lower elevation areas, which coincides with some of the major metropolitan areas such as Phoenix, Tucson and Las Vegas (Fig. 22). These cities are located next to the higher mountain chains and thus storms that form in the mountains will usually tend to drift into the lower elevations. As the storms drift into the lower elevations, they are more prone to produce severe downburst winds due to greater evaporational cooling.
|
|
Fig. 22. Monsoon 2023 Severe Thunderstorm Warning (SVR) Spatial Frequency.
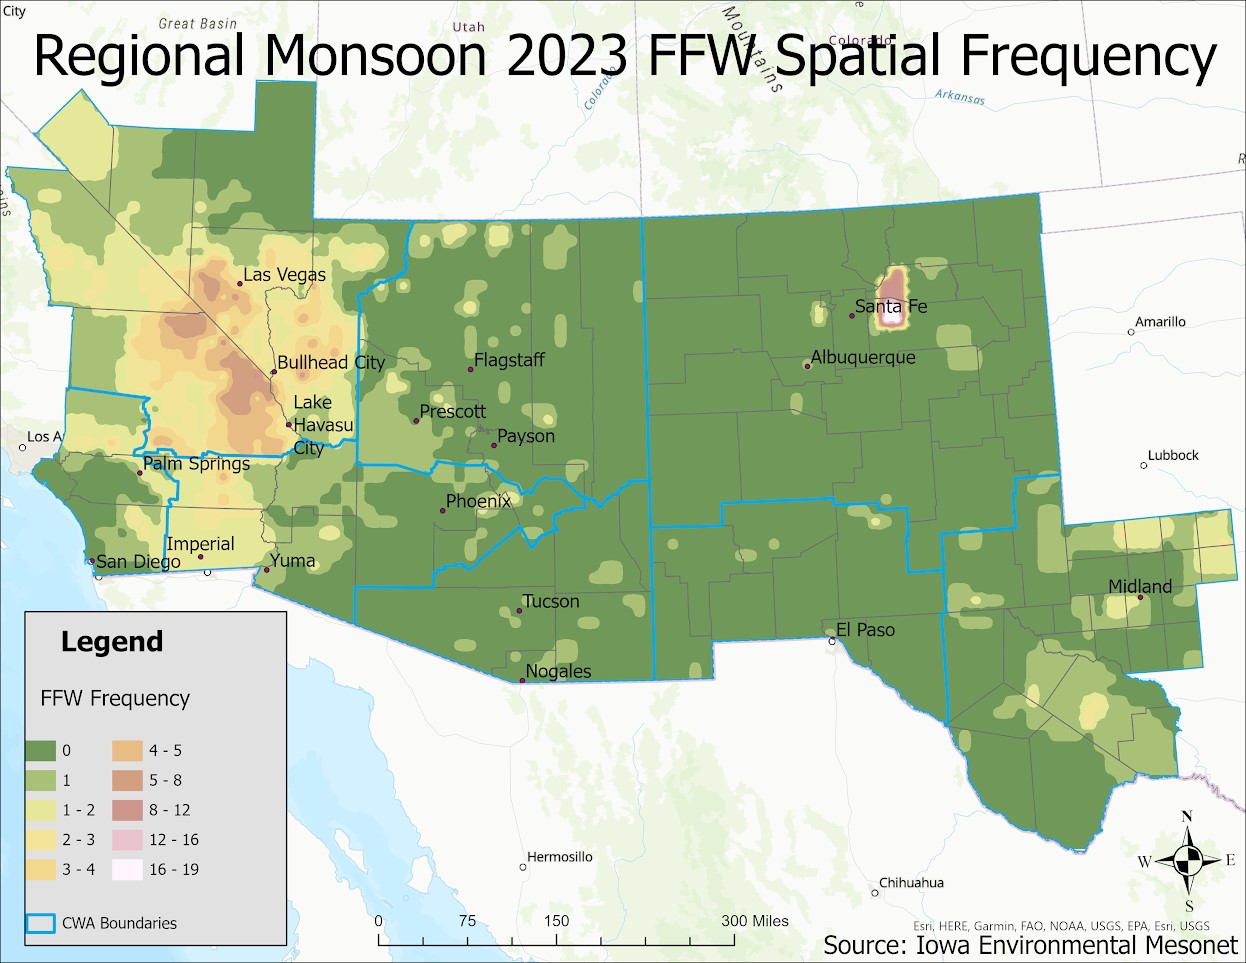
The highest concentration of Flash Flood Warnings was mainly across extreme western Arizona through most of southern California and southern Nevada as well as the burn scar areas in northern New Mexico (Fig. 23). The rest of the region, including most of central and southern Arizona through most of New Mexico and far western Texas had very little in the way of Flash Flood Warnings. This overall spatial warning distribution (i.e. number of warnings issued in a given location) coincides with the precipitation anomalies observed during the monsoon with the highest spatial concentration of warnings occurring where positive precipitation anomalies were observed and vice versa.
|
|
Fig. 23. Monsoon 2023 Flash Flood Warning (FFW) Spatial Frequency.
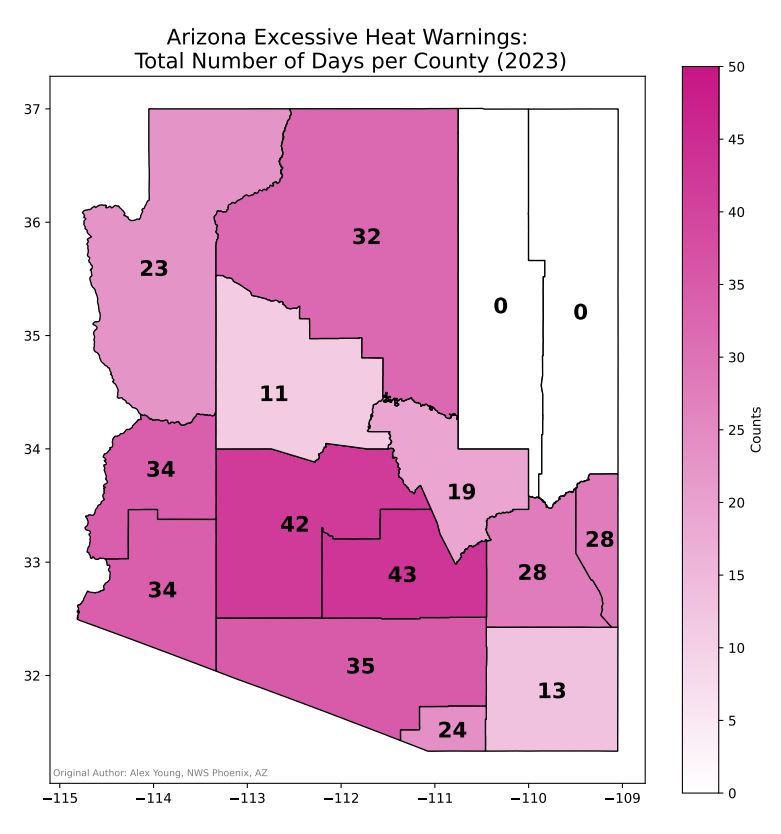
Given the much drier than normal Monsoon Season experienced, extreme heat was a very prominent hazard across the lower elevation areas, especially across the Phoenix Metropolitan area. Across Maricopa County, there were a total of 42 Excessive Heat Warning Days (Fig. 24). This is second most to 2020, which had a total of 49 Excessive Heat Warning Days. Of the 42 total Excessive Heat Warning Days in Maricopa County, 29 of those days occurred consecutively between July 1 and July 29, breaking a record. During this stretch, Phoenix experienced 30 consecutive days with high temperatures of 110+ degrees and 17 days with low temperatures of 90+ degrees, both records. According to the Maricopa County Department of Public Health, there was a record-breaking total of 645 heat-related fatalities in 2023.
|
|
Fig. 24. Total number of Excessive Heat Warning Days per County in Arizona in 2023. Source: Iowa Environmental Mesonet