September 25-27, 2025: Heavy Rainfall/Flash Flooding
& Severe Storms
Fig. 1: GOES-19 Water Vapor satellite image between 3 AM MST Sep 25th and 8 PM MST Sep 27th, 2025
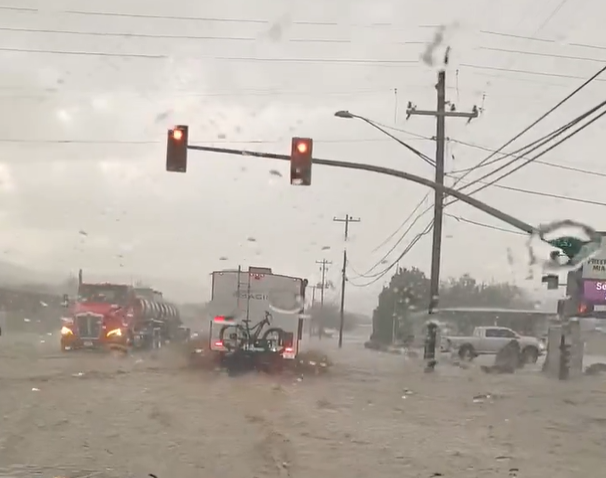
A slow-moving low pressure system brought several rounds of showers and thunderstorms through much of Arizona into southern CA between September 25-27, 2025 (Figure 1). The impacts included localized wind damage and large hail along with widespread heavy rainfall leading to numerous instances of flash flooding, which unfortunately led to loss of life. The impacts from this storm system began during the afternoon hours on Thursday, September 25, when strong to severe thunderstorms developed across the higher terrain areas of eastern AZ. A cluster of thunderstorms developed across southern Gila County and affected the Globe/Miami area with very heavy rainfall (Figure 2). Radar estimates indicated rainfall amounts of 2-3” in the Miami area, with most of the accumulations occurring in less than one hour (Figure 3). This amount of rain in such a short timespan led to significant flash flooding in the Miami area (Figure 4-5).
 |
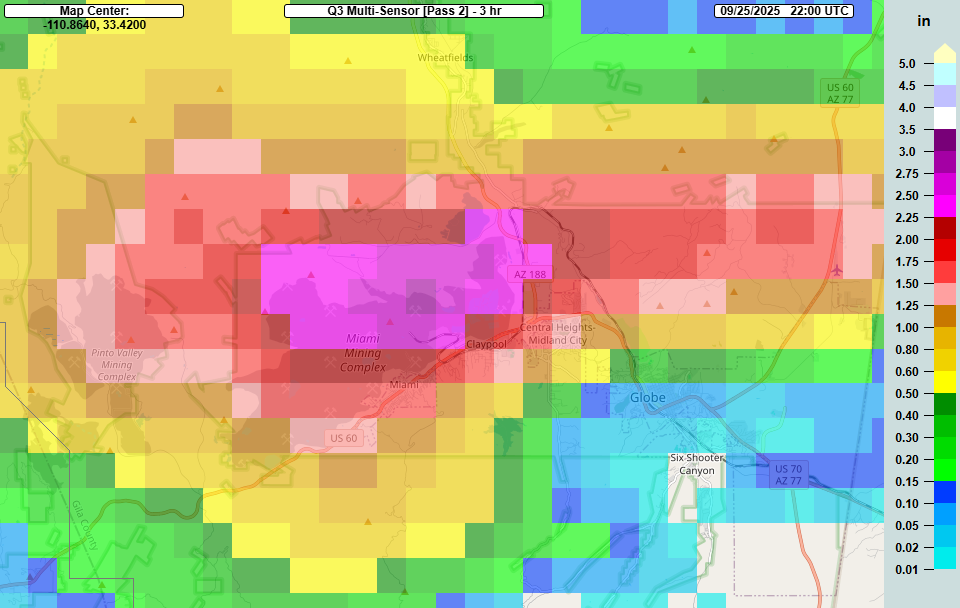 |
Fig. 2-3: Top Image: Reflectivity loop from 1:20 PM to 4:39 PM MST on Sep 25th, 2025 from the KIWA (Phoenix, AZ) radar showing the complex of storms impacting the Miami/Globe area. Bottom Image: 3-hr estimated rainfall totals from 12:00 PM to 3:00 PM MST on Sep 25th, 2025 based on the Multi-Radar Multi-Sensor (MRMS) mosaic.
 |
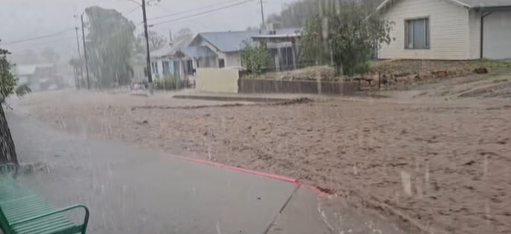 |
Fig. 4-5: Images of the flash flooding in Miami, AZ. Left image: Flooding along US-60 and New Street (@Debbie Swap on X); Right Image: Flooding along Adonis Avenue (Miami Memorial Library Page on Facebook).
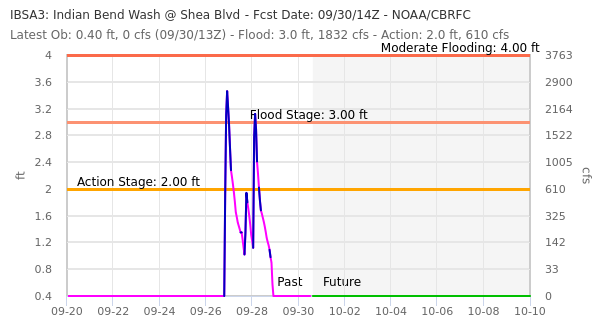
The most significant and widespread impacts from this storm system occurred on the following day, Friday, September 26th, when widespread thunderstorm activity was observed across much of south-central AZ, including the majority of the Phoenix metro area (Figure 6). Scattered thunderstorms quickly developed in the Phoenix area during the mid-morning hours with the overall areal coverage increasing heading into the early afternoon hours. Most of the storm reports that were received initially were for large hail in excess of 1” along with localized wind damage (Figures 7-8). Then, as the coverage became more widespread, the overall impacts quickly shifted into flash flooding, with numerous reports of water rescues as a result of vehicles stuck in floodwaters along local highways and streets, and washes overflowing causing low-water crossings to become impassable (Figures 9-10). Indian Bend Wash, which runs through the city of Scottsdale, had significant flooding with water levels rising to flood stage near Shea Boulevard (Figure 11). There were several reports of vehicles trapped and submerged under the flood waters (Figure 12) . One of the vehicles submerged unfortunately claimed the life of one person. When the rainfall was all said and done by the early evening hours, 1.00-2.50”, with localized amounts in excess of 2.50”, were measured across a vast portion of the Phoenix area. Phoenix Sky Harbor Airport received 1.64” of rain, which was the highest one-day rainfall since October 13, 2018, when 2.19” was measured (Figure 13).
Fig. 6: Reflectivity loop from 8:15 AM to 8:47 PM MST on Sep 26th, 2025 from the KIWA (Phoenix, AZ) radar
 |
 |
Fig. 7-8: Images of the large hail (estimated 1-1.5” diameter) in the Phoenix metro. Left image: Hail in Peoria (Tony Webb on Facebook); Right image: Hail in Sun City (Michelle Cook-Anderson on Facebook)
 |
 |
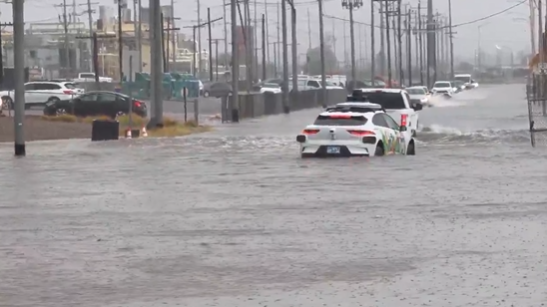
Fig. 9-10: Images of the flooding in Phoenix. Left image: Flooding near Sky Harbor International Airport by 32nd street and Washington with Waymo Taxi Car stuck in the floodwater (@dannybavaro on X); Right image: Cars stuck on the on-ramp to I-10 from Buckeye Rd (ADOT).
 |
 |
Fig. 11-12: (Top Image) Hydrograph showing the water levels at Indian Bend Wash near Shea Boulevard in Scottsdale; (Bottom Image) Car submerged in the floodwaters in Indian Bend Wash (Tyler Heard on X)
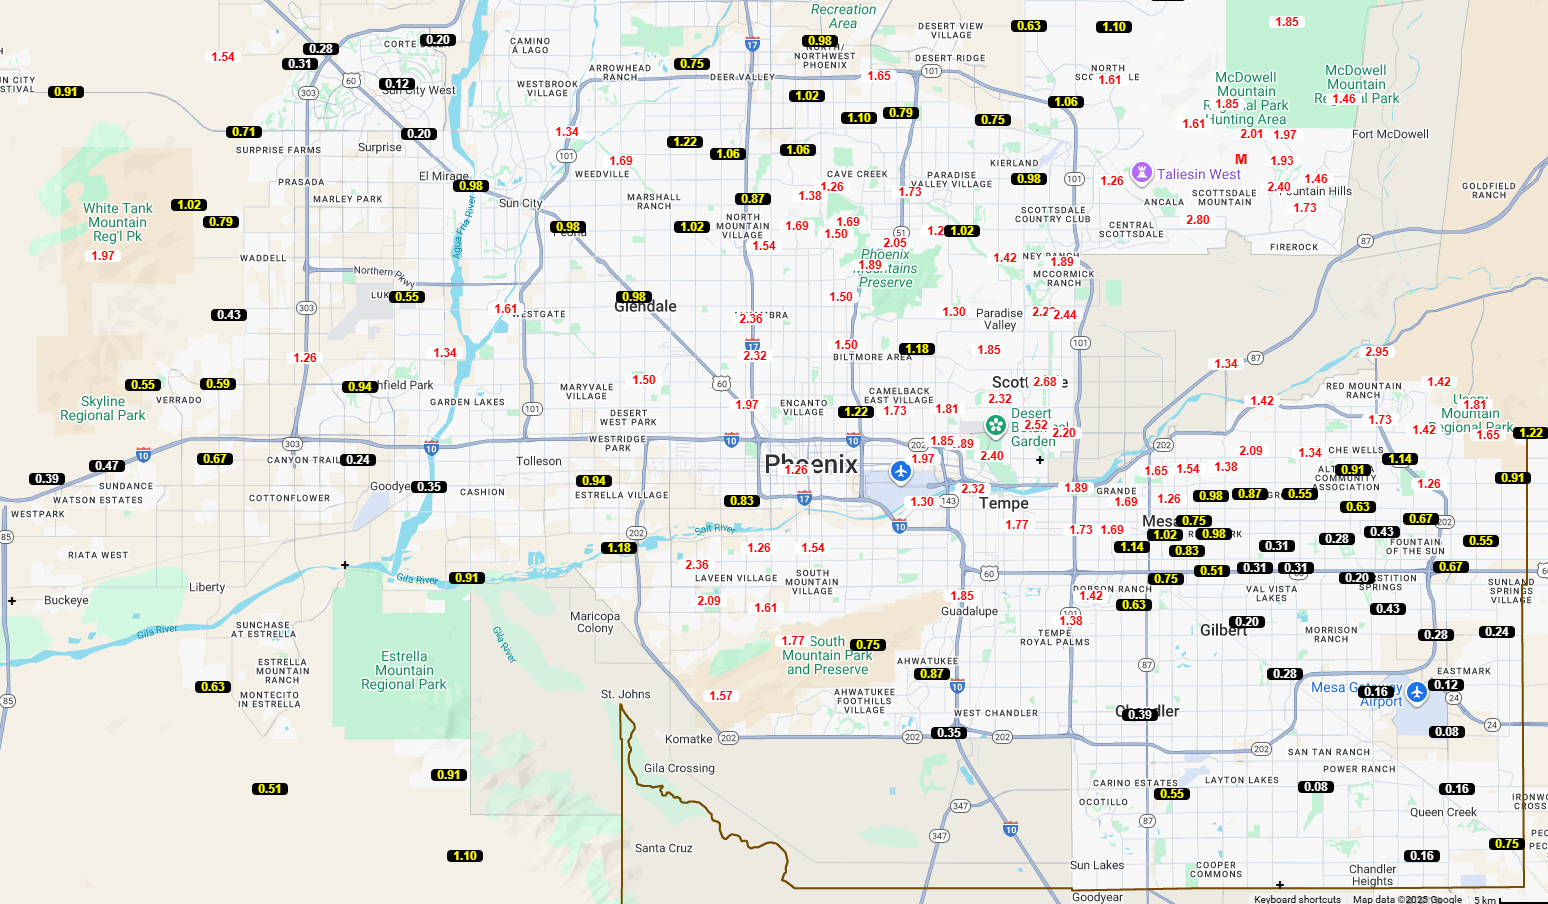 |
Fig. 13: Rainfall totals on Sep 26th, 2025 courtesy of Flood Control District of Maricopa County (Click on image for better resolution)
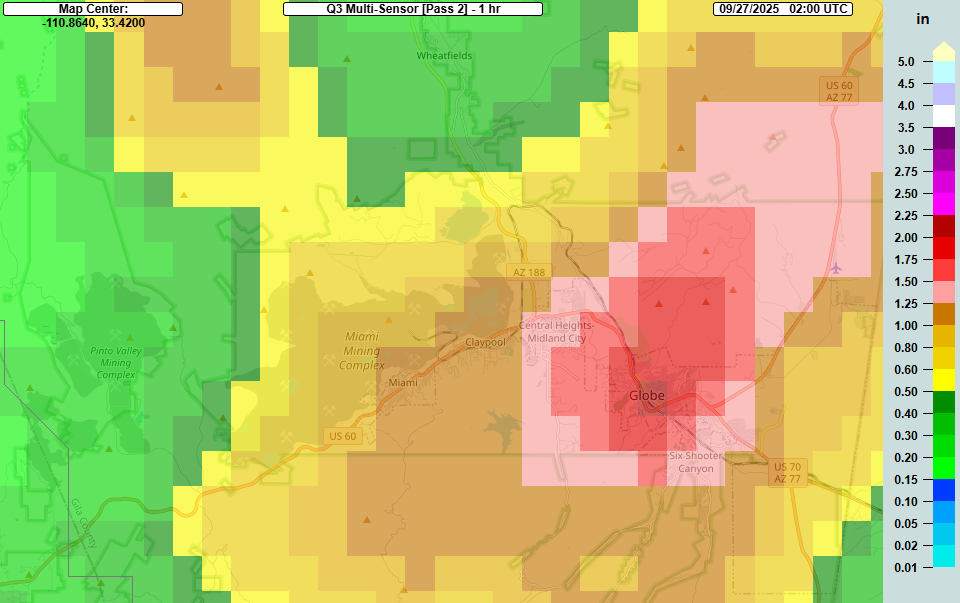
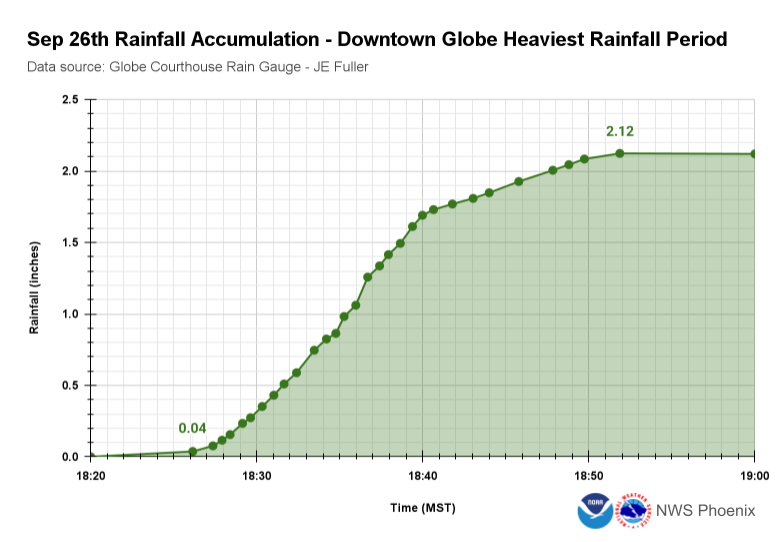
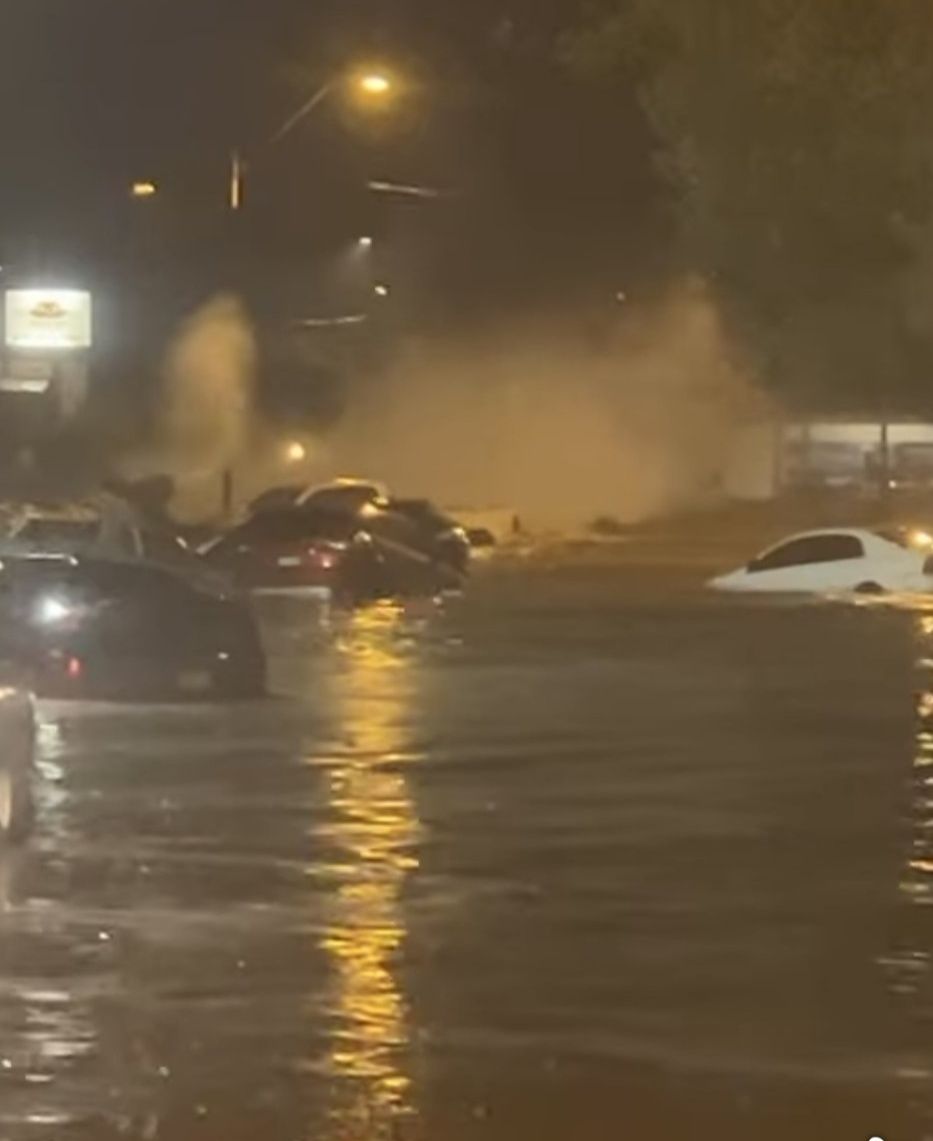
A few hours after the rainfall dissipated in the Phoenix area, a new area of strong to severe thunderstorms with very heavy rainfall once again moved eastward into southern Gila County, affecting the Globe/Miami area for a second time in just over 24 hours (Figure 6). Gauge reports and doppler radar estimates out of the Globe area measured approximately 2” of rain, with most of the rain occurring in less than 30 minutes (Figure 14-15). A stream gauge along Pinal Creek, just south of downtown Globe, reported a 6 foot water rise in 30 minutes between 6:25 PM and 6:55 PM MST (Figure 16). Subsequently, videos and images emerged from downtown Globe depicting catastrophic flooding as the flood wave in Pinal Creek overtopped bridges, inundated businesses, and flooded or swept away numerous vehicles (Figures 17-18). Around 800 propane tanks were also swept into the floodwaters from a nearby distribution center. Unfortunately, the flooding claimed three lives. A State of Emergency was declared for Globe by Globe’s Mayor, Al Gameros, on the afternoon of September 27th with an Arizona State of Emergency declared shortly after by AZ Governor Hobbs.
 |
 |
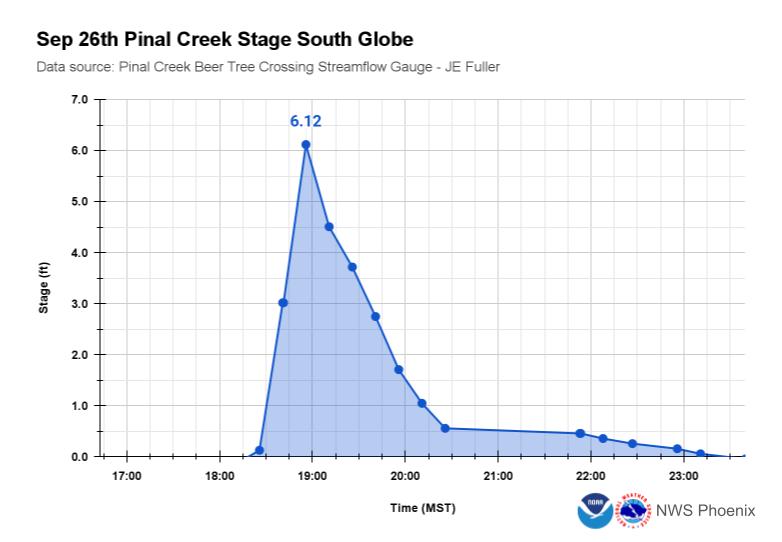 |
Fig. 14-16: (Top Image) 1-hr estimated rainfall totals from 6:00 PM to 7:00 PM MST on Sep 26th, 2025 based on the Multi-Radar Multi-Sensor (MRMS) mosaic; (Middle image) Graph showing the rainfall accumulation between 6:40 PM and 7:00 PM MST at a gauge in Downtown Globe; (Bottom image) Graph showing the drastic water rise along Pinal Creek just south of downtown Globe.
 |
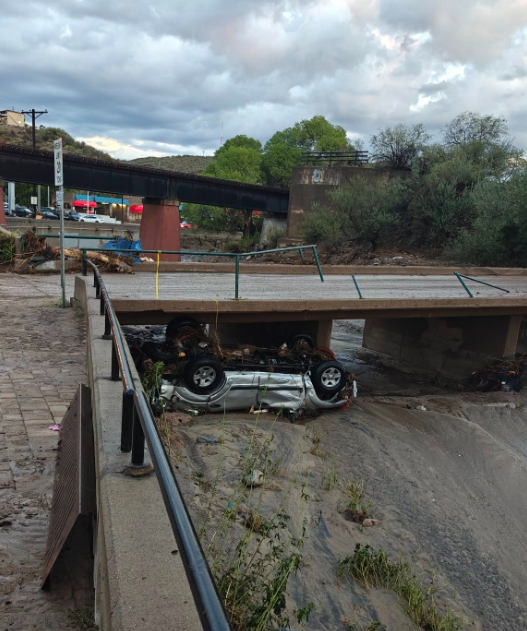 |
Fig. 17-18: Images of the catastrophic flooding and aftermath in Globe. Left image: Image of cars submerged and floating away from the floodwaters in Downtown Globe (Denise Holmes on Facebook); Right image: Image of the aftermath showing a car tangled up below a bridge over Pinal Creek in Downtown Globe the morning after (Greg Bucher on Facebook).
Additional shower and thunderstorm activity materialized on Saturday, September 27th, with activity this time developing further west across portions of southeast CA through southwest AZ during the morning and early afternoon hours. Although impacts with the rainfall activity were not as significant, there were some isolated flash flood incidents. Additional activity did develop across south-central AZ as well, including across portions of the Phoenix area, during the afternoon hours. Coverage was more isolated compared to the previous day, but the storms still produced additional flash flooding and severe winds gusts. Another thunderstorm cell once again moved through the already flood ravaged area of Globe/Miami in the afternoon. Despite rainfall amounts remaining under an inch with this storm, due to quick storm motion, flash flooding occurred once again in the area, exacerbated by the very saturated soils from rainfall the previous two days. US 60 in Miami became impassable, along with other reports of inundated low-water crossings.
Storm Environment:
The environment was primed for strong to severe storms and flooding, especially over south-central AZ. Precipitable water, a measure of the amount of atmospheric water vapor in a vertical column of air, reached 150% of normal for late September at 1.1-1.3” (Figure 19). This anomalous moisture combined with moderate to high instability, with MLCAPE values peaking at 1500-2000 J/kg, and the strong dynamic forcing along the eastern and northern flank of the low pressure circulation was a recipe for heavy rain producing thunderstorms (Figure 20). Additionally, the combination of moderate to high instability with 0-6 km shear in excess of 30 kts, and unusually cold temperatures aloft (near -10°C at 500 mb), was conducive for the development of organized severe thunderstorms capable of producing large hail of 1”+ in diameter and localized damaging winds (Figure 21-22).
 |
Fig. 19: Animation loop of the Precipitable Water Values between 11 AM MST Sep 25th and 5 PM MST Sep 27th, 2025
 |
Fig. 20: Animation loop of the Mixed Layer Convective Available Potential Energy (MLCAPE) AND Mixed Layer Convective Inhibition (MLCIN) between 11 AM MST Sep 25th and 5 PM MST Sep 27th, 2025
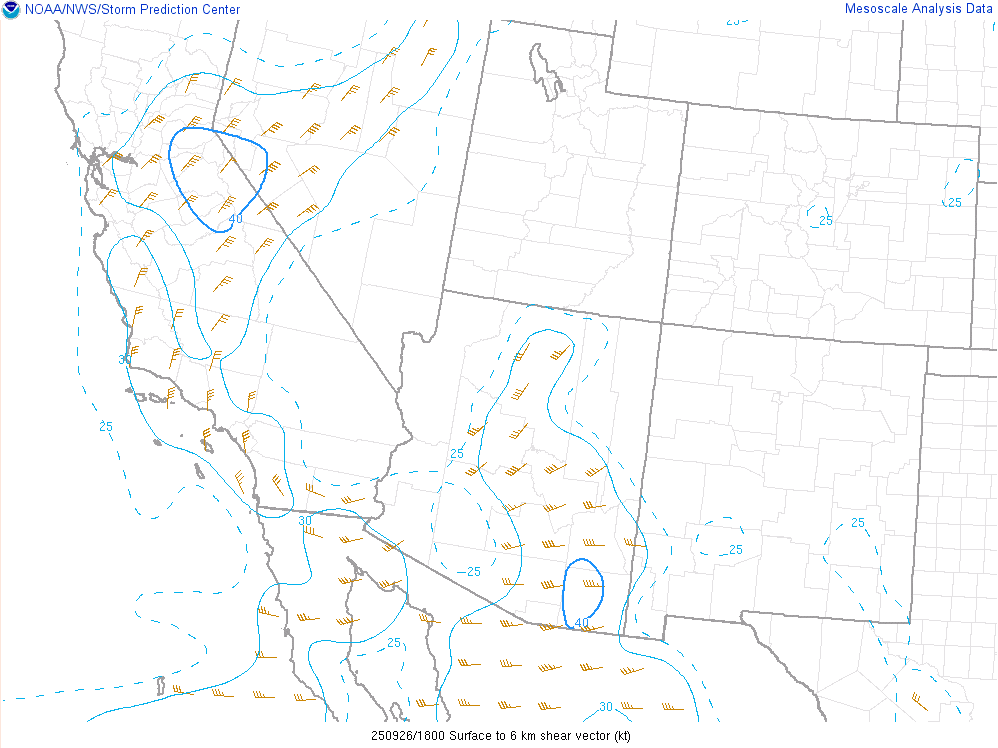 |
Fig. 21: Surface to 6 km shear at 11 AM MST Sep 26th, 2025
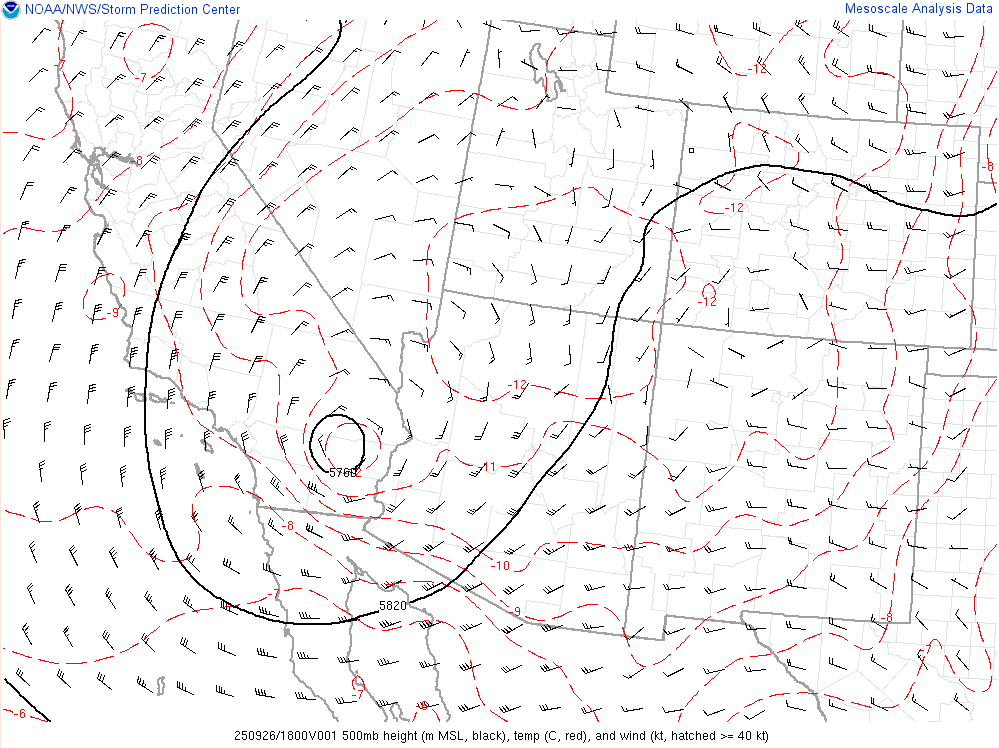 |
Fig. 22: 500 mb heights, temperature, and winds at 11 AM MST Sep 26th, 2025
Messaging:
NWS Phoenix began highlighting the potential for a high impact event starting on Monday, September 22 with a weather story graphic that was posted on the weather.gov/psr webpage and social media highlighting the potential for strong thunderstorms by the end of the week (Figure 23). As the event drew closer and confidence increased, another weather story graphic with more detailed information about the timing and expected impacts from the rain and thunderstorm activity was published (Figure 24).
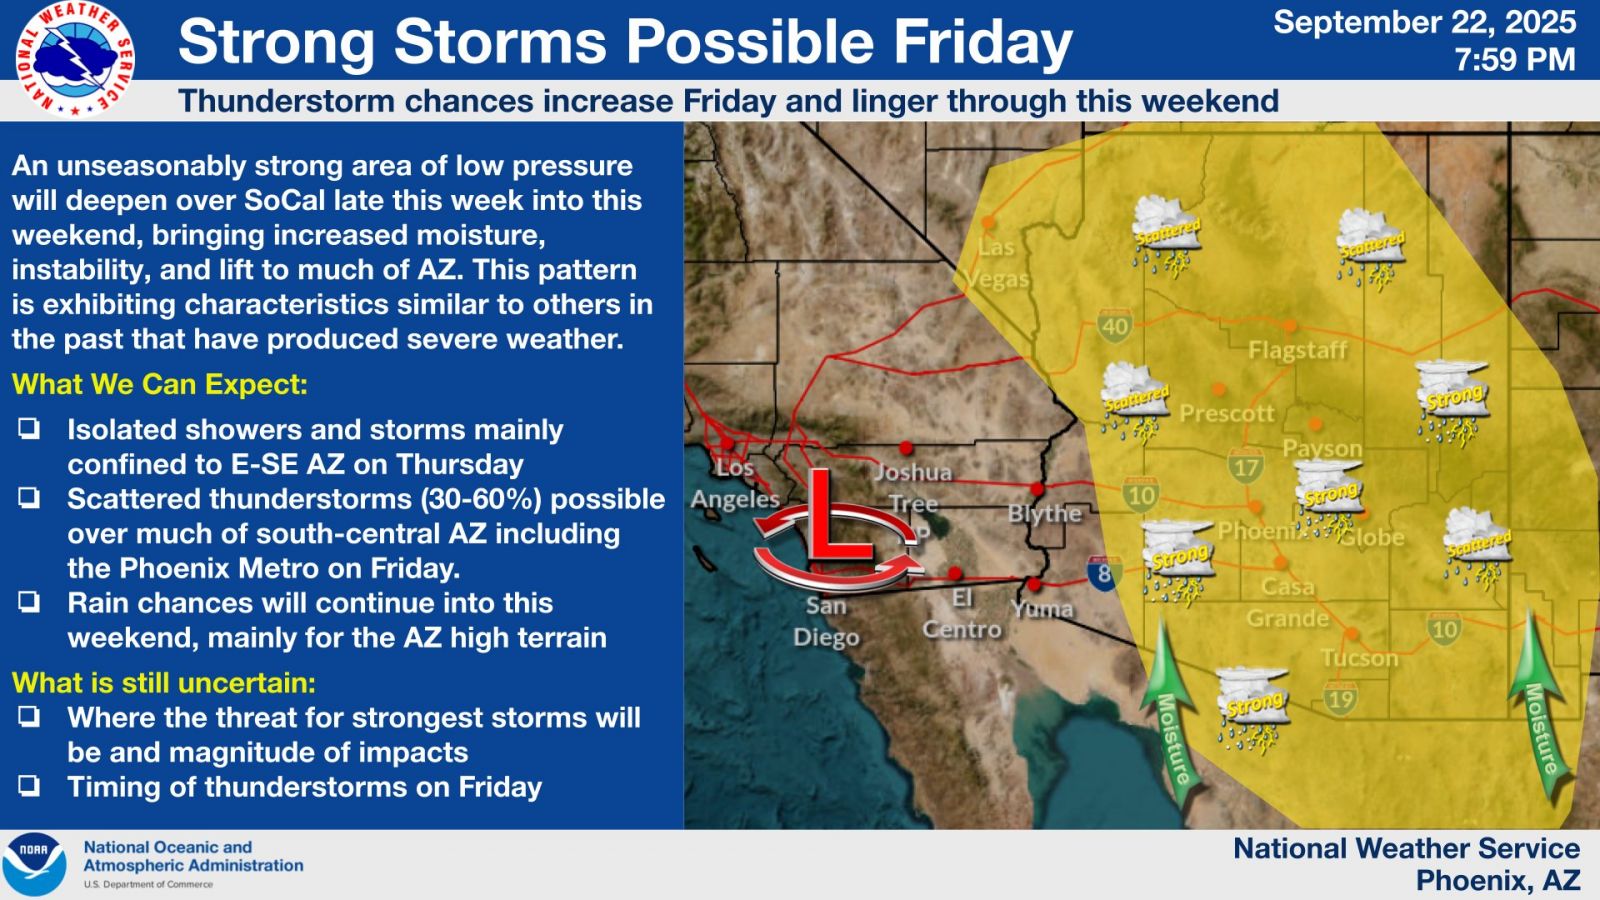 |
Fig. 23: Weather story graphic published during the evening hours on Sep 22nd, 2025 highlighting the potential for strong thunderstorms later in the week.
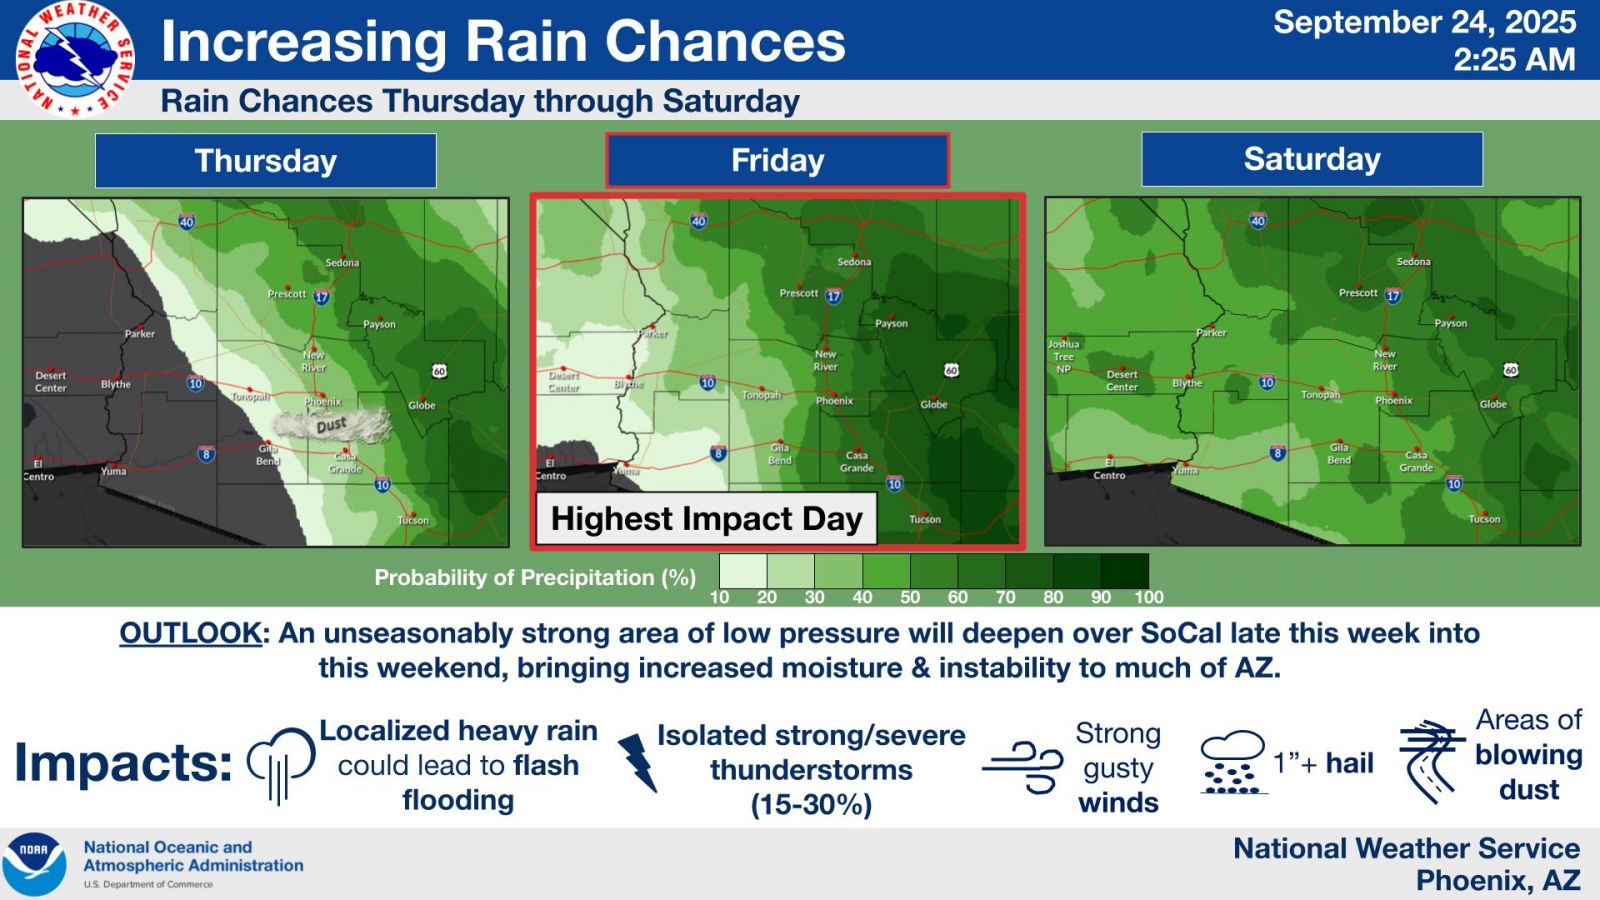 |
Fig. 24: Weather story graphic published on Sep 24th, 2025 highlighting the potentially very active conditions the following days.
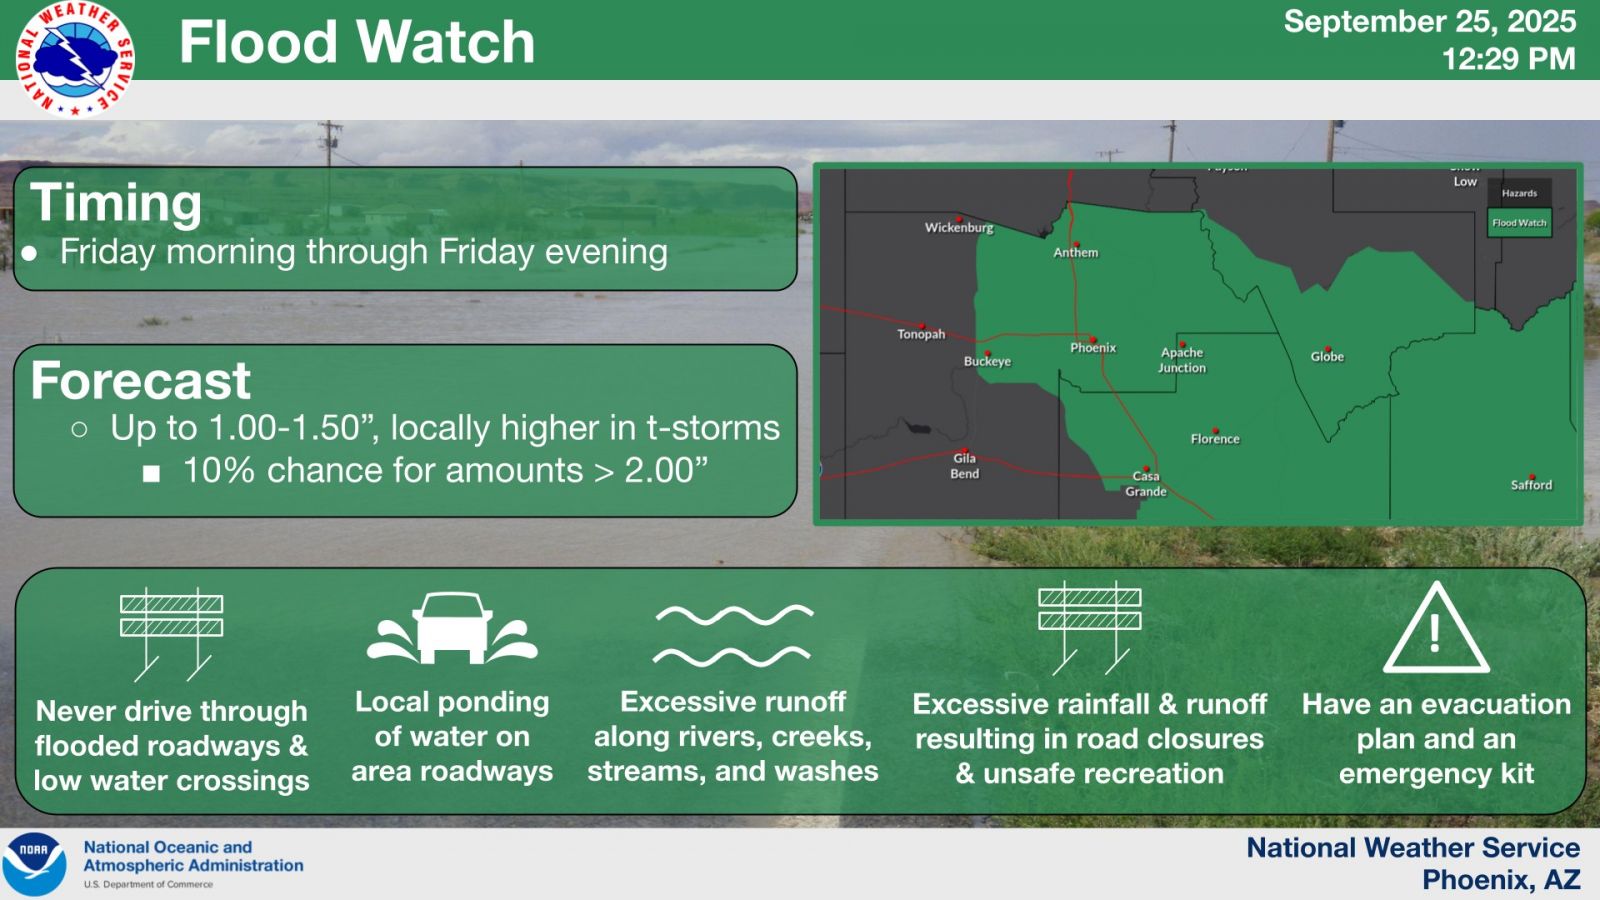
At around 1 PM MST on September 24th, a Flood Watch was initially issued for much of eastern and southeastern AZ, just east of the Phoenix Metro. Then as confidence of heavy rainfall affecting the Phoenix metro increased, the watch was expanded to include Phoenix at around 9:30 AM MST on September 25th (Figure 25). Another Flood Watch was eventually issued for portions of southeast CA and southwest AZ at around 2 AM MST/PDT on September 27th for the potential for locally heavy rainfall leading to flash flooding later that same day (Figure 26). As thunderstorms were erupting across the Phoenix area during the late morning hours on September 26th, the Storm Prediction Center, in collaboration with NWS Phoenix, NWS Tucson, and NWS Flagstaff, issued a Severe Thunderstorm Watch across most of south-central and southeast AZ. When all was said and done, NWS Phoenix issued a total of 26 Flash Flood Warnings and 26 Severe Thunderstorm Warnings during the three-day stretch of September 25-27th (Figures 27-28).
 |
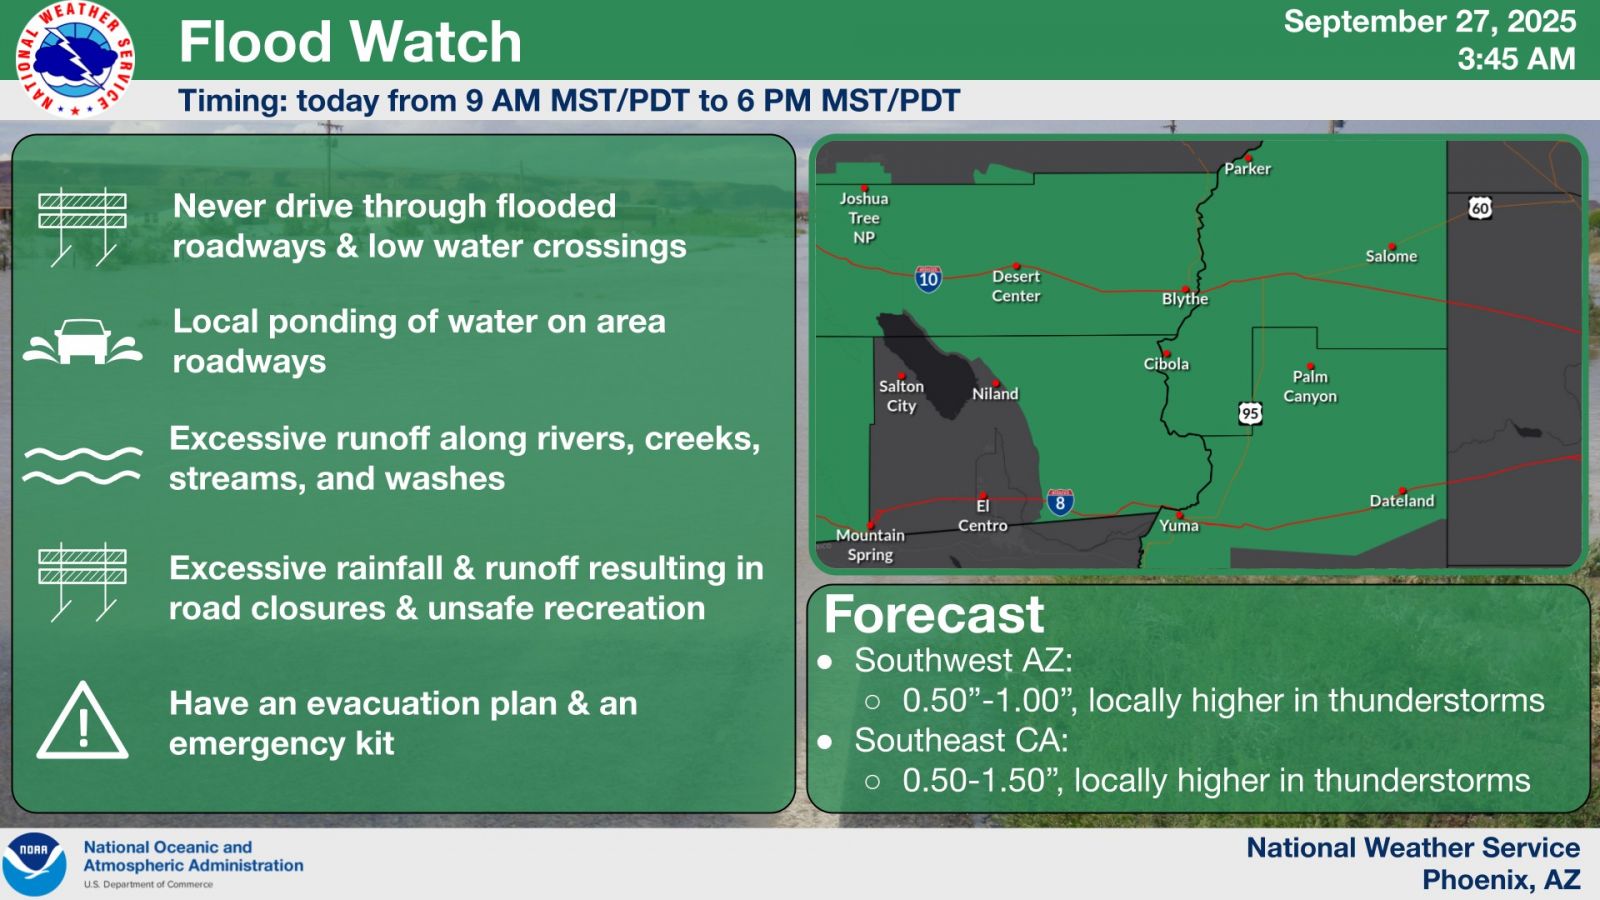 |
Fig. 25-26: Top Image: Weather story graphic highlighting the Flood Watch issued for the Phoenix metro and points south and east; Bottom Image: Weather Story graphic highlighting the Flood Watch issued for portions of southeast CA and southwest AZ.
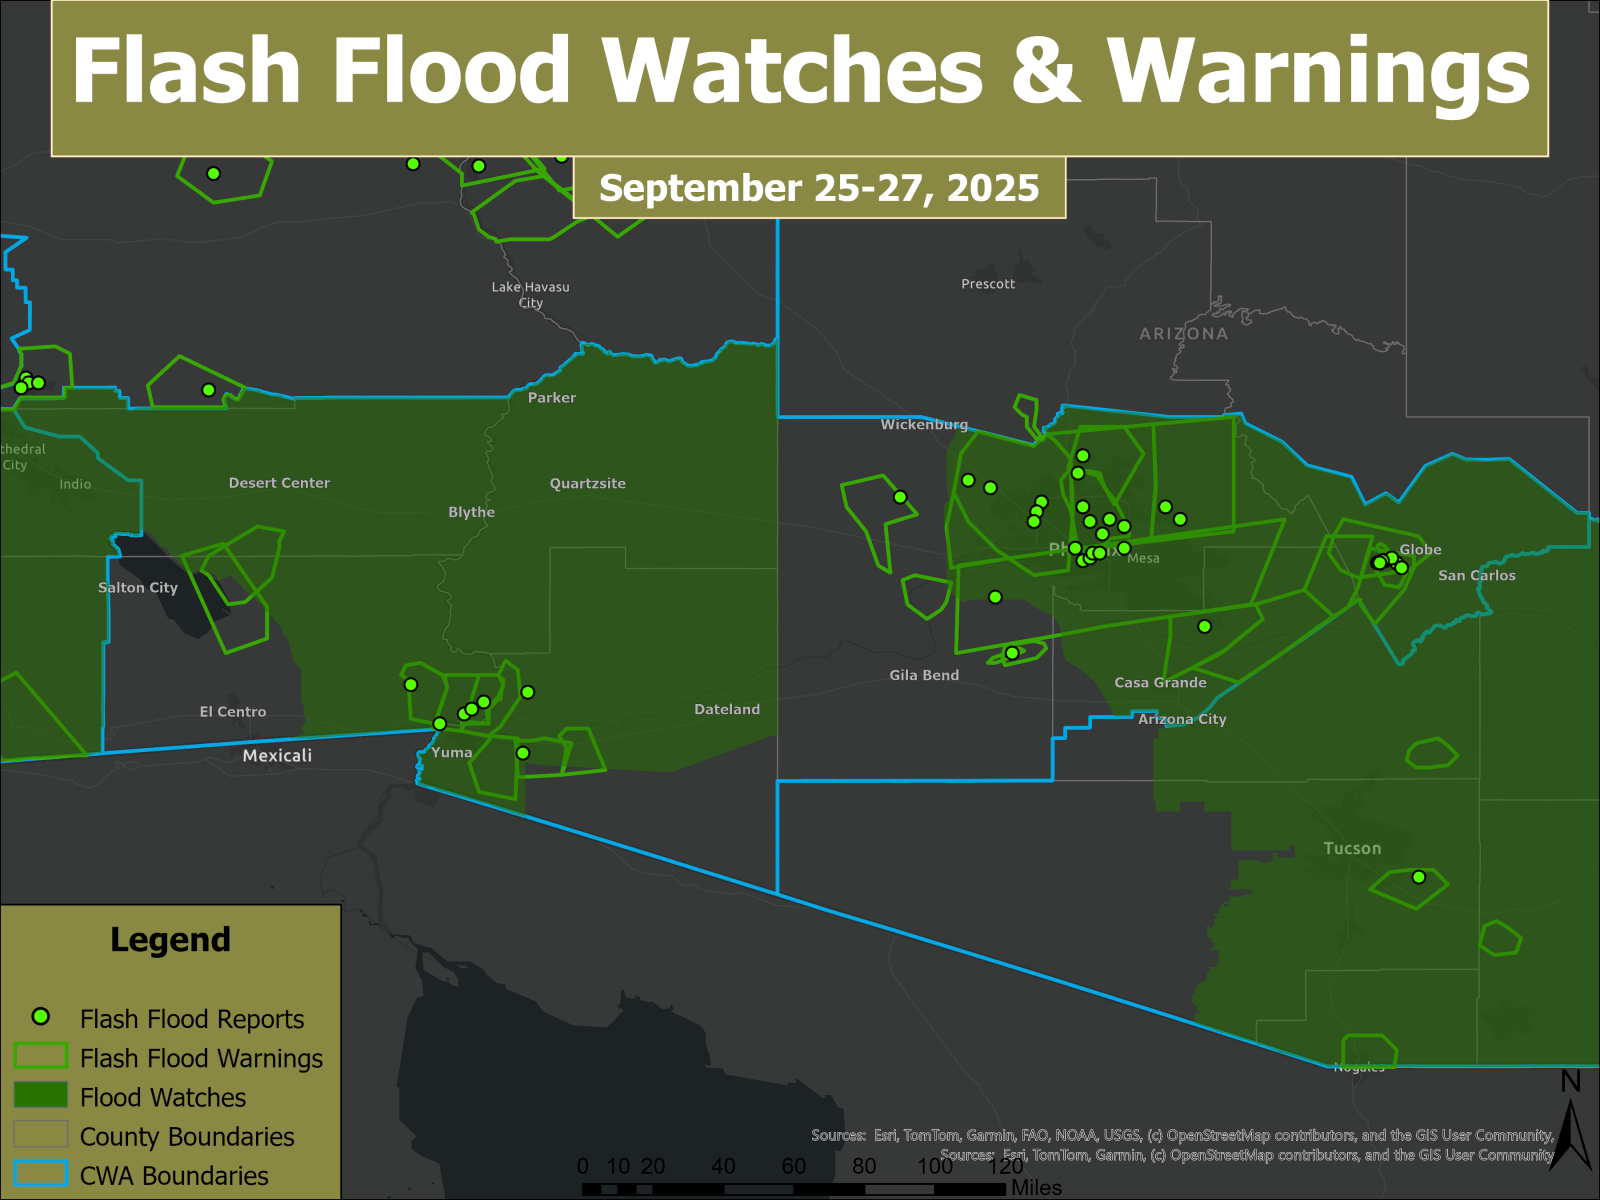 |
Fig. 27: Spatial extent of the Flood Watches and Flash Flood Warnings issued by the NWS Offices in Phoenix, Flagstaff, Tucson, and Las Vegas on Sep 25-27th, 2025, with locations of flash flood reports indicated with green dots.
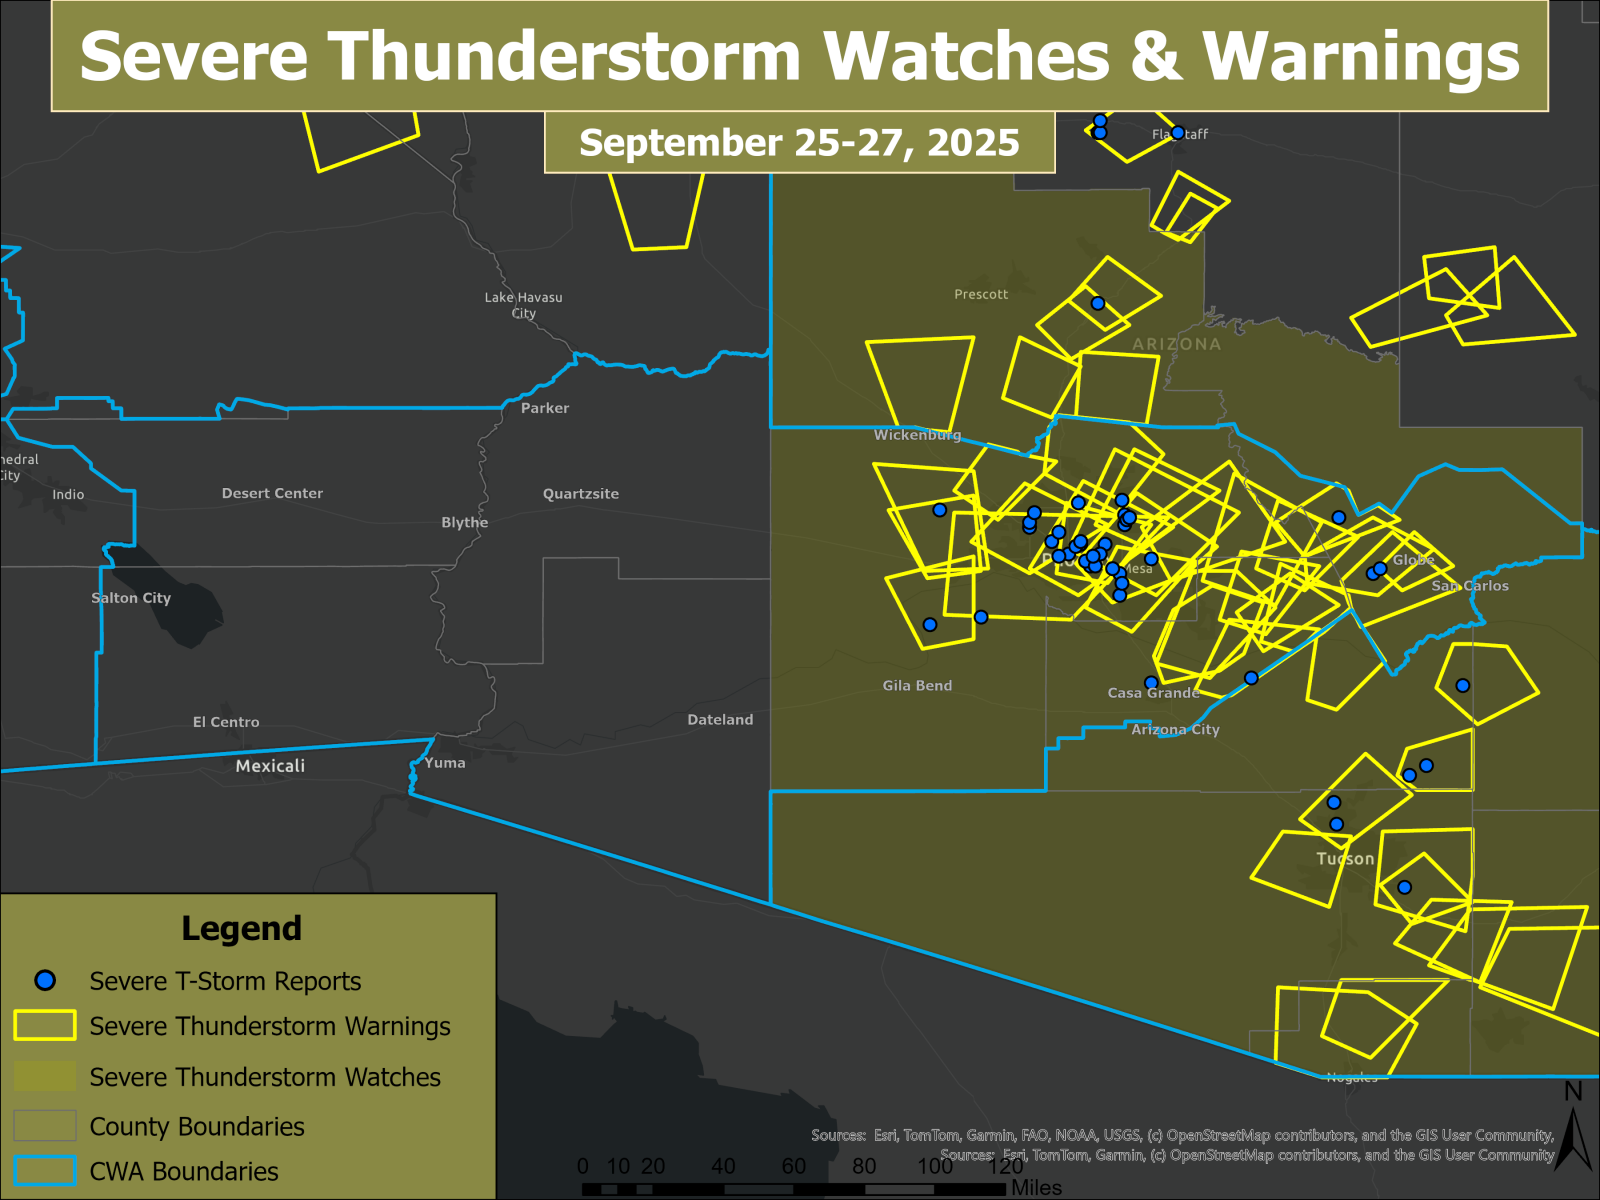 |
Fig. 28: Spatial extent of the Severe Thunderstorm Watch and Warnings issued by the Storm Prediction Center and NWS Offices in Phoenix, Flagstaff, Tucson and Las Vegas on September 25-27, 2025. Locations of thunderstorm wind damage/severe gusts (wind gusts ≥ 58 mph) reports are noted with the blue dots.

