|
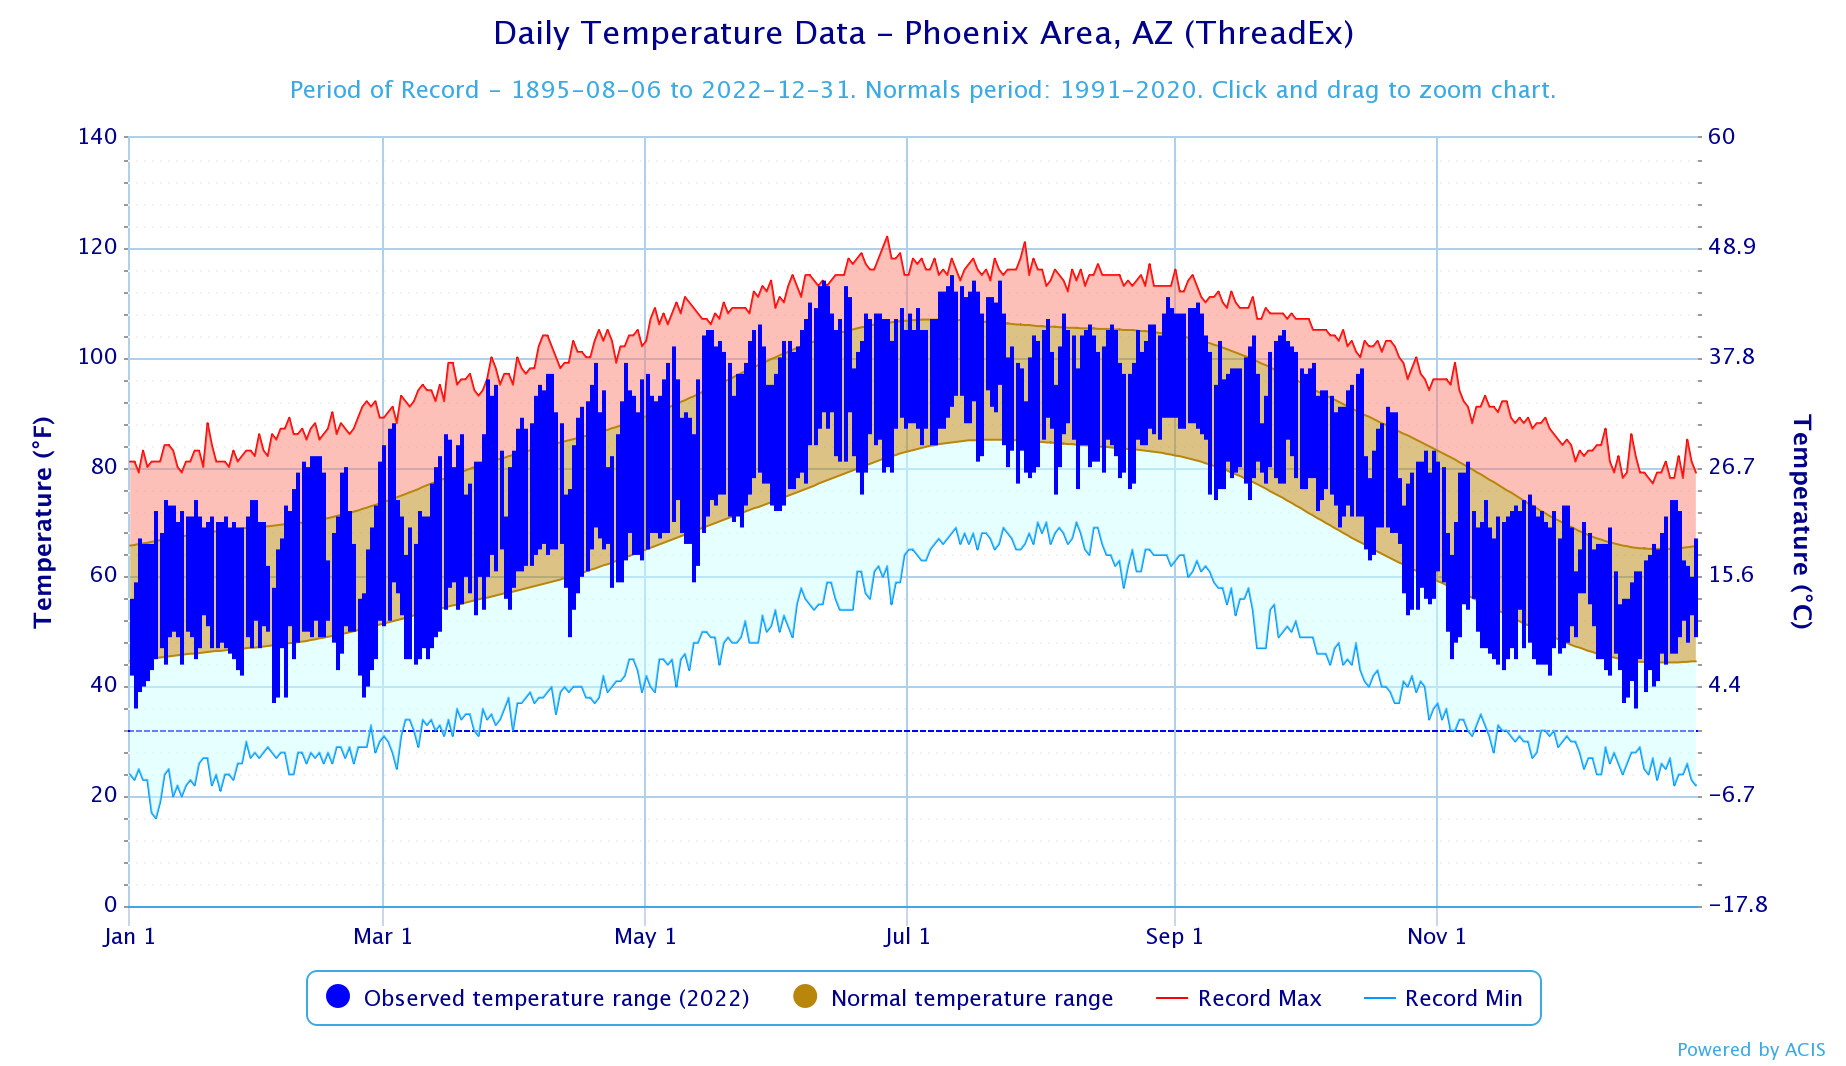
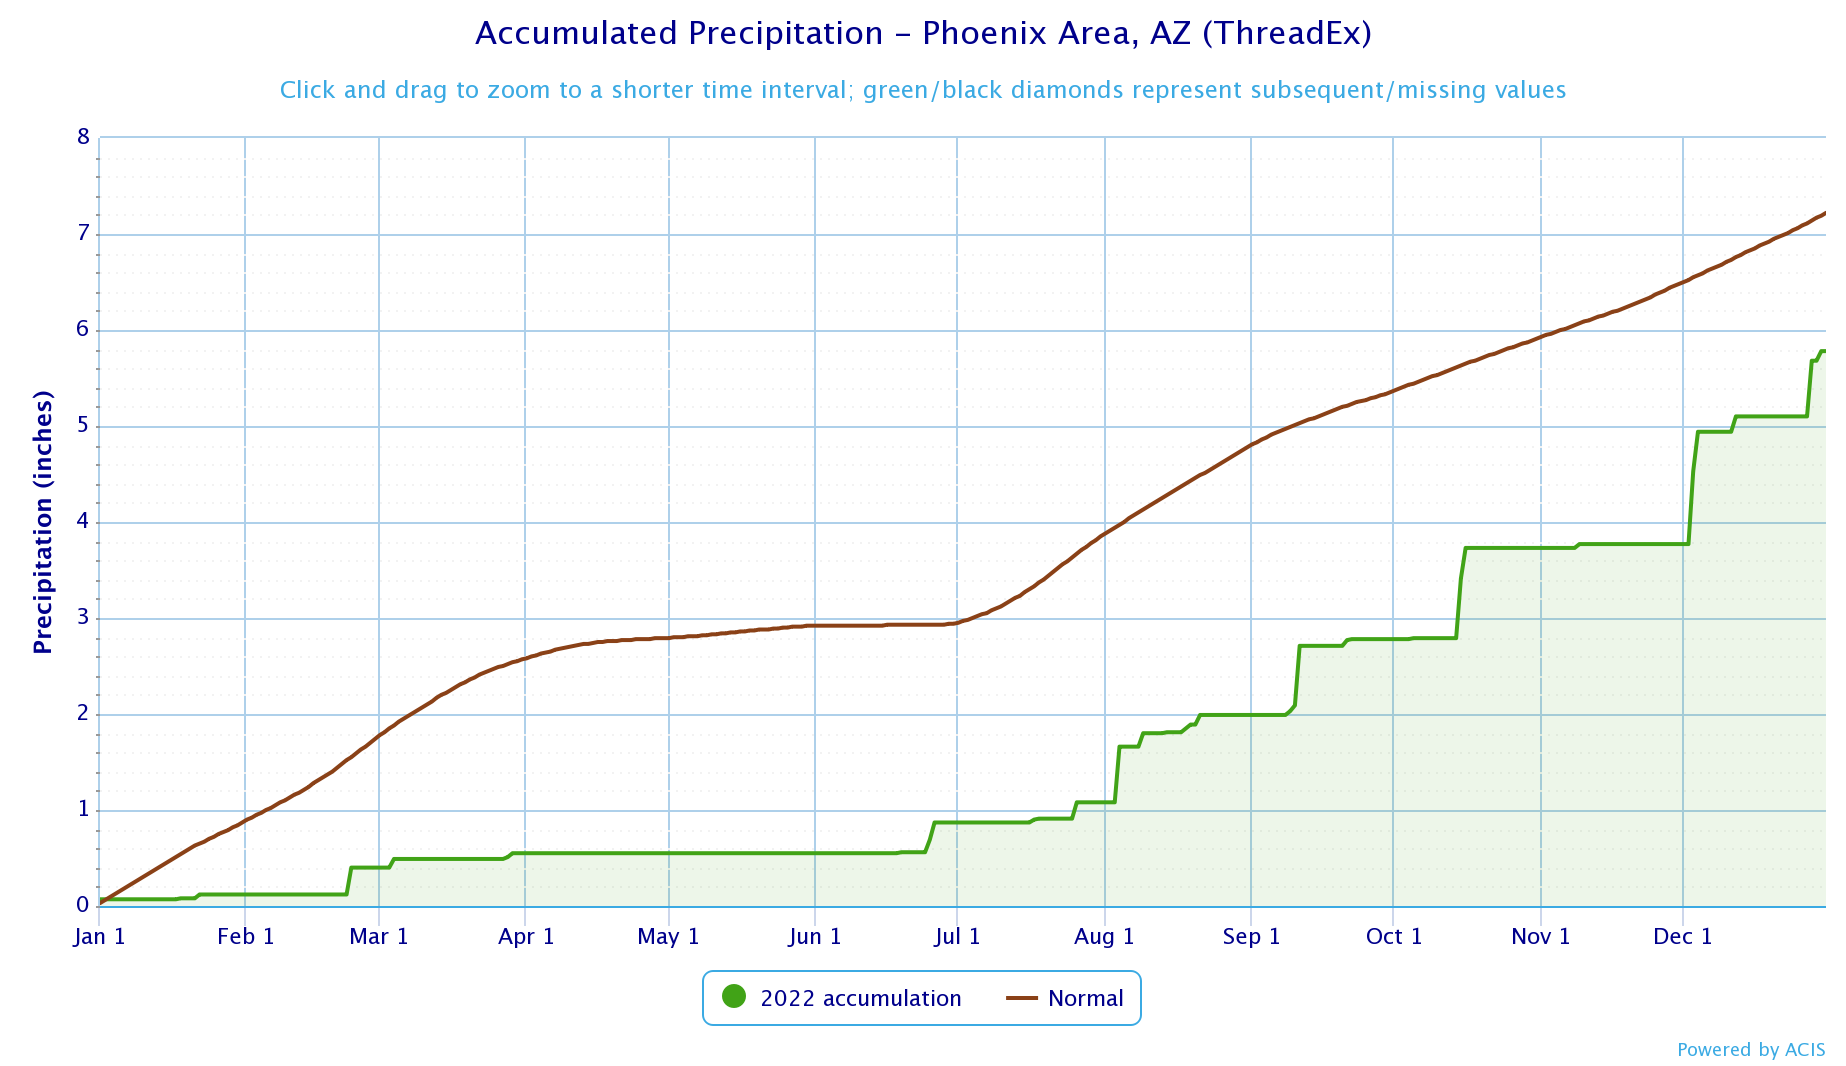
The year 2022 ended up being the 12th warmest year recorded in the history of Phoenix, Arizona, and tied for 12th warmest in Yuma. Extensive missing temperature data at El Centro precludes any definitive ranking this year. Rainfall in Phoenix for the year was slightly below average, and ranked as the 89th wettest. Equipment failures at Yuma failed to record events required to make an annual total. Records for Phoenix began in 1896, first taken in downtown and since moved to Sky Harbor airport in the 1950s. Records in Yuma began in 1878. A persistent moderate La Nina pattern from 2021 continued into 2022 with drier than normal conditions across the region during the first part of the year. The vast majority of weather systems passed well north of the area with only a few light precipitation events. This pattern allowed for mostly moderate temperatures not far from a normal range. The dry regime continued into spring and early summer 2022, however similar to the past several years, temperatures warmed into a well above normal range. April through July 2022 were regularly warmer than normal with 3 of 4 of those months ranking in the top 10 warmest for Phoenix. With a couple years of drier weather, fine fuels were less evident in lower elevations this year, and preventative measures in higher elevations helped keep wildfire activity and burned acreage to less than anticipated levels. The prolonged drought continued across the state with widespread coverage of Extreme and Exceptional categories entering monsoon 2022. The 2022 summer monsoon started fairly early in mid June with a few thunderstorm events before the pattern shifting towards a less favorable regime in early July. However, the monsoon wind pattern shifted during the latter half of July with a favorably wet pattern during a large portion of late July and the majority of August. The rainfall was very welcome given the expansive drought, however the frequency and intensity of the storms resulted in many severe and flash flooding events. Several of these monsoon storms resulted in significant impacts including July 17, July 28, and Aug 30-31. Occasional monsoon thunderstorm days continued into September before transitioning into a autumn pattern including a period of severe weather on Oct 15-16. La Nina conditions continued through the end of 2022 with a generally dry start to the Water Year. However, the overall weather pattern started to buckle in November yielding well below normal temperatures followed by an active, wet pattern for periods during December as the first signs of the deterioration of the persistent La Nina were emerging heading into 2023.
|
***Please note all climatic data are considered preliminary until validated by the National Centers for Environmental Information*** |
Phoenix Annual Temperature Rankings (Warmest Years)
|
|
|
|---|
|
|
Avg Max Temp |
Highest
Temp |
Avg Min Temp
|
Lowest Temp
|
Avg Temp
|
Rank (1=Warmest, 127=Coldest)
|
|---|---|---|---|---|---|---|
| Jan |
69.5
|
74 on the 29th & 30th
|
45.9
|
36 on the 2nd
|
57.7 /+0.9
|
12th
|
| Feb |
71.7
|
82 on the 13th & 14th
|
46.6
|
37 on the 3rd
|
59.1 /-0.8
|
43rd
|
| Mar |
79.9
|
96 on the 25th
|
53.9
|
44 on the 8th
|
66.9 /+0.6
|
17th
|
| Apr |
90.1
|
99 on the 19th & 26th
|
62.3
|
49 on the 13th
|
76.2 /+3.0
|
7th
|
| May |
97.6
|
106 on the 27th
|
70.6
|
59 on the 12th
|
84.1 /+2.1
|
11th
|
| Jun |
106.5
|
114 on the 11th
|
81.9
|
72 on the 1st
|
94.2 /+2.8
|
6th
|
| Jul |
107.5
|
115 on the 11th
|
86.0
|
77 on the 26th
|
96.7 /+1.2
|
7th
|
| Aug |
103.5
|
111 on the 30th
|
83.2
|
75 on the 4th
|
93.3 /-1.1
|
28th
|
| Sep |
101.7
|
110 on the 6th
|
80.5
|
74 on the 10th & 18th
|
91.1 /+1.9
|
6th
|
| Oct |
88.0
|
99 on the 3rd
|
66.8
|
53 on the 25th
|
77.4 /+0.0
|
24th
|
| Nov |
72.3
|
81 on the 1st & 8th
|
48.1
|
42 on the 27th
|
60.2/-4.9
|
85th
|
| Dec |
65.0
|
74 on the 25th & 26th
|
46.0
|
36 on the 17th
|
55.5/-0.3
|
42nd
|
(*** click on month for more comprehensive monthly summary ***)
| Record Highs Set in 2022 |
|---|
| Date | Record | Previous Record |
|---|---|---|
| Mar 25 |
96
|
93 in 1990
|
| Jun 10 |
113
|
111 in 1978
|
| Jun 11 |
114 - tied record
|
114 in 1918
|
| Jun 12 |
113
|
112 in 2019
|
| No Record Lows were set in 2022 |
|---|
Yuma Annual Temperature Rankings (Warmest Years)
|
|
|
|---|
|
|
Avg Max Temp |
Highest
Temp |
Avg Min Temp
|
Lowest Temp
|
Avg Temp
|
Rank (1=Warmest, 146=Coldest)
|
|---|---|---|---|---|---|---|
| Jan |
71.5
|
77 on the 13th & 14th
|
46.5
|
37 on the 2nd
|
59.0 /+0.2
|
26th
|
| Feb |
74.3
|
86 on the 11th & 12th
|
47.0
|
36 on the 24th
|
60.7 /-1.2
|
61st
|
| Mar |
81.8
|
95 on the 25th
|
53.9
|
43 on the 9th
|
67.9 /+0.3
|
26th
|
| Apr |
89.3
|
99 on the 8th
|
60.1
|
50 on the 13th
|
74.7 / +1.6
|
22nd
|
| May |
95.8
|
106 on the 15th
|
66.1
|
58 on the 11th & 12th
|
81.0 /+0.4
|
28th
|
| Jun |
105.6
|
112 on the 11th & 12th
|
77.0
|
67 on the 1st
|
91.7 /+2.6
|
9th
|
| Jul |
106.7
|
114 on the 11th
|
83.9
|
74 on the 6th
|
95.3 /+0.7
|
18th
|
| Aug |
105.0
|
113 on the 30th
|
83.7
|
76 on the 22nd
|
94.4 /-0.4
|
25th
|
| Sep |
101.1
|
113 on the 4th & 5th
|
80.9
|
74 on the 16th
|
91.0 /+1.5
|
10th
|
| Oct |
90.2
|
100 on the 4th
|
67.3
|
52 on the 30th
|
78.7 /+0.7
|
27th
|
| Nov |
73.2
|
86 on the 1st
|
50.5
|
43 on the 23rd and 26th
|
61.9 /-4.2
|
104th
|
| Dec |
67.9
|
78 on the 25th & 26th
|
46.2
|
38 on the 13th & 14th
|
57.0 /-0.3
|
62nd
|
(*** click on month for more comprehensive monthly summary ***)
| No Record Highs Set in 2022 |
|---|
| No Record Lows were set in 2022 |
|---|
El Centro Annual Temperature Rankings (Warmest Years)
|
|
|
|---|
|
|
Avg Max Temp |
Highest
Temp |
Avg Min Temp
|
Lowest Temp
|
Avg Temp
|
Rank (1=Warmest, 97=Coldest)
|
|---|---|---|---|---|---|---|
| Jan |
71.4
|
79 on the 14th
|
41.4
|
31 on the 2nd & 3rd
|
56.4 /+0.4
|
32nd
|
| Feb |
73.8
|
87 on the 11th
|
41.7
|
32 on the 4th
|
57.8 /-1.6
|
38th
|
| Mar |
81.9
|
95 on the 26th
|
50.4
|
37 on the 8th
|
66.1 /+0.8
|
25th
|
| Apr |
89.1
|
101 on the 9th
|
56.5
|
46 on the 13th
|
72.8 / +1.9
|
25th
|
| May |
96.0
|
107 on the 15th
|
63.0
|
49 on the 12th
|
79.5 /+1.3
|
25th
|
| Jun |
105.5
|
114 on the 12th
|
74.0
|
59 on the 19th
|
89.7 /+2.9
|
6th
|
| Jul |
108.0
|
114 on the 16th
|
81.1
|
69 on the 4th & 5th
|
94.5 /+1.4
|
9th
|
| Aug |
106.8
|
114 on the 30th
|
83.1
|
79 on the 5th & 13th
|
95.0 /+1.4
|
7th
|
| Sep |
100.9
|
114 on the 5th
|
77.4
|
68 on the 18th & 19th
|
89.1 /+1.9
|
11th
|
| Oct |
M
|
100 on the 5th
|
M
|
48 on the 25th
|
M/M
|
Missing
|
| Nov |
73.2
|
86 on the 1st
|
45.1
|
39 on the 18th
|
59.2 /-4.1
|
84th
|
| Dec |
M
|
79 on the 25th
|
M
|
34 on the 14th
|
M /M
|
Missing
|
(*** click on month for more comprehensive monthly summary ***)
| Record Highs Set in 2022 |
|---|
| Date | Record | Previous Record |
|---|---|---|
| Mar 25 |
94 - tied record
|
94 in 1988
|
| May 15 |
107 - tied record
|
107 in 1934
|
| Jun 11 |
113 - tied record
|
113 in 1939
|
| Record Lows Set in 2022 |
|---|
| Date | Record | Previous Record |
|---|---|---|
| Mar 8 | 37 - tied record | 37 in 2012 |
| May 12 |
49
|
50 in 1953
|
| Jun 19 | 59 | 60 in 1967 |
| Arizona Statewide Temperature Maps (Data courtesy of Western Region Climate Center) |
|---|
|
Arizona 2022 Average
Maximum Temperature
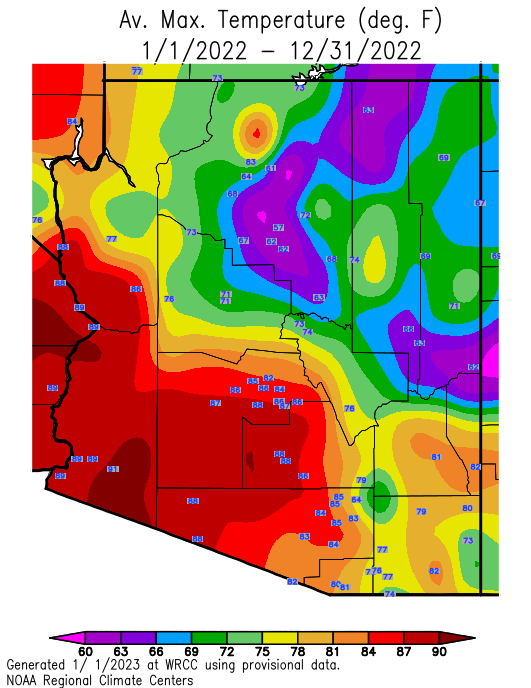 |
Arizona 2022 Maximum Temp Departure from normal
 |
|
Arizona 2022 Average
Minimum Temperature
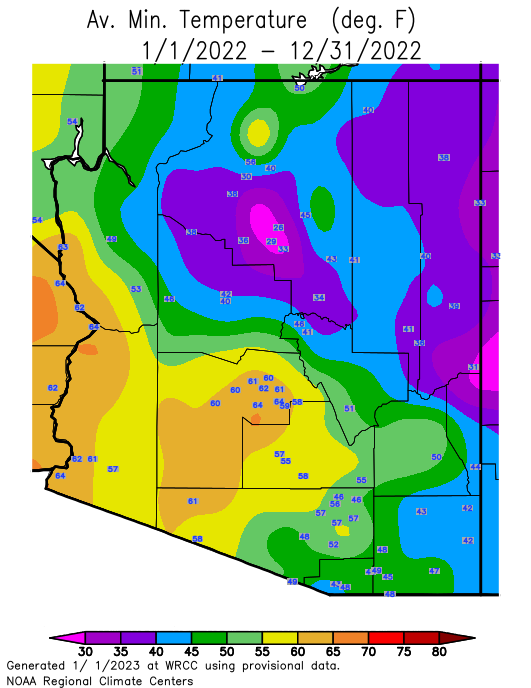 |
Arizona 2022 Minimum Temp
Departure from normal
 |
|
Arizona 2022 Average Temperature
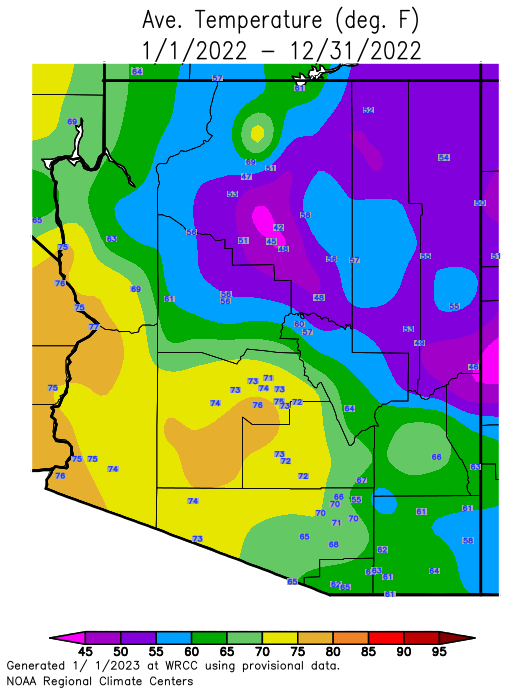 |
Arizona 2022 Average Temp
Departure from normal
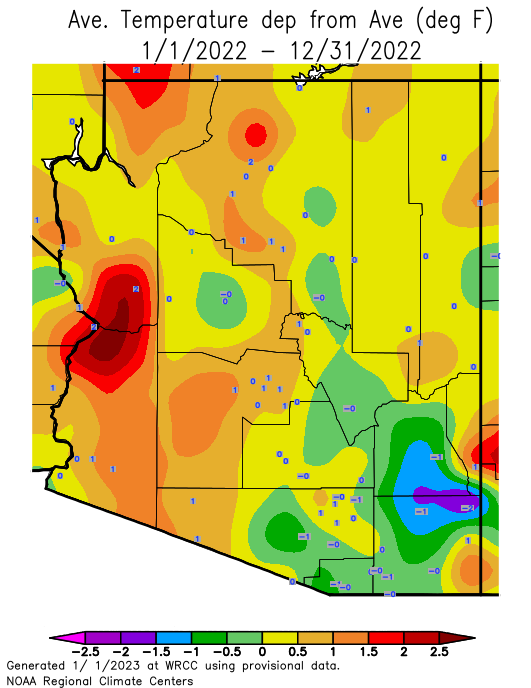 |
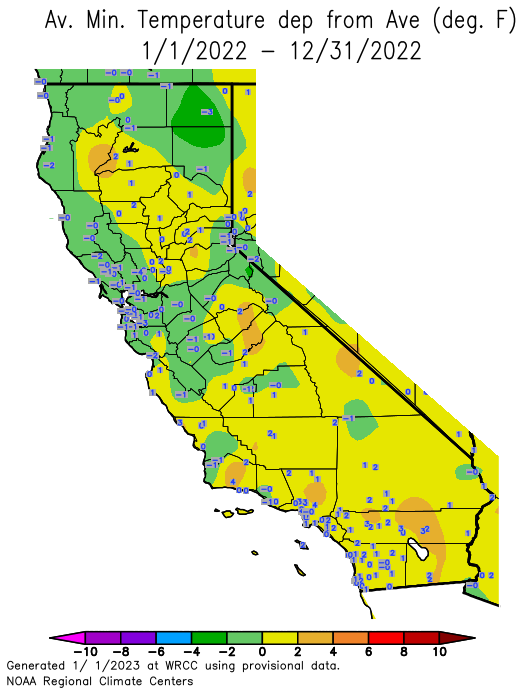
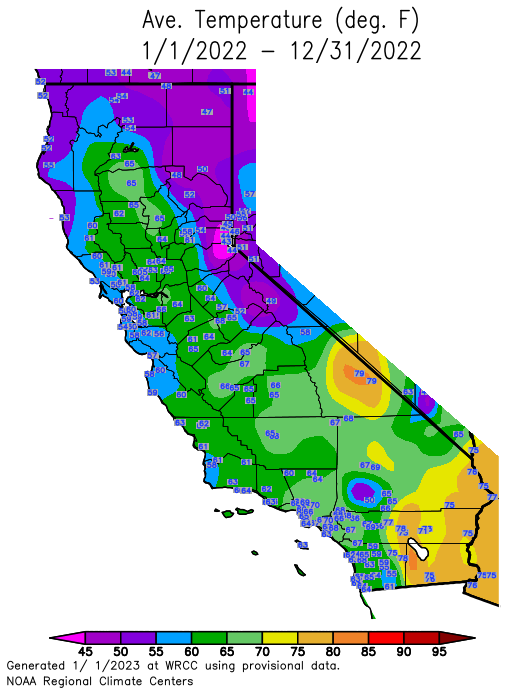
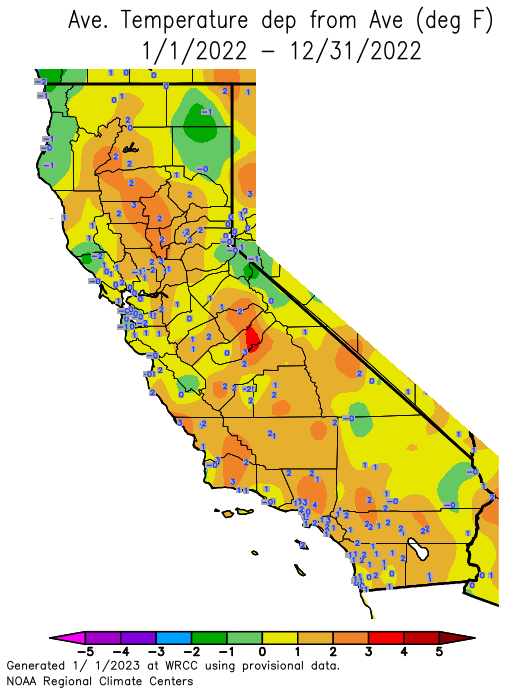
| California Statewide Temperature Maps (Data courtesy of Western Region Climate Center) |
|---|
|
California 2022 Average
Maximum Temperature
 |
California 2022 Maximum Temp Departure from normal
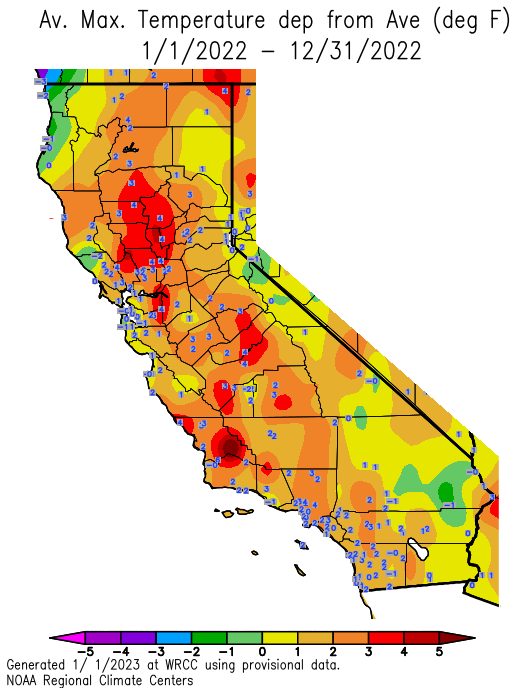 |
|
California 2022 Average
Minimum Temperature
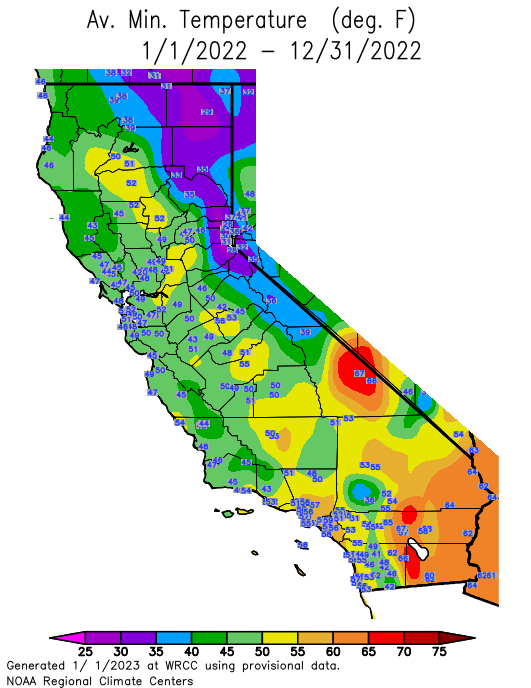 |
California 2022 Minimum Temp
Departure from normal
 |
|
California 2022 Average Temperature
 |
California 2022 Average Temp
Departure from normal
 |
| 2022 Phoenix Precipitation Statistics |
|---|
| Precip Total | Departure | Rank (1=Wettest, 127=Driest) | |
|---|---|---|---|
| Jan |
0.12
|
-0.75
|
98th
|
| Feb |
0.28
|
-0.59
|
79th
|
| Mar |
0.15
|
-0.68
|
96th
|
| Apr |
0.00
|
-0.22
|
127
|
| May |
0.00
|
-0.13
|
127th
|
| Jun |
0.32
|
+0.30
|
8th
|
| Jul |
0.21
|
-0.70
|
105th
|
| Aug |
0.91
|
-0.02
|
58th
|
| Sep |
0.79
|
+0.22
|
44th
|
| Oct |
0.95
|
+0.39
|
21st
|
| Nov |
0.04
|
-0.53
|
87th
|
| Dec |
2.01
|
+0.74
|
15th
|
(*** click on month for more comprehensive monthly summary ***)
| Phoenix Record Daily Rainfall for 2022 |
|---|
| Date | Record | Previous Record |
|---|---|---|
| Jun 26 |
0.18
|
0.07 in 1927
|
| Oct 16 | 0.32 - tied record | 0.32 in 1957 |
| Dec 4 | 0.76 | 0.69 in 1908 |
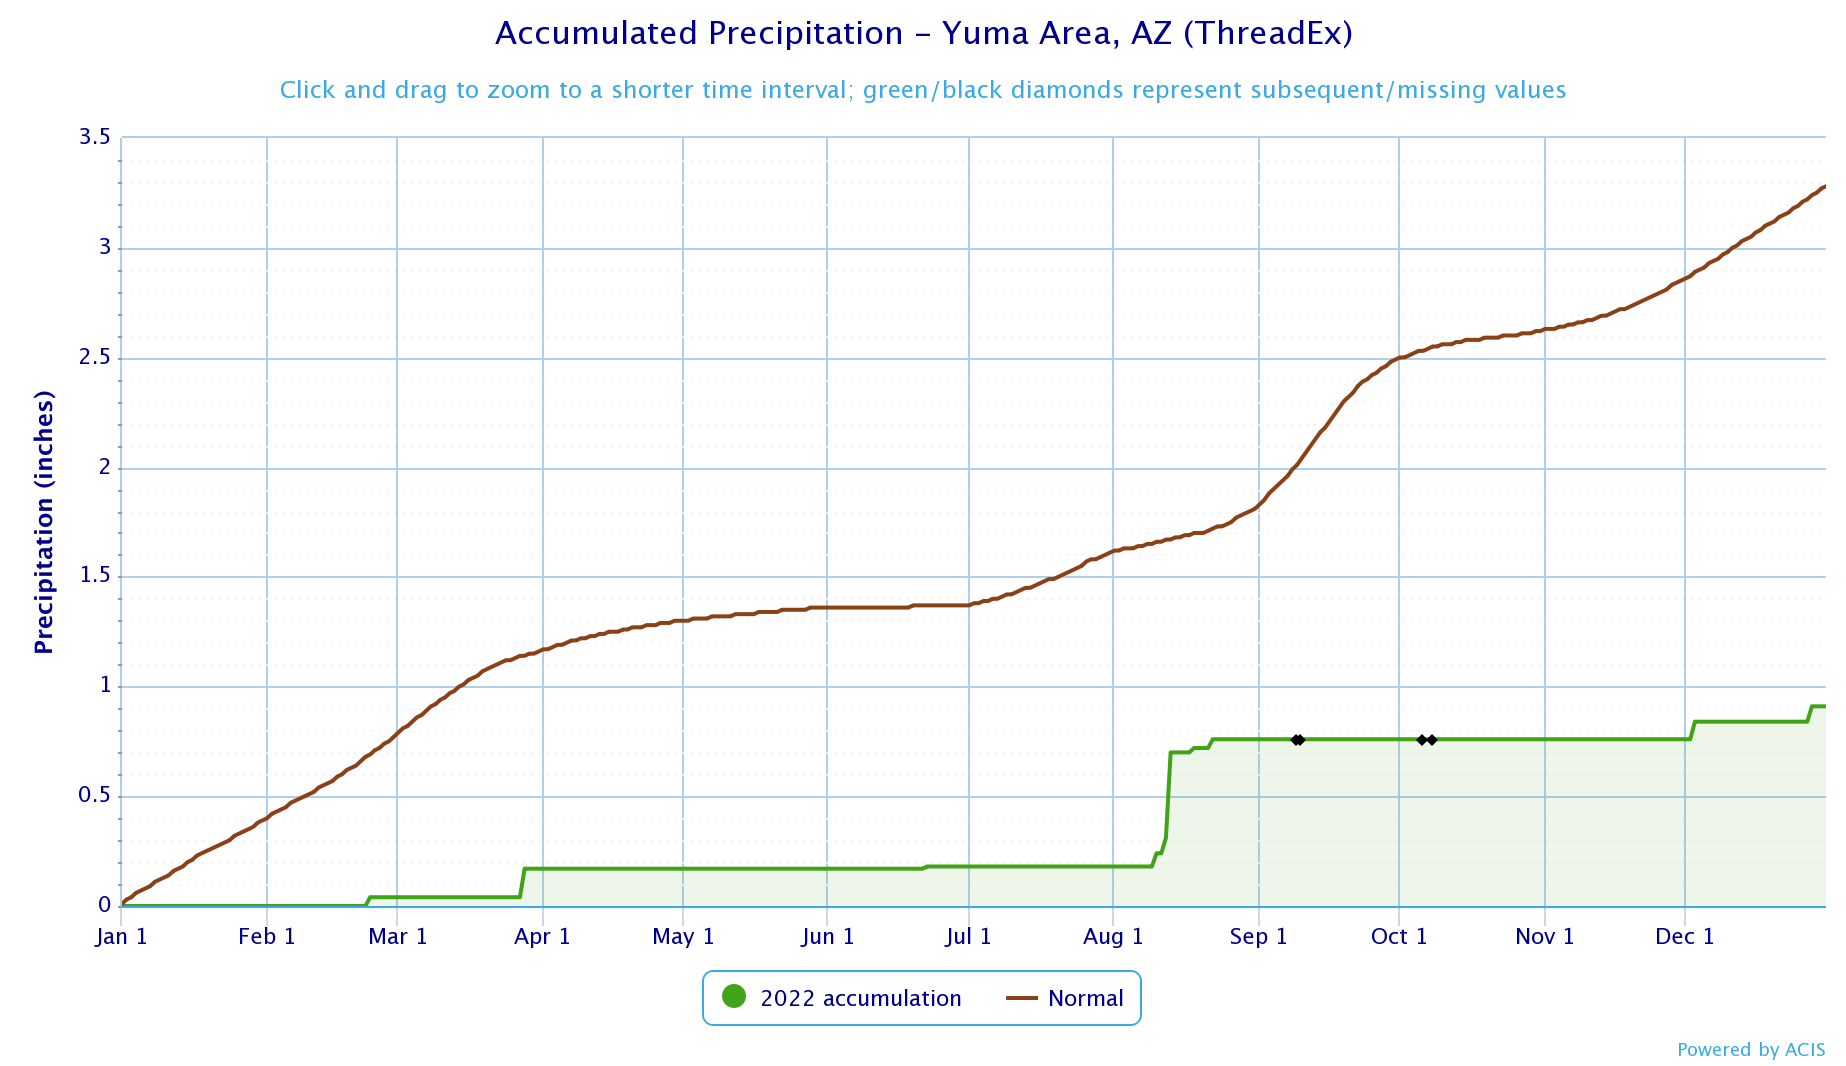
| 2022 Yuma Precipitation Statistics |
|---|
| Precip Total | Departure | Rank (1=Wettest, 146=Driest) | |
|---|---|---|---|
| Jan |
0.00
|
-0.39
|
146th
|
| Feb |
0.04
|
-0.34
|
87th
|
| Mar |
0.13
|
-0.26
|
74th
|
| Apr |
0.00
|
-0.14
|
146th
|
| May |
0.00
|
-0.06
|
146th
|
| Jun |
0.01
|
+0.00
|
16th
|
| Jul |
Trace
|
-0.24
|
146th
|
| Aug |
0.58
|
+0.38
|
35th
|
| Sep |
Missing |
Missing |
Missing |
| Oct |
Missing
|
Missing
|
Missing
|
| Nov |
0.00
|
-0.23
|
146th
|
| Dec |
0.15
|
-0.28
|
72nd
|
(*** click on month for more comprehensive monthly summary ***)
| Yuma Record Daily Rainfall for 2022 |
|---|
| Date | Record | Previous Record |
|---|---|---|
| Jun 21 |
Trace - tied record
|
Trace in 1988
|
| Jun 22 | 0.01 | Trace in 1931 |
| Aug 13 | 0.39 | 0.25 in 1893 |
| Arizona Statewide Precipitation Maps (Data courtesy of Western Region Climate Center) |
|---|
|
Arizona 2022
Precipitation
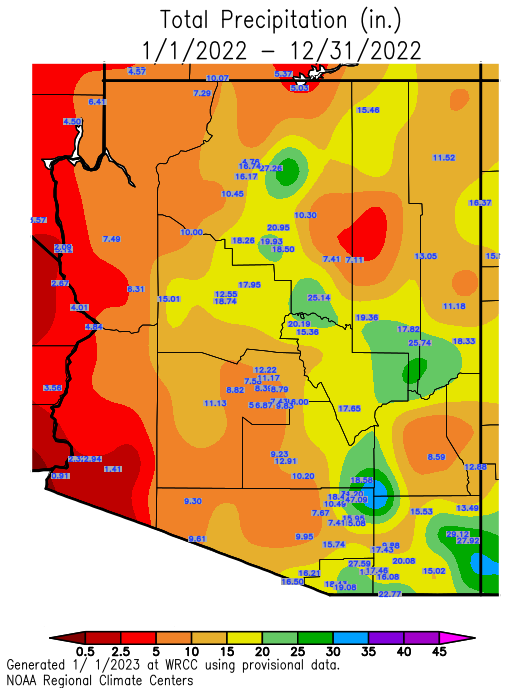 |
Arizona 2022 Precip Departure from normal
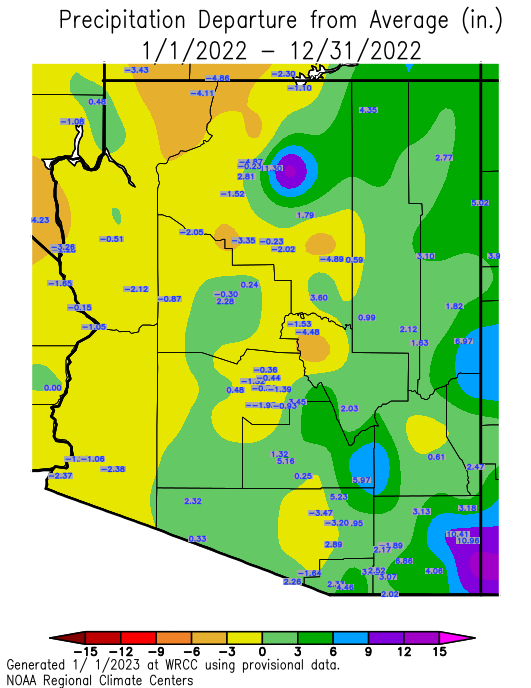 |
Arizona 2022 Precip Percent Normal
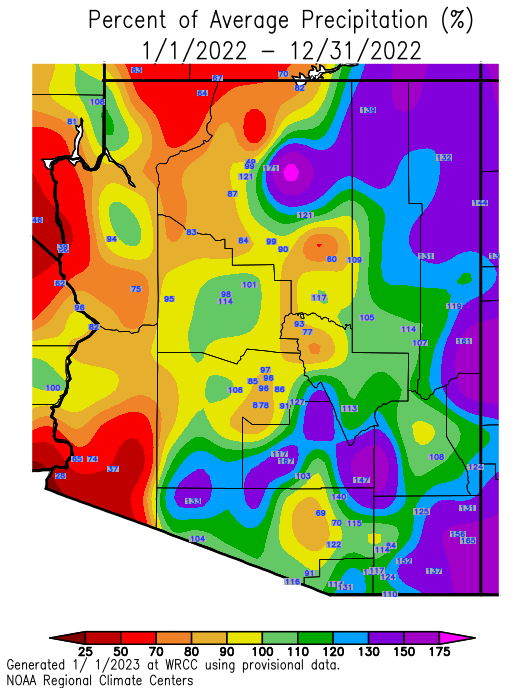 |
| California Statewide Precipitation Maps (Data courtesy of Western Region Climate Center) |
|---|
|
California 2022
Precipitation
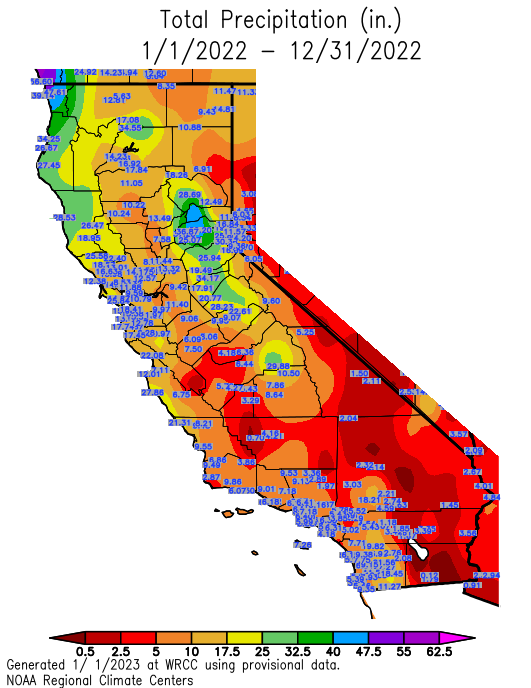 |
California 2022 Precip Departure from normal
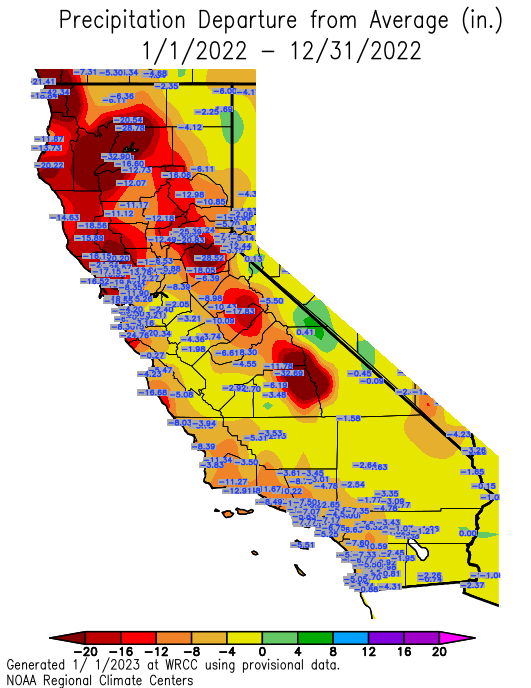 |
California 2022 Precip Percent Normal
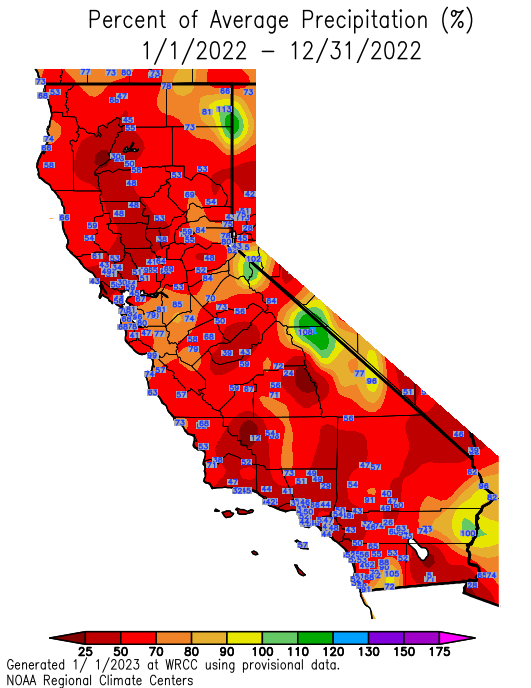 |
CLIMATE REPORT
NATIONAL WEATHER SERVICE PHOENIX AZ
735 AM MST WED JAN 04 2023
...................................
...THE PHOENIX AZ CLIMATE SUMMARY FOR THE YEAR OF 2022...
CLIMATE NORMAL PERIOD 1991 TO 2020
CLIMATE RECORD PERIOD 1895 TO 2023
WEATHER OBSERVED NORMAL DEPART LAST YEAR'S
VALUE DATE(S) VALUE FROM VALUE
NORMAL
..............................................................
TEMPERATURE (F)
RECORD
HIGH 122 06/26/1990
LOW 16 01/07/1913
HIGHEST 115 07/11 114 1
LOWEST 36 01/02 35 1
12/17
AVG. MAXIMUM 87.8 87.1 0.7
AVG. MINIMUM 64.3 64.1 0.2
MEAN 76.1 75.6 0.5
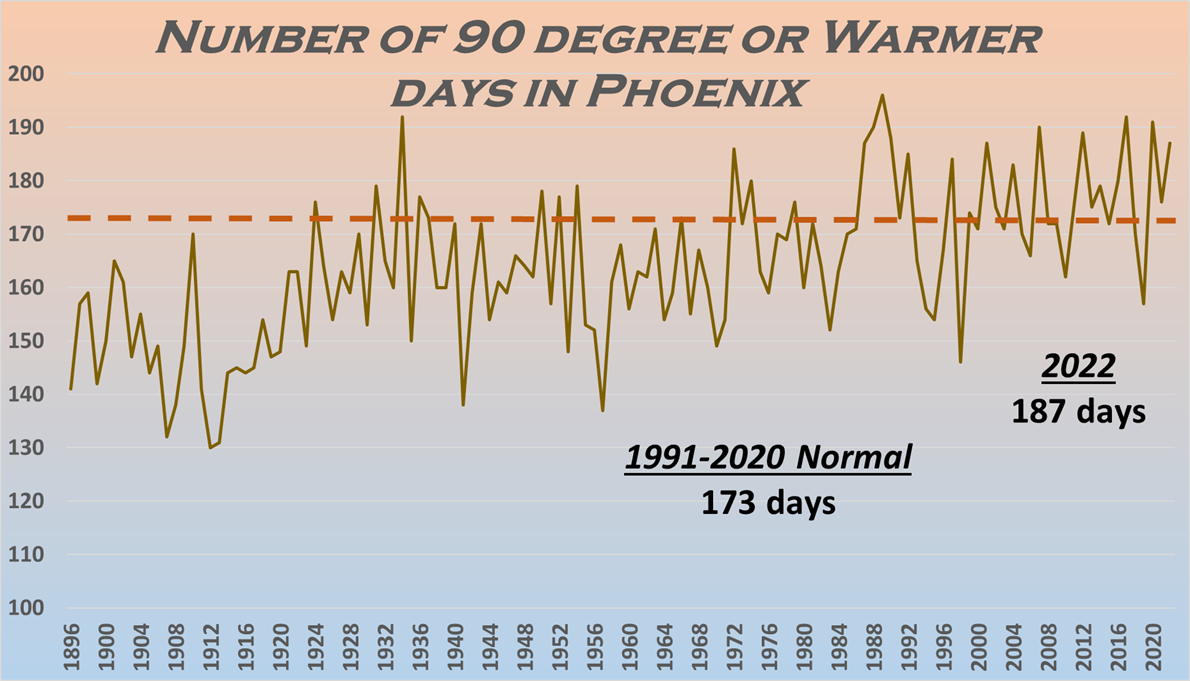
DAYS MAX >= 90 187 173.0 14.0
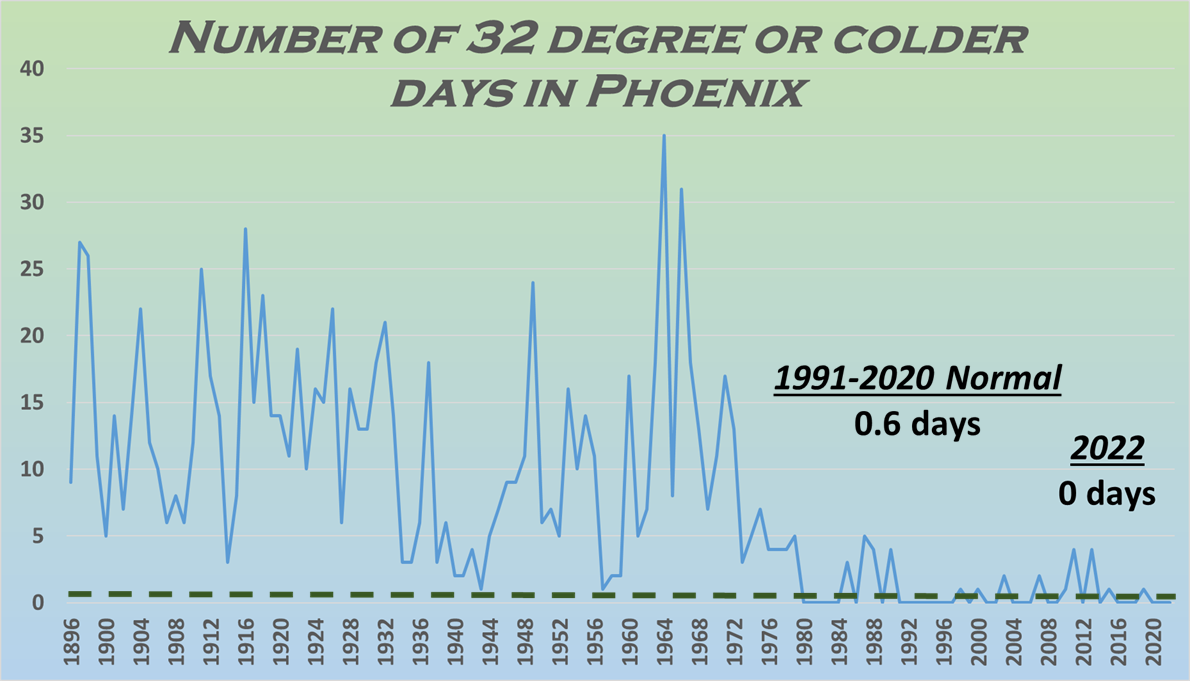
DAYS MAX <= 32 0 0.0 0.0
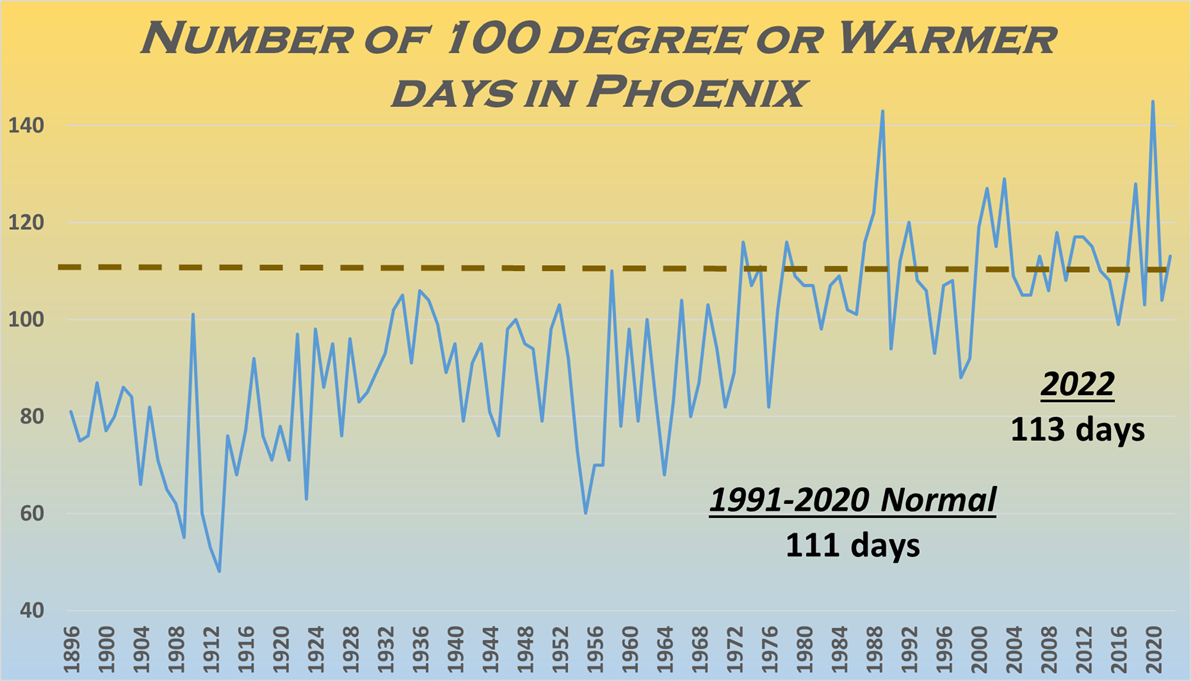
DAYS MAX >= 100 113
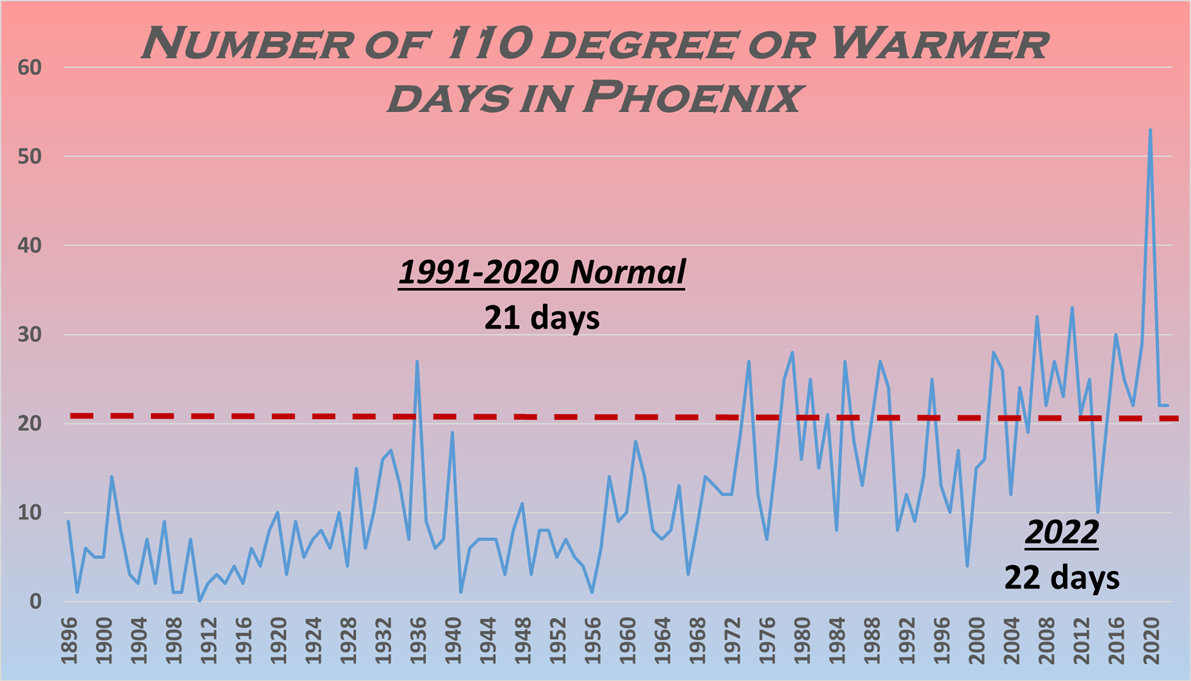
DAYS MAX >= 110 22
DAYS MIN <= 32 0 0.6 -0.6
DAYS MIN <= 0 0 0.0 0.0
DAYS MIN >= 90 11
PRECIPITATION (INCHES)
RECORD
MAXIMUM 19.73 1905
MINIMUM 2.82 2002
TOTALS 5.78 7.22 -1.44
DAYS >= .01 33 33.4 -0.4
DAYS >= .10 15 17.2 -2.2
DAYS >= .50 5 4.1 0.9
DAYS >= 1.00 0 0.9 -0.9
GREATEST
24 HR. TOTAL 1.17 12/03 TO 12/04
DEGREE DAYS
HEATING TOTAL 876 874 2
SINCE 7/1 439 378 61
COOLING TOTAL 5030 4765 265
SINCE 1/1 5030 4764 266
..............................................................
WIND (MPH)
AVERAGE WIND SPEED 6.6
HIGHEST GUST SPEED/DIRECTION 57/360 DATE 10/03
AVERAGE RH (PERCENT) 33
WEATHER CONDITIONS. NUMBER OF DAYS WITH
THUNDERSTORM 40 HEAVY RAIN 8
RAIN 11 LIGHT RAIN 45
FOG W/VIS <= 1/4 MILE 1
- INDICATES NEGATIVE NUMBERS.
R INDICATES RECORD WAS SET OR TIED.
MM INDICATES DATA IS MISSING.
T INDICATES TRACE AMOUNT.
CLIMATE REPORT
NATIONAL WEATHER SERVICE PHOENIX AZ
735 AM MST WED JAN 04 2023
...................................
...THE YUMA AZ CLIMATE SUMMARY FOR THE YEAR OF 2022...
CLIMATE NORMAL PERIOD 1991 TO 2020
CLIMATE RECORD PERIOD 1876 TO 2023
WEATHER OBSERVED NORMAL DEPART LAST YEAR'S
VALUE DATE(S) VALUE FROM VALUE
NORMAL
..............................................................
TEMPERATURE (F)
RECORD
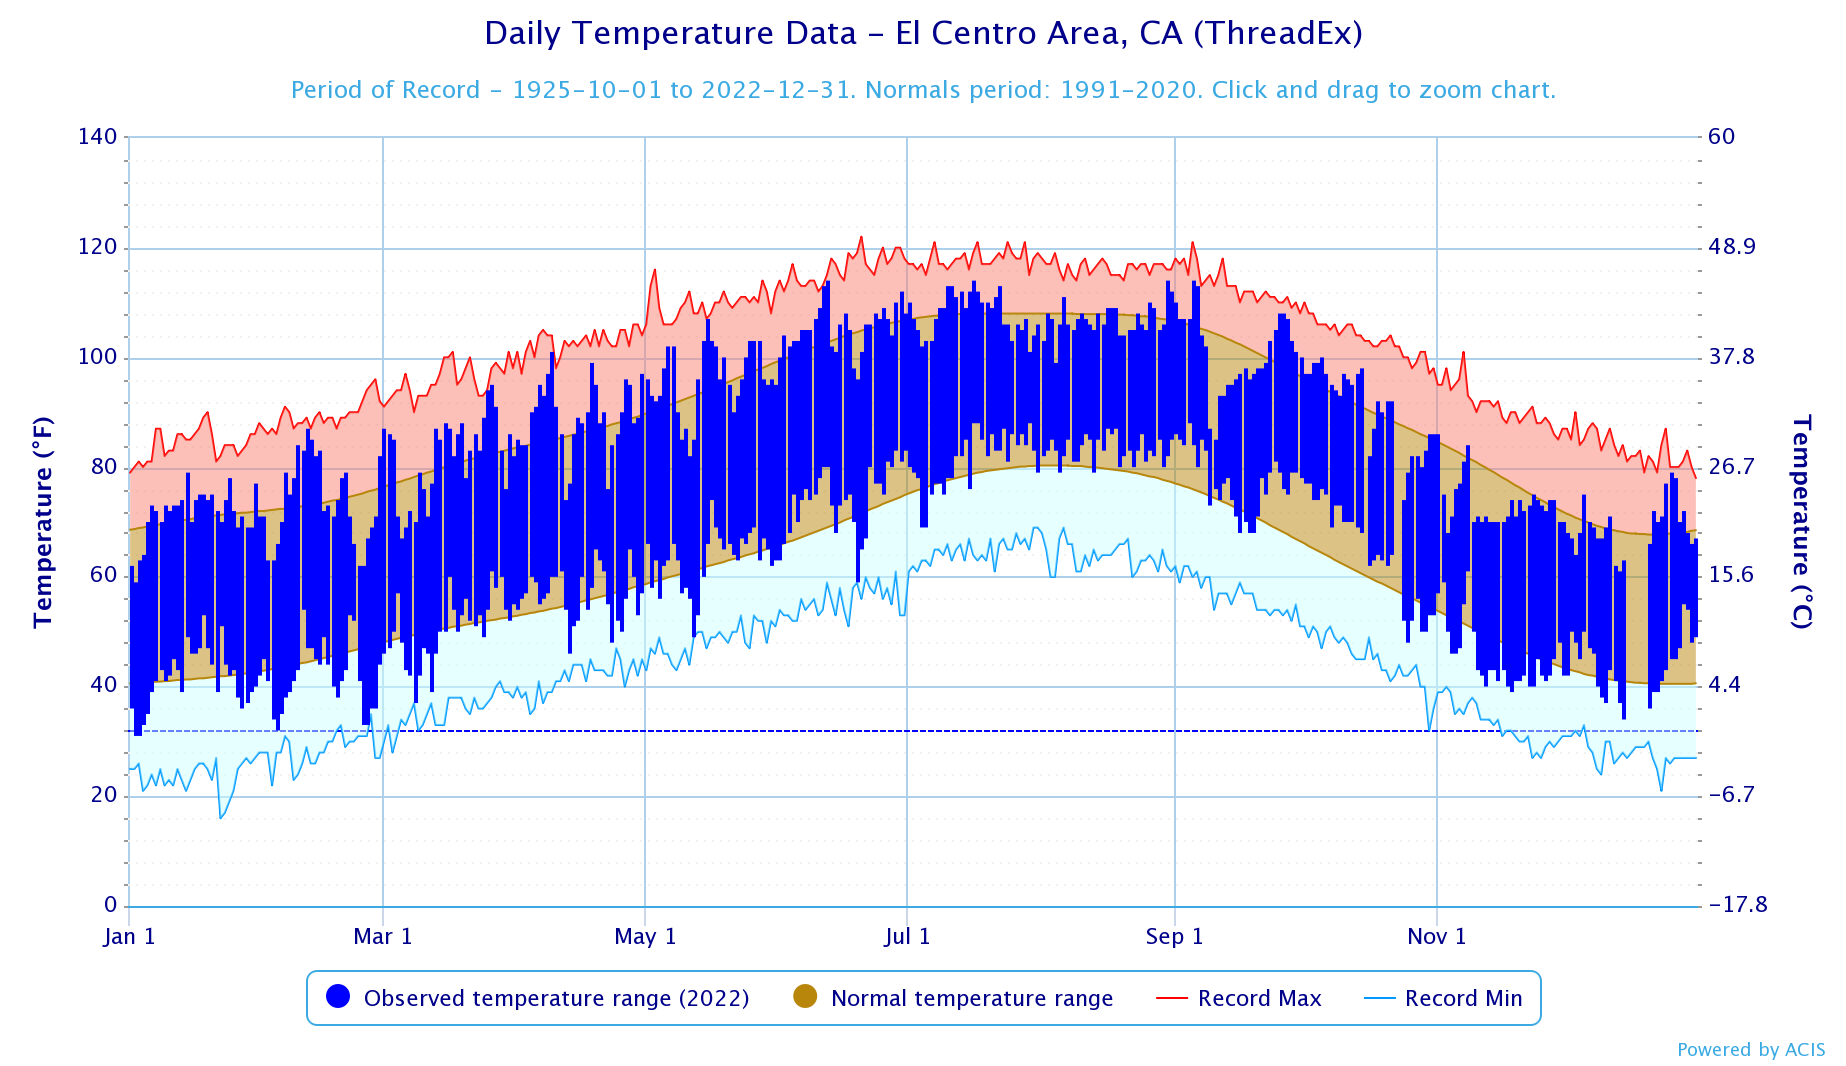
HIGH 124 07/28/1995
LOW 22 01/24/1937
12/26/1911
01/20/1883
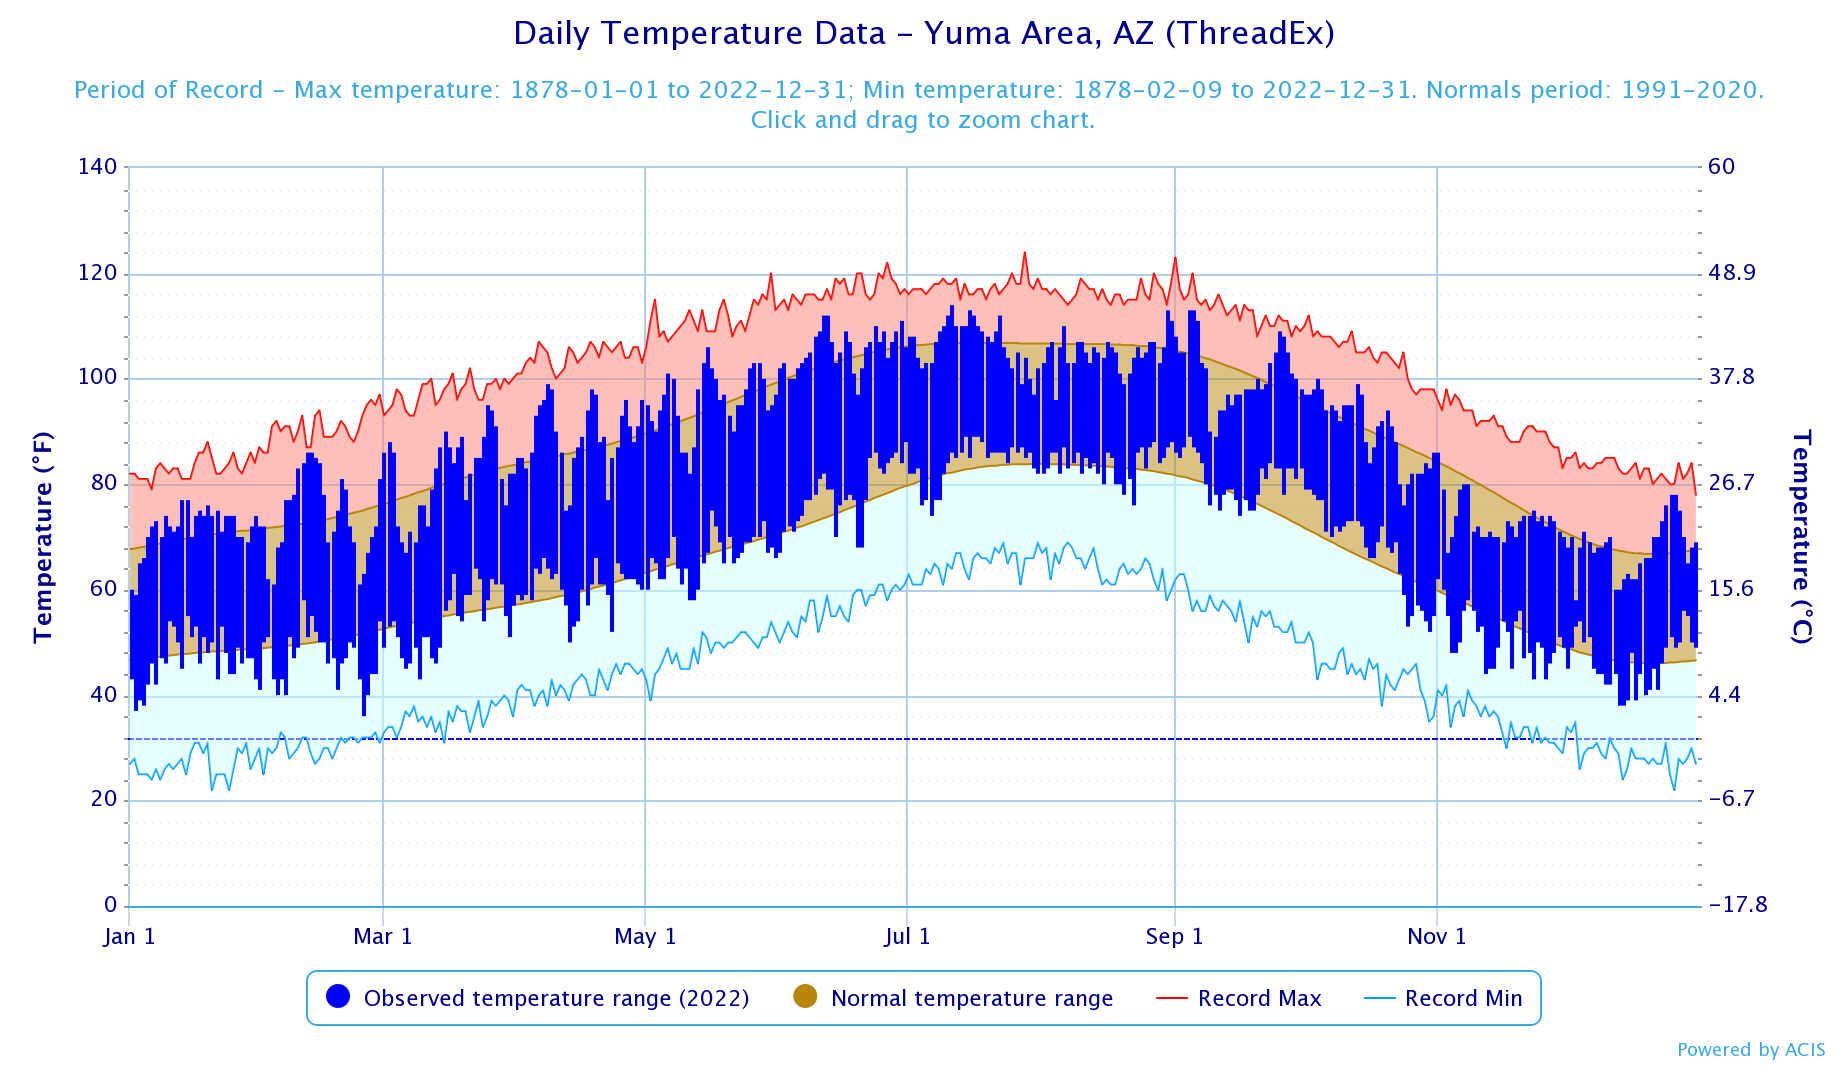
HIGHEST 114 07/11 115 -1
LOWEST 36 02/24 36 0
AVG. MAXIMUM 88.5 88.1 0.4
AVG. MINIMUM 63.7 63.8 -0.1
MEAN 76.1 75.9 0.2
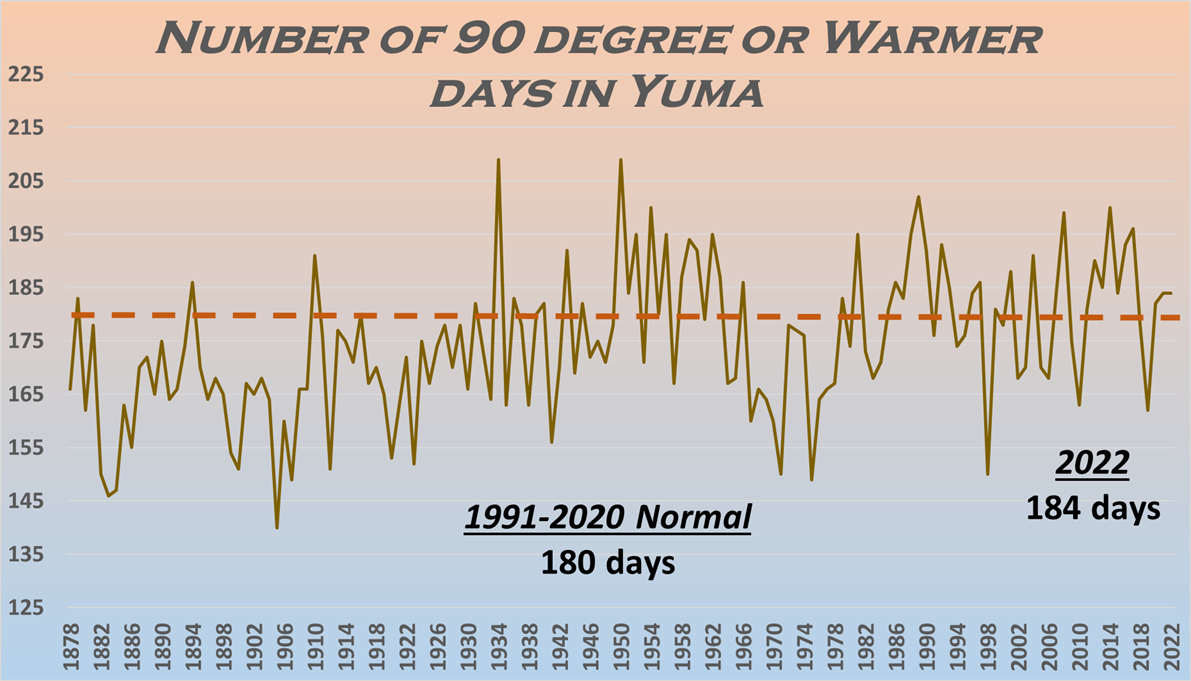
DAYS MAX >= 90 184 181.0 3.0
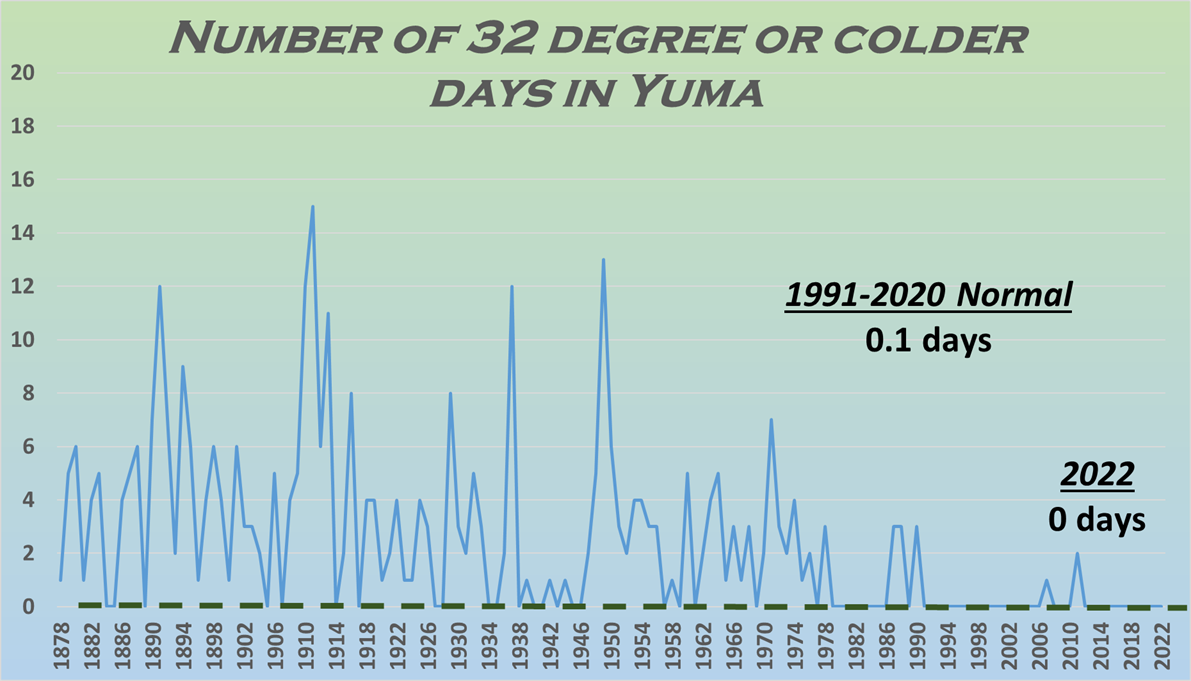
DAYS MAX <= 32 0 0.0 0.0
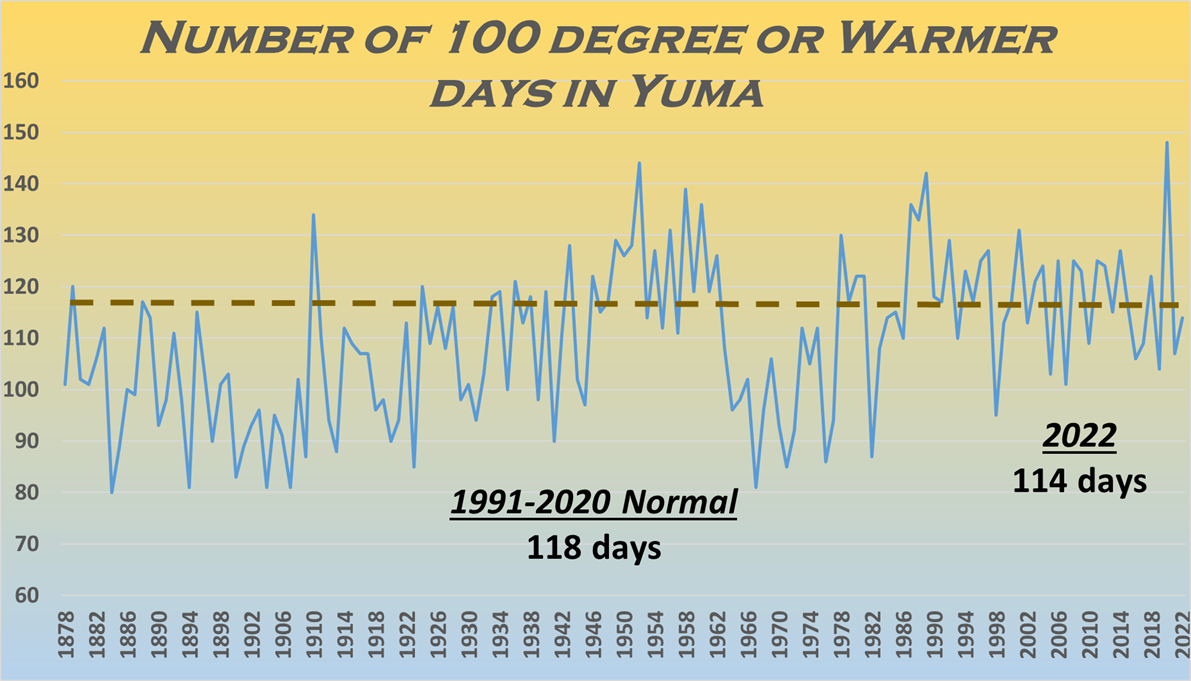
DAYS MAX >= 100 114
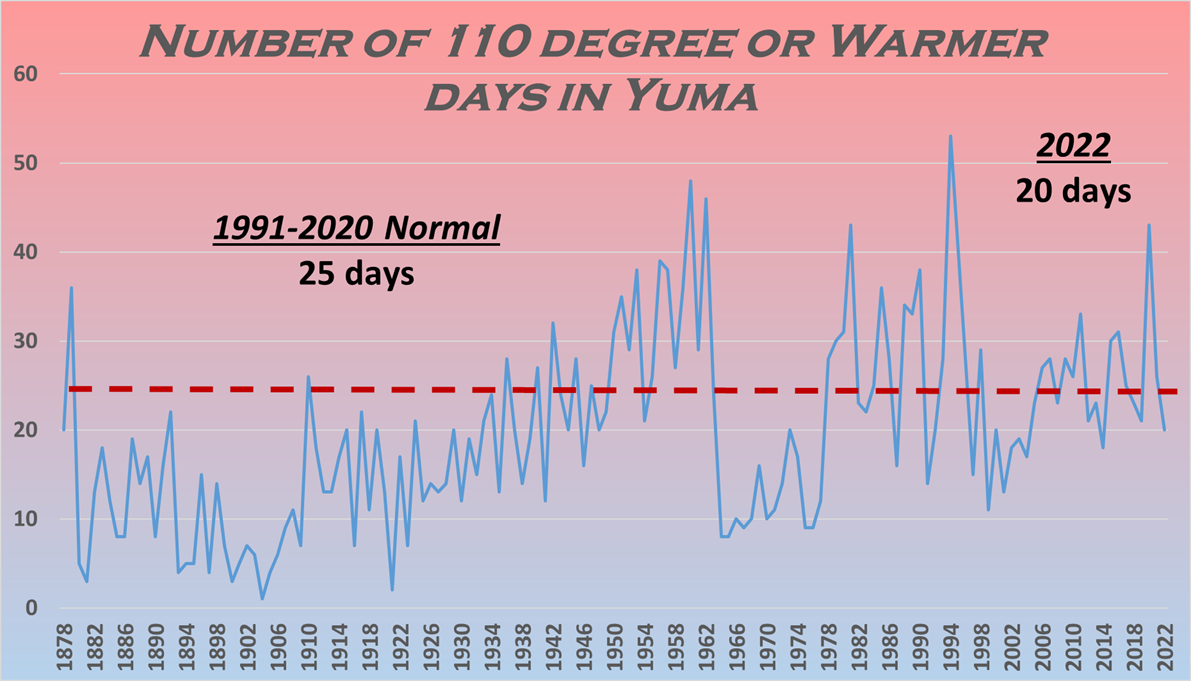
DAYS MAX >= 110 20
DAYS MIN <= 32 0 0.1 -0.1
DAYS MIN <= 0 0 0.0 0.0
DAYS MIN >= 90 0
PRECIPITATION (INCHES)
RECORD
MAXIMUM 11.41 1905
MINIMUM 0.03 2002
TOTALS MM 3.28 MM
DAYS >= .01 MM 16.6 MM
DAYS >= .10 MM 7.9 MM
DAYS >= .50 MM 1.4 MM
DAYS >= 1.00 MM 0.4 MM
GREATEST
24 HR. TOTAL 0.39 08/13 TO 08/13
DEGREE DAYS
HEATING TOTAL 715 679 36
SINCE 7/1 347 306 41
COOLING TOTAL 4885 4705 180
SINCE 1/1 4885 4704 181
..............................................................
WIND (MPH)
AVERAGE WIND SPEED 7.5
HIGHEST GUST SPEED/DIRECTION 68/030 DATE 08/10
AVERAGE RH (PERCENT) 36
WEATHER CONDITIONS. NUMBER OF DAYS WITH
THUNDERSTORM 28 HEAVY RAIN 1
RAIN 7 LIGHT RAIN 19
FOG W/VIS <= 1/4 MILE 2
- INDICATES NEGATIVE NUMBERS.
R INDICATES RECORD WAS SET OR TIED.
MM INDICATES DATA IS MISSING.
T INDICATES TRACE AMOUNT.
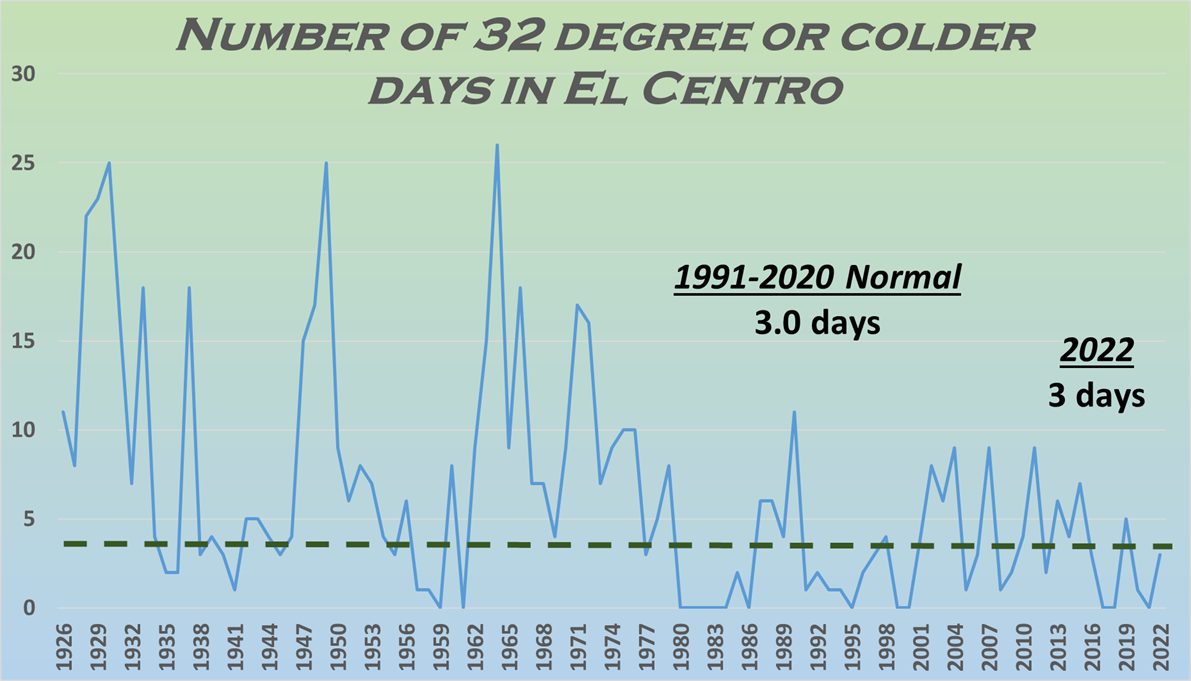
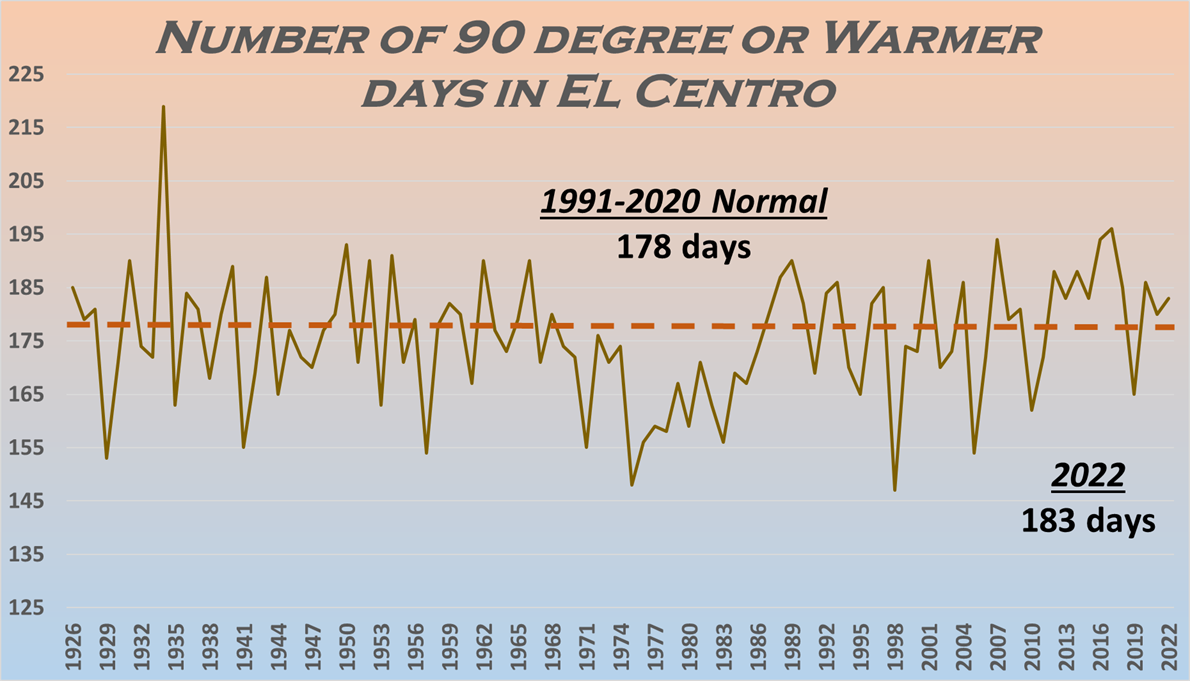
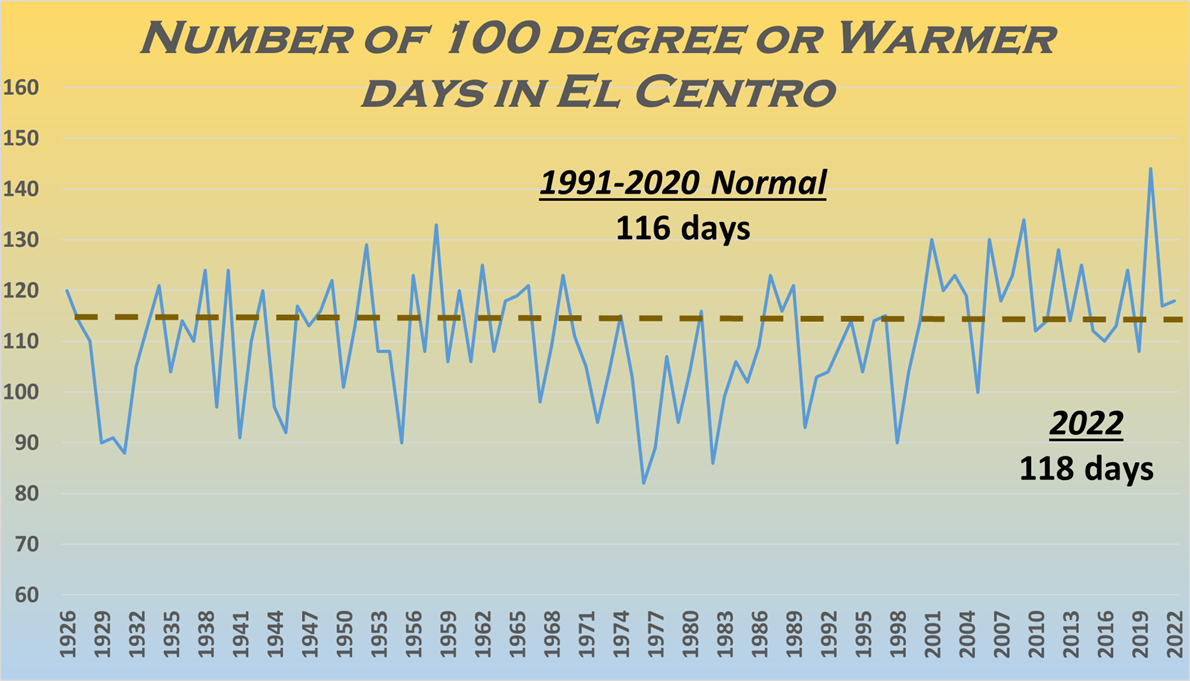
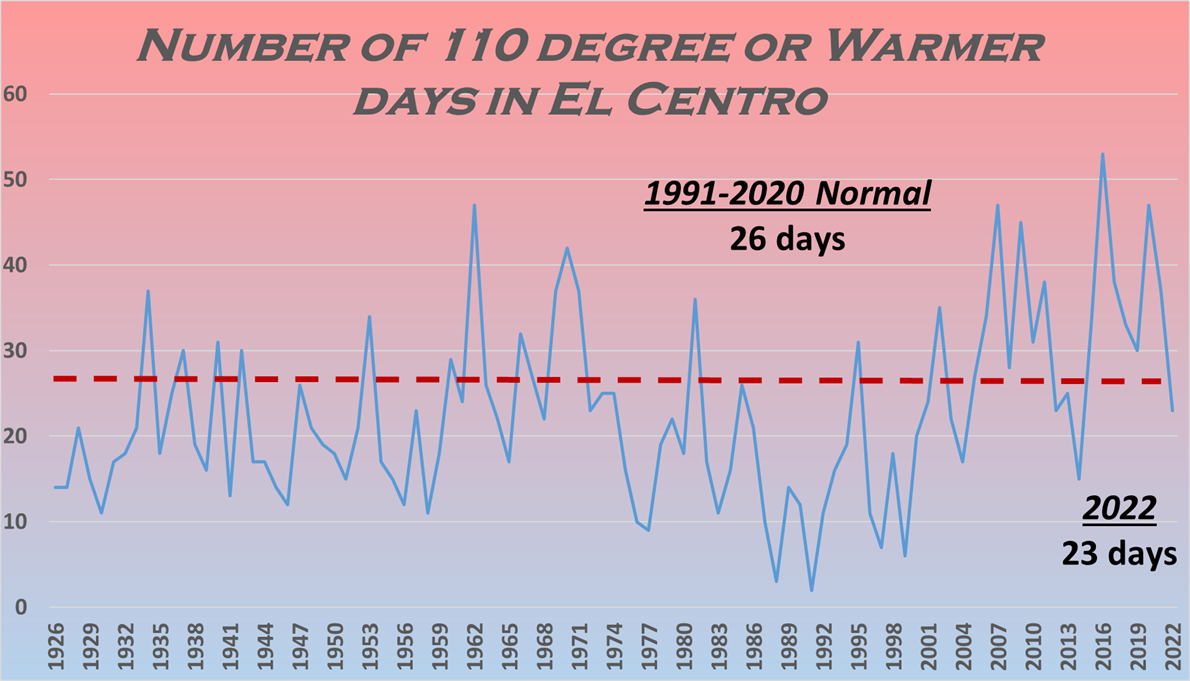
CLIMATE REPORT
NATIONAL WEATHER SERVICE PHOENIX AZ
735 AM MST WED JAN 04 2023

...................................

...THE IMPERIAL CA CLIMATE SUMMARY FOR THE YEAR OF 2022...

CLIMATE NORMAL PERIOD 1991 TO 2020
CLIMATE RECORD PERIOD 1925 TO 2023

WEATHER         OBSERVED          NORMAL  DEPART   LAST YEAR'S
                VALUE   DATE(S)   VALUE   FROM     VALUE
                                          NORMAL
..............................................................
TEMPERATURE (F)
RECORD
 HIGH            122   06/20/2017
 LOW              16   01/22/1937
HIGHEST          114   07/16        116      -2
                       08/30
                       09/05
LOWEST            31   01/02         31       0
                       01/03
AVG. MAXIMUM      MM               88.6      MM
AVG. MINIMUM      MM               58.7      MM
MEAN              MM               73.7      MM
DAYS MAX >= 90   183              181.0     2.0
DAYS MAX <= 32     0                0.0     0.0
DAYS MAX >= 100  118
DAYS MAX >= 110   23
DAYS MIN <= 32     3                4.1    -1.1
DAYS MIN <= 0      0                0.0     0.0
DAYS MIN >= 90     0


DEGREE DAYS
HEATING TOTAL    927                966     -39
 SINCE 7/1       404                430     -26
COOLING TOTAL   4533               4162     371
 SINCE 1/1      4533               4162     371
..............................................................

WIND (MPH)
AVERAGE WIND SPEED              7.0
HIGHEST GUST SPEED/DIRECTION    63/250    DATE  04/21

AVERAGE RH (PERCENT)     38

WEATHER CONDITIONS. NUMBER OF DAYS WITH
THUNDERSTORM              7     HEAVY RAIN                 2
RAIN                      3     LIGHT RAIN                13
FOG W/VIS <= 1/4 MILE     2

-  INDICATES NEGATIVE NUMBERS.
R  INDICATES RECORD WAS SET OR TIED.
MM INDICATES DATA IS MISSING.
T  INDICATES TRACE AMOUNT.

