Welcome to the National Weather Service Pueblo Severe Weather climatology page. This page shows numerous severe convective weather statistics in graphical format for the National Weather Service (NWS), Pueblo (PUB) County Warning Area (CWA). The NWS Pueblo CWA consists of southeast and south central Colorado. Data for the charts and figures in this document were created from information from the Storm Events Database by the National Centers for Environmental Information). Only data from 1995 to 2025 are shown (NWS Pueblo became a forecast and warning office in 1995). This page is updated yearly, typically during the late winter months.
A "Severe Convective Weather Event" is defined as:
Hail = 1 inch in diameter or LARGER, and/or;
Wind Damage or Wind Speeds of 50 knots (58 mph) or STRONGER, and/or;
a Tornado.
Please note the following regarding severe hail:
The size of the largest hailstone determines if the storm is considered severe or not. The depth of the hail on the ground does not determine hail storm severity.
Example: You can have 4 inches of pea size (1/4") hail covering the ground, and this storm would not be considered severe. On the other hand, you can have 1 hailstone fall out of the sky that measures 4 inches in diameter and this storm would be considered severe.
Lightning is not considered severe weather. If you wish to find out more about lightning in Colorado, please visit the NWS Pueblo Colorado Lightning Resource Page.
_______________________________________________________________
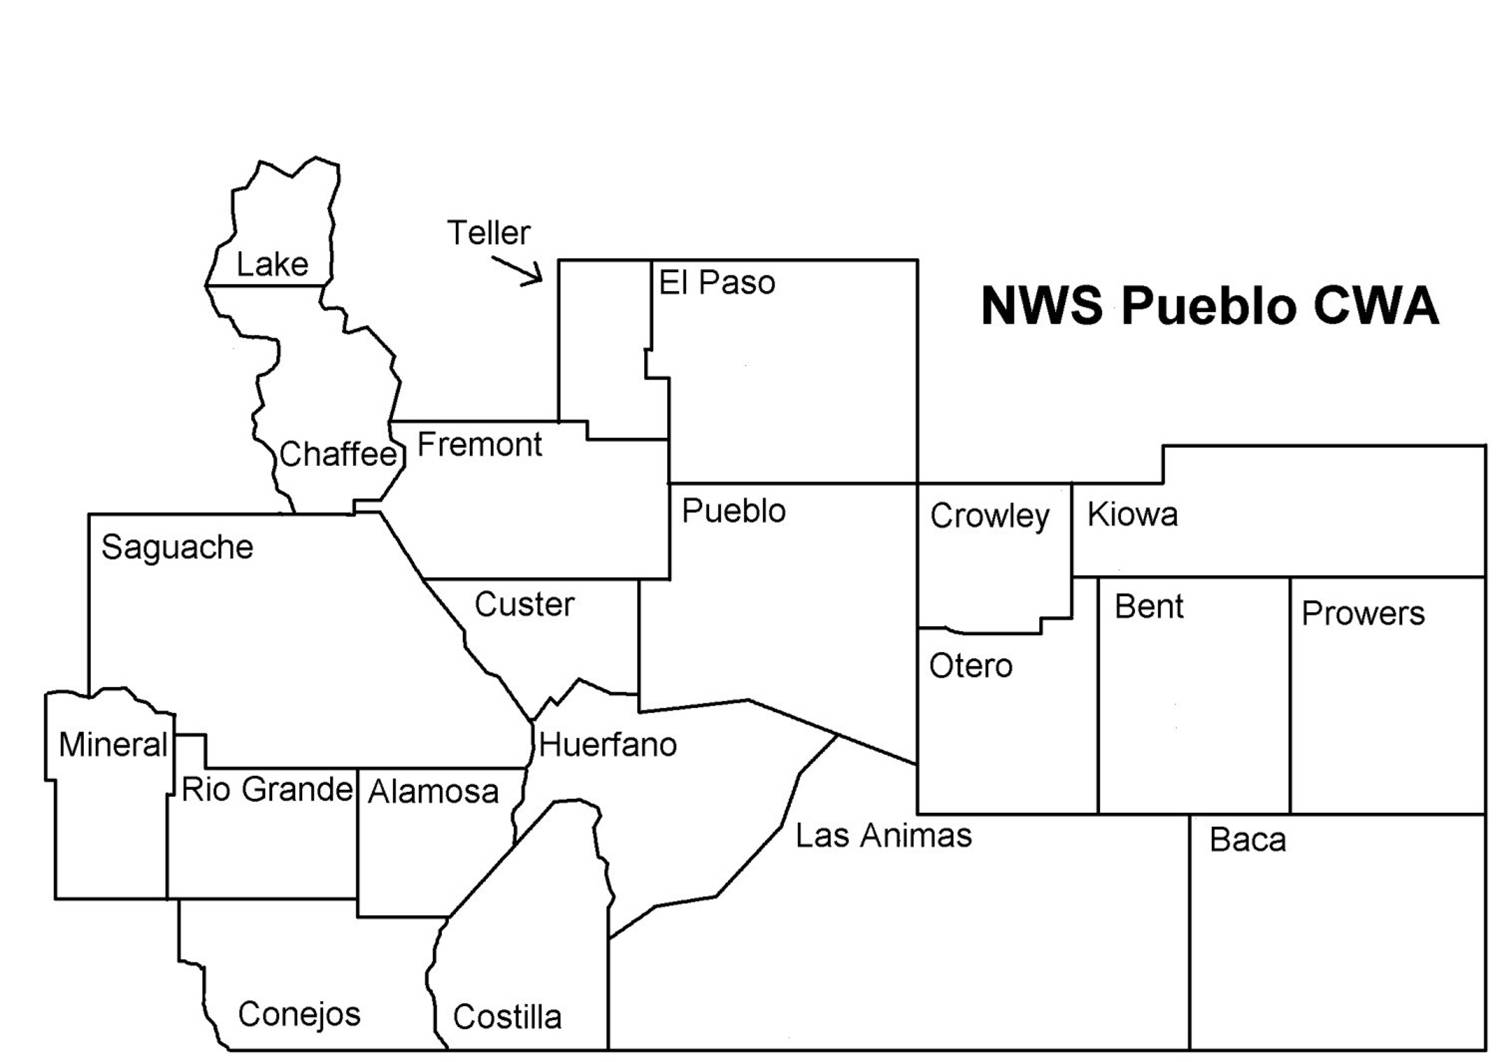
The map above shows the counties in the NWS Pueblo County Warning Area (CWA). Severe weather statistics in this web document are only for the counties shown in the above image.
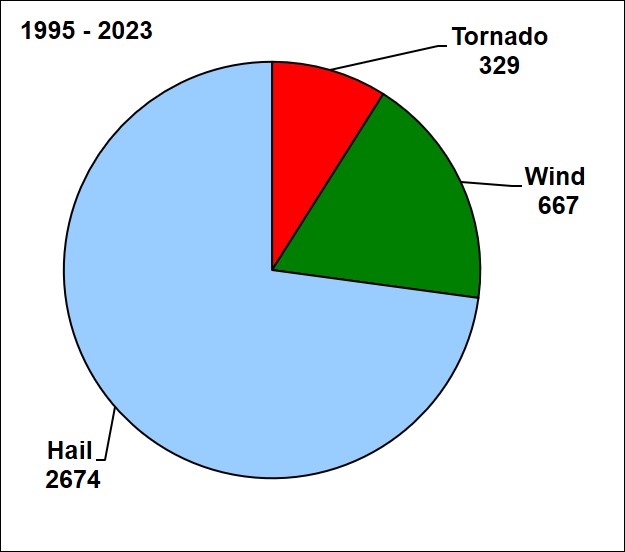
Pie chart showing the distribution of the 3 types of severe weather events within NWS Pueblo CWA.
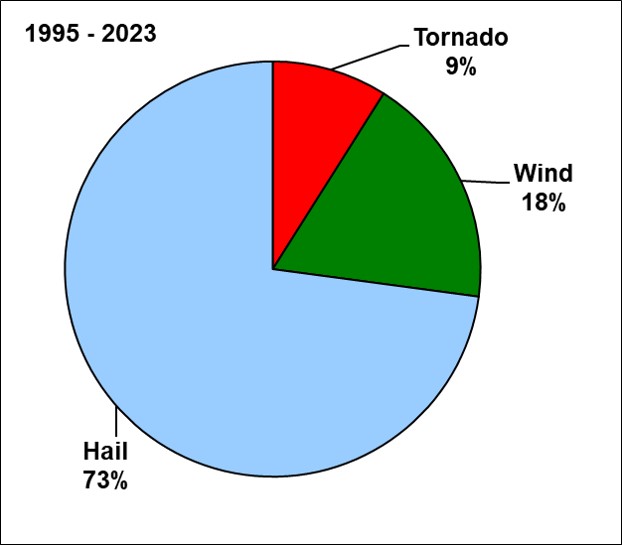
Pie chart showing the distribution (in percent) of the 3 types of severe weather within NWS Pueblo CWA.
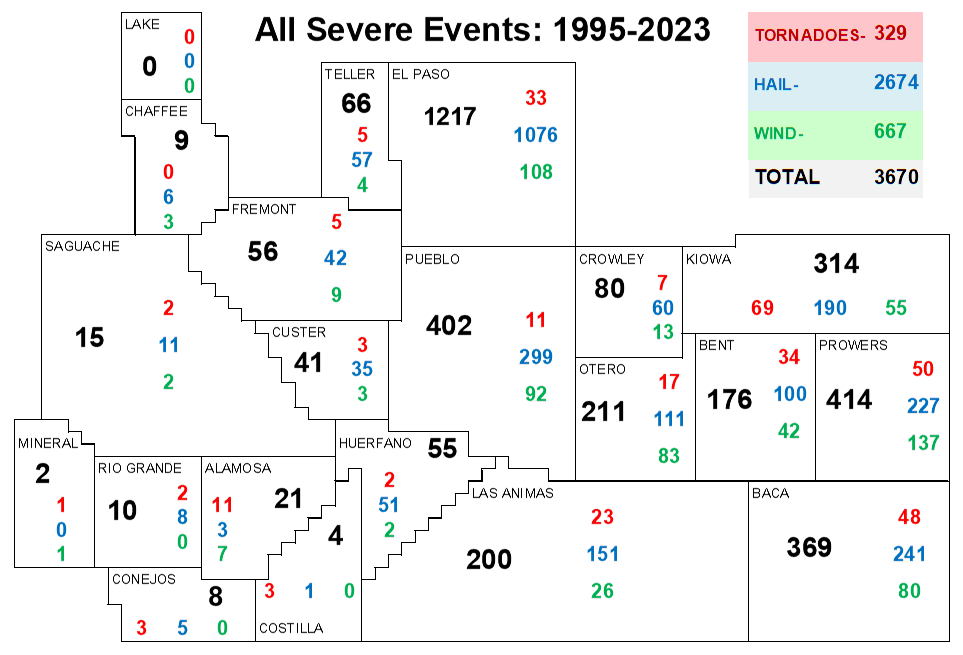
Map of NWS Pueblo county warning area showing the distribution of the 3 types of severe convective weather (hail, tornado and wind) in each county.

Map of NWS Pueblo county warning area showing the severe hail size distribution for each county in southeast and south central Colorado.
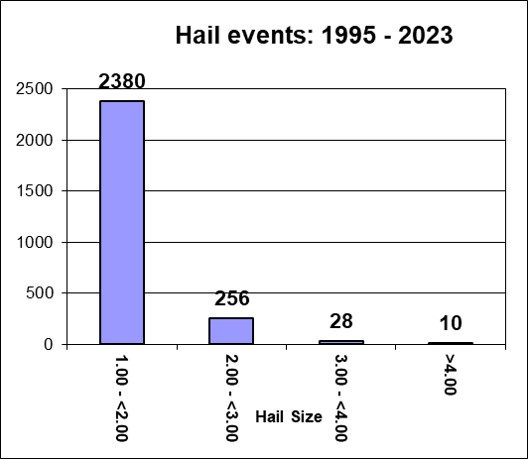
Bar chart showing the distribution of severe hail sizes across the NWS Pueblo CWA.
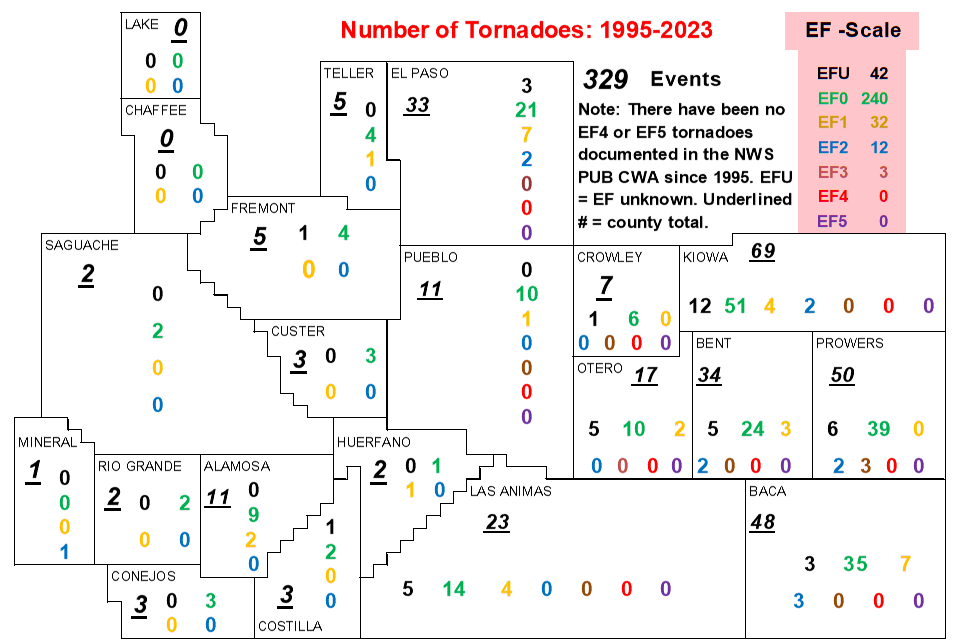
Map showing the tornado distribution for the NWS Pueblo CWA. NOTE: EFU = "EF Unknown"; i.e, the tornado did not hit any Damage Indicators (DI's) and could not be rated.
.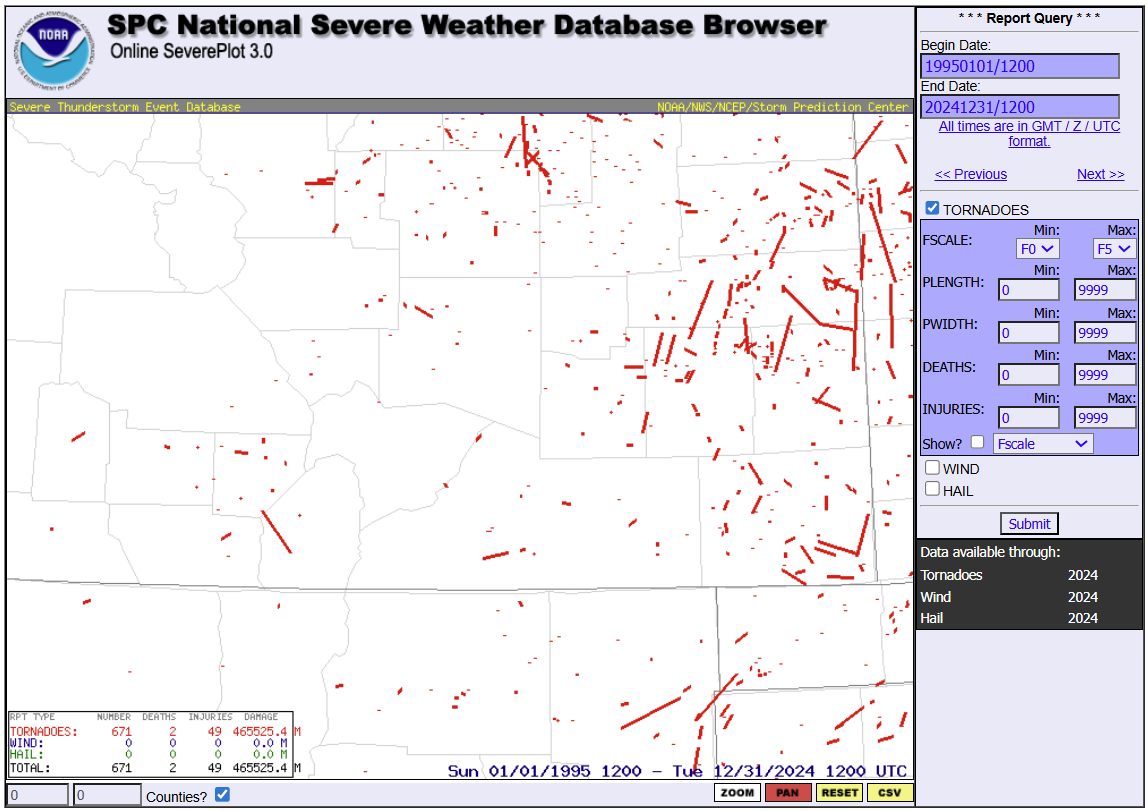
Map showing tornado tracks across the greater Southeast and South Central Colorado region between 1995 and 2024 inclusive (latest available at the time of this webpage being published). If you wish to plot your own tornado tracks (or any other severe weather data), please visit this webpage.
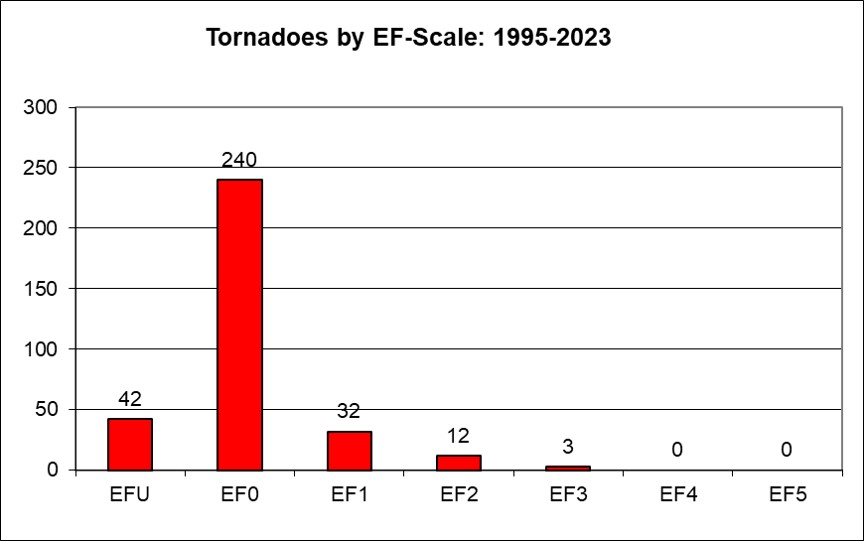
Bar chart showing the distribution of tornadoes by EF Scale across the NWS Pueblo CWA. NOTE: EFU = "EF Unknown"; i.e, the tornado did not hit any Damage Indicators (DI's), and could not be rated.
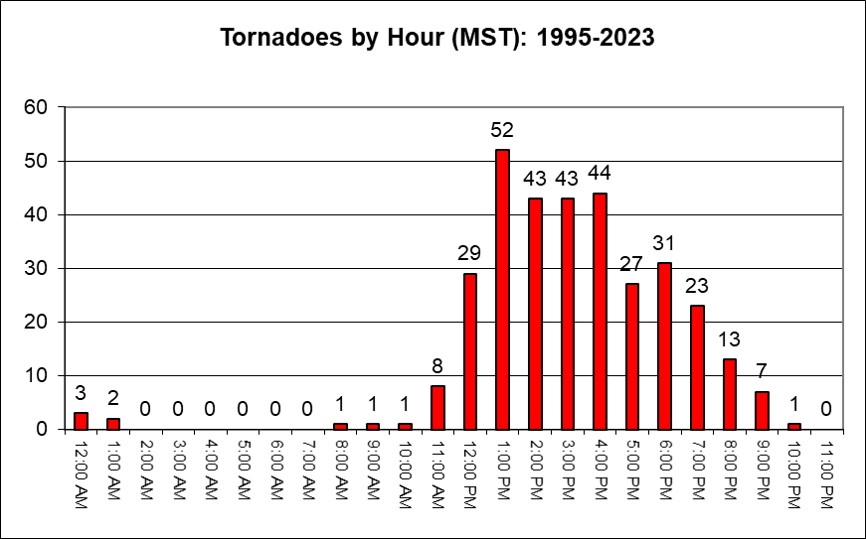
Bar chart showing tornadoes by hour across the NWS Pueblo CWA. Time is MST .
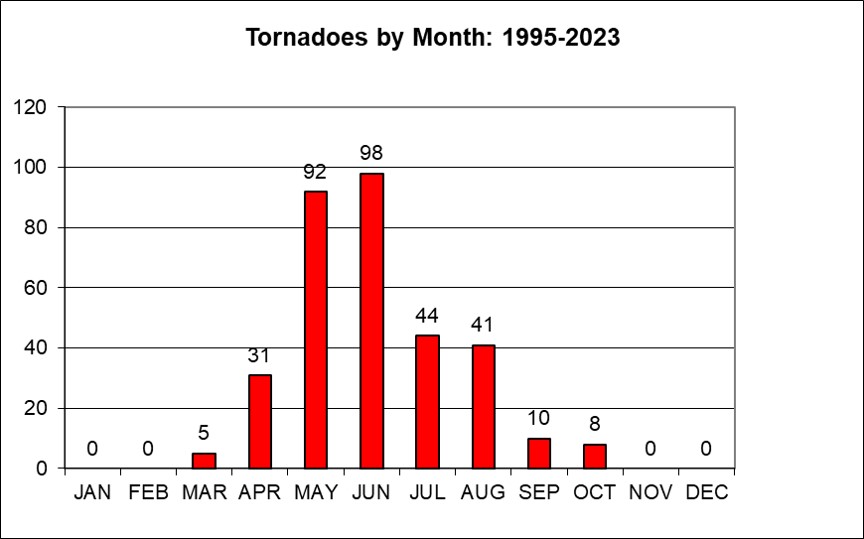
Bar chart showing tornadoes by month across the NWS Pueblo CWA.

Bar chart showing tornadoes by year across the NWS Pueblo CWA.
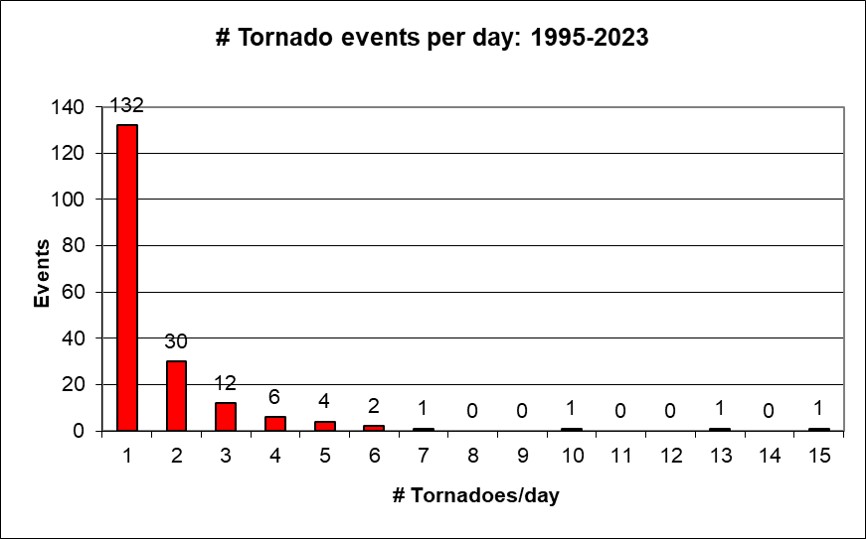
Bar graph showing tornado events per calendar day for the NWS Pueblo CWA from 1995 to 2023. As an example, there have been 137 days in which only one tornado report was received for that day; there have been 31 days in which 2 tornado reports have been received for that day, etc.
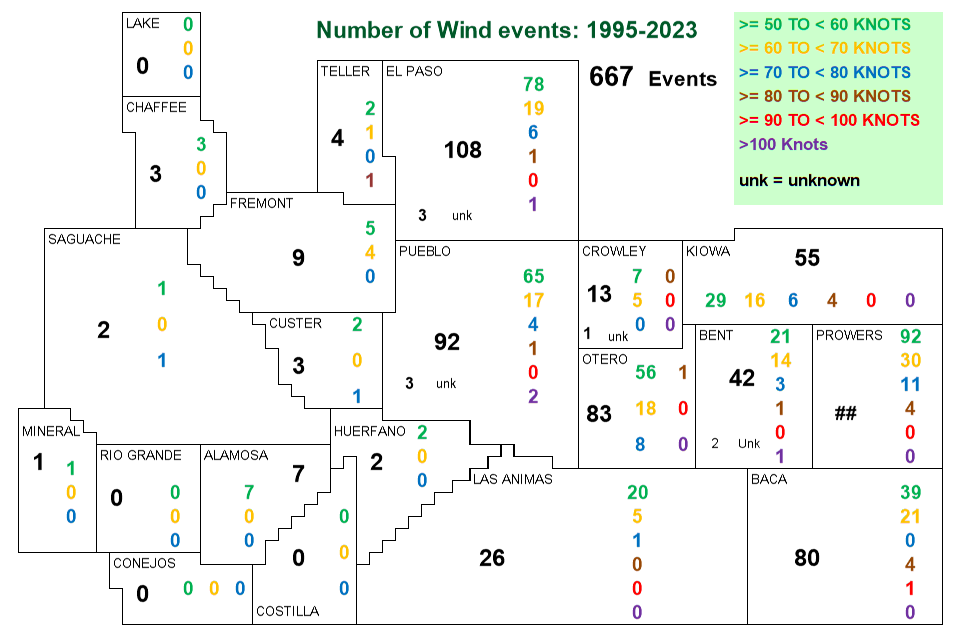
Map of NWS Pueblo county warning area showing severe convective wind distribution for each county.
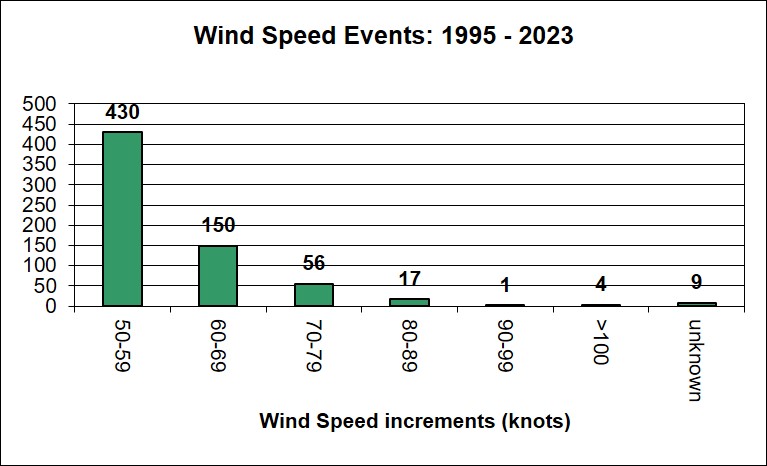
Bar chart showing distribution of severe wind reports across NWS Pueblo CWA.
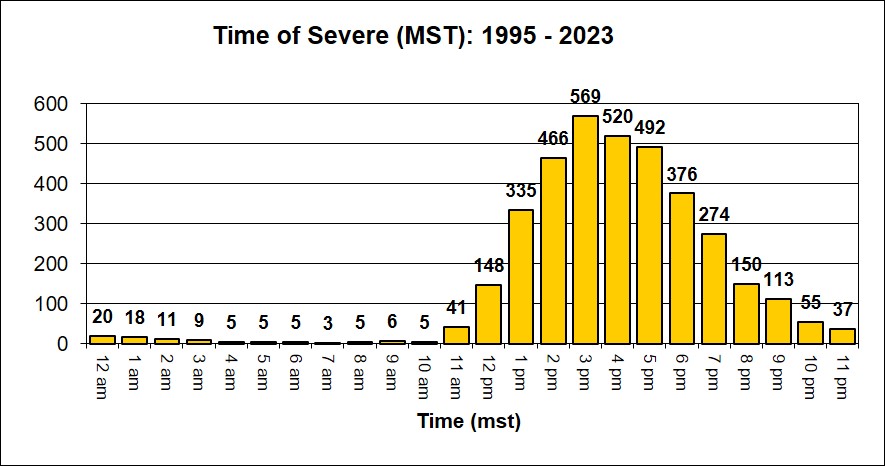
Bar graph above shows the amount of all types of severe weather (hail, wind, tornadoes) for each hour (mst) for the NWS Pueblo CWA. As an example, there have been 604 severe weather reports between 3:00 and 3:59 pm mst across the NWS Pueblo CWA.
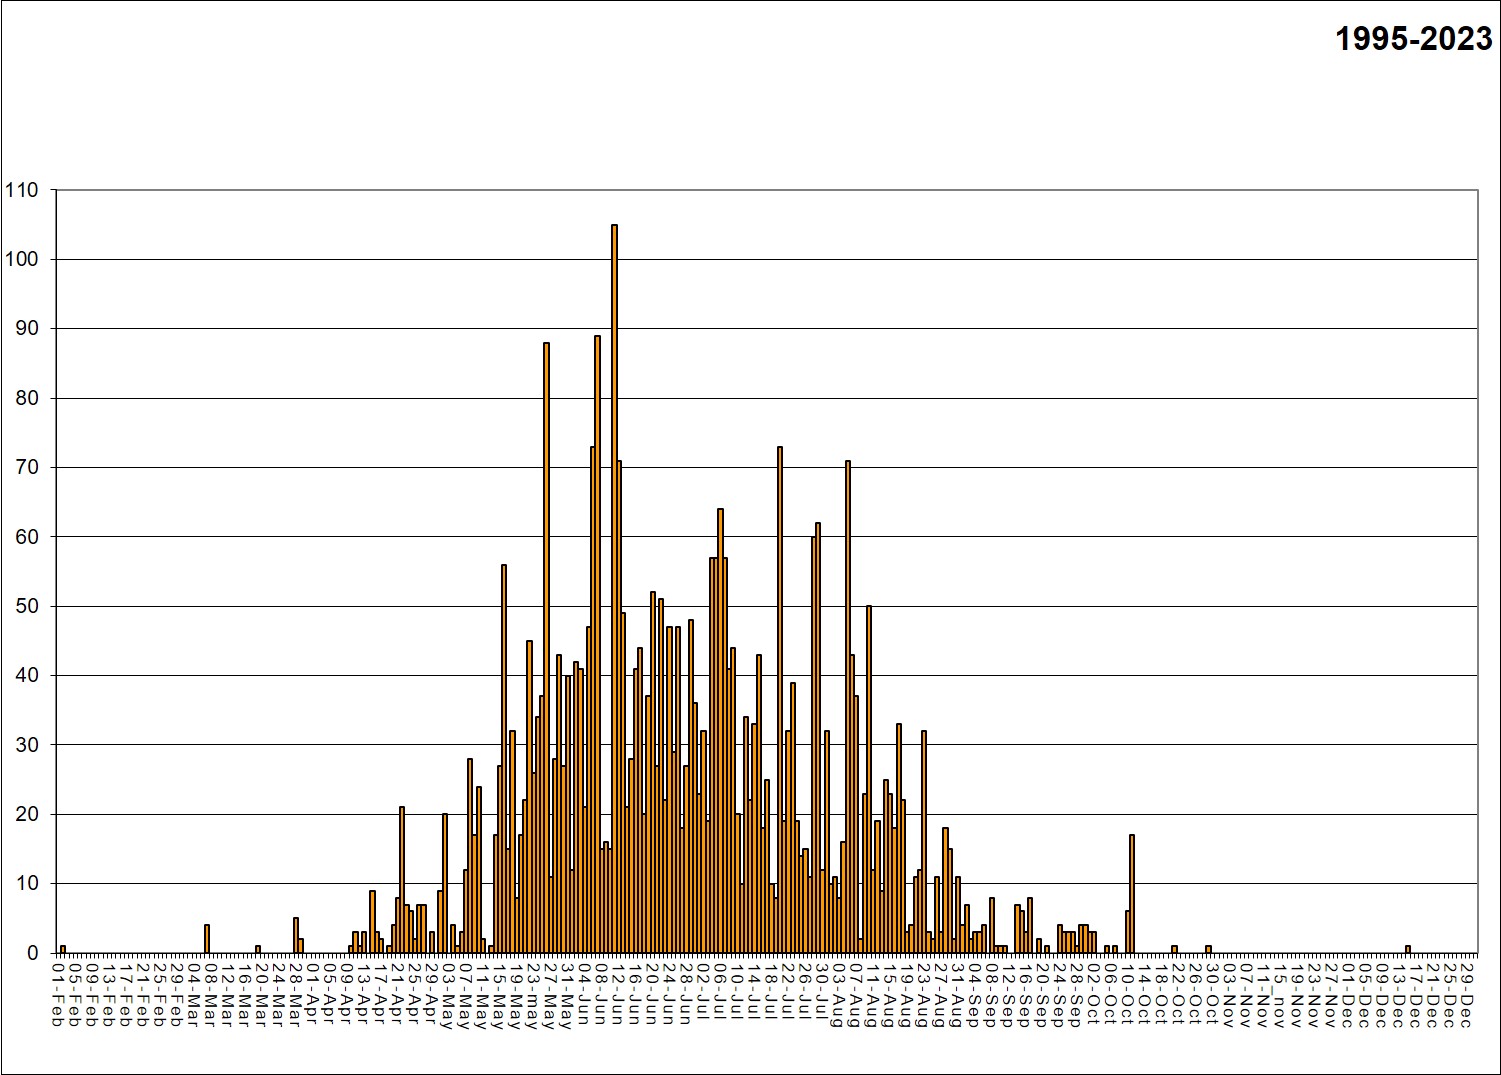
Bar graph above shows the number of all severe weather events for each day between 01 February and 31 December for the years 1995-2025 inclusive. Click on the image for a larger view. No severe convective weather has been reported in the month of January.
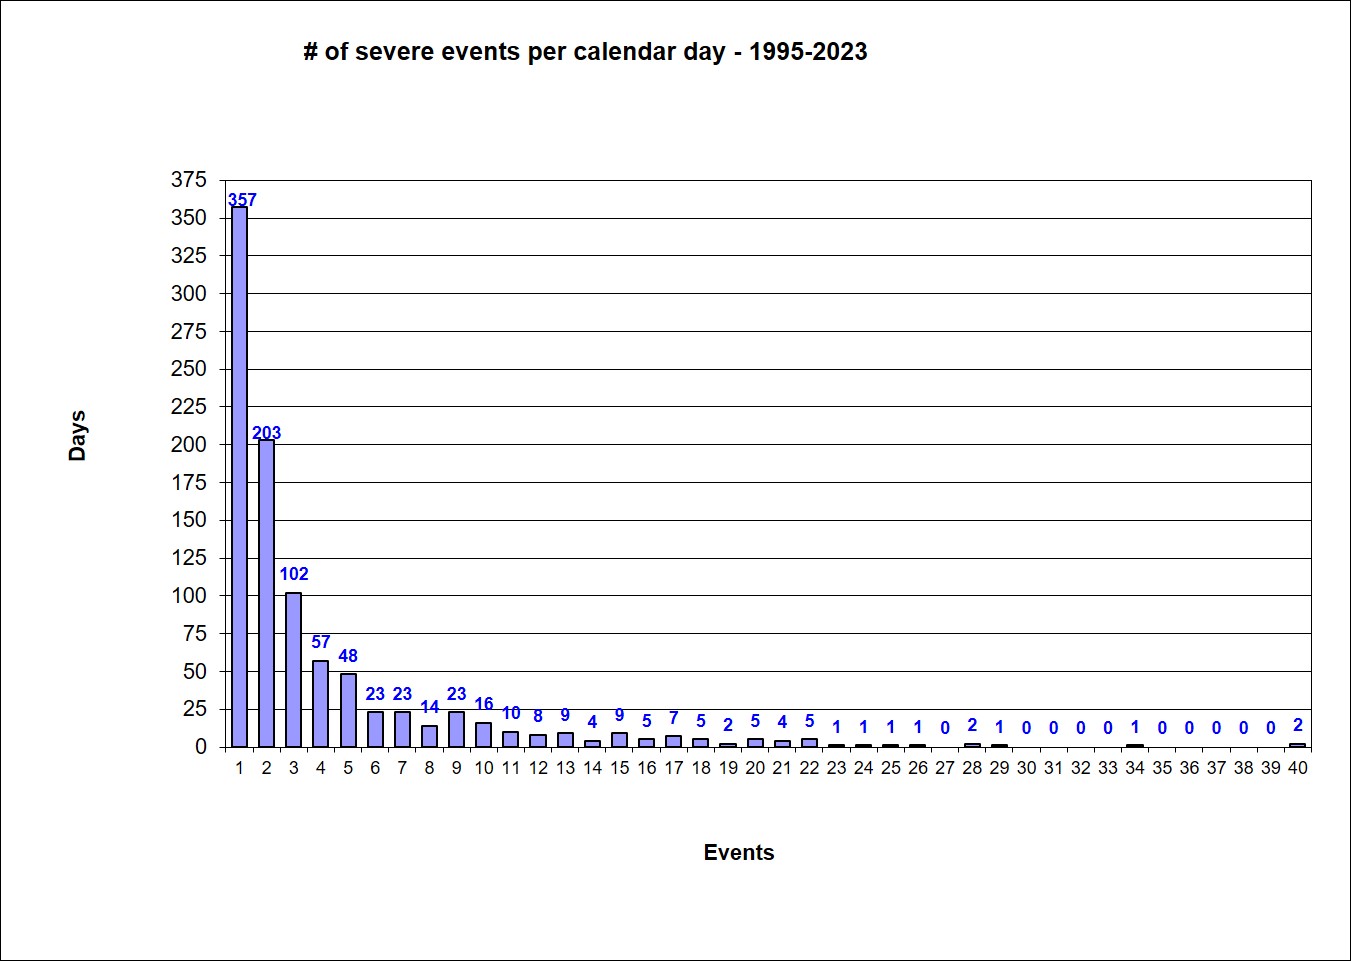
Bar graph showing the amount of all types of severe weather events per calendar day from 1995 to 2025. As an example, there have been 387 days in which only one severe weather report was received for that day; there have been 220 days in which 2 severe weather reports have been received for that day, etc.
severeWeatherClimatology

