So what does La Nina typically mean for the Inland Northwest? La Nina winters often bring cooler than normal temperatures and above normal precipitation. This combination brings above normal snowfall for an average La Nina. These impacts are largely due to blocking high pressure that builds in the Eastern Pacific, resulting in a cooler northwest flow with the storm track aimed at the Pacific Northwest.
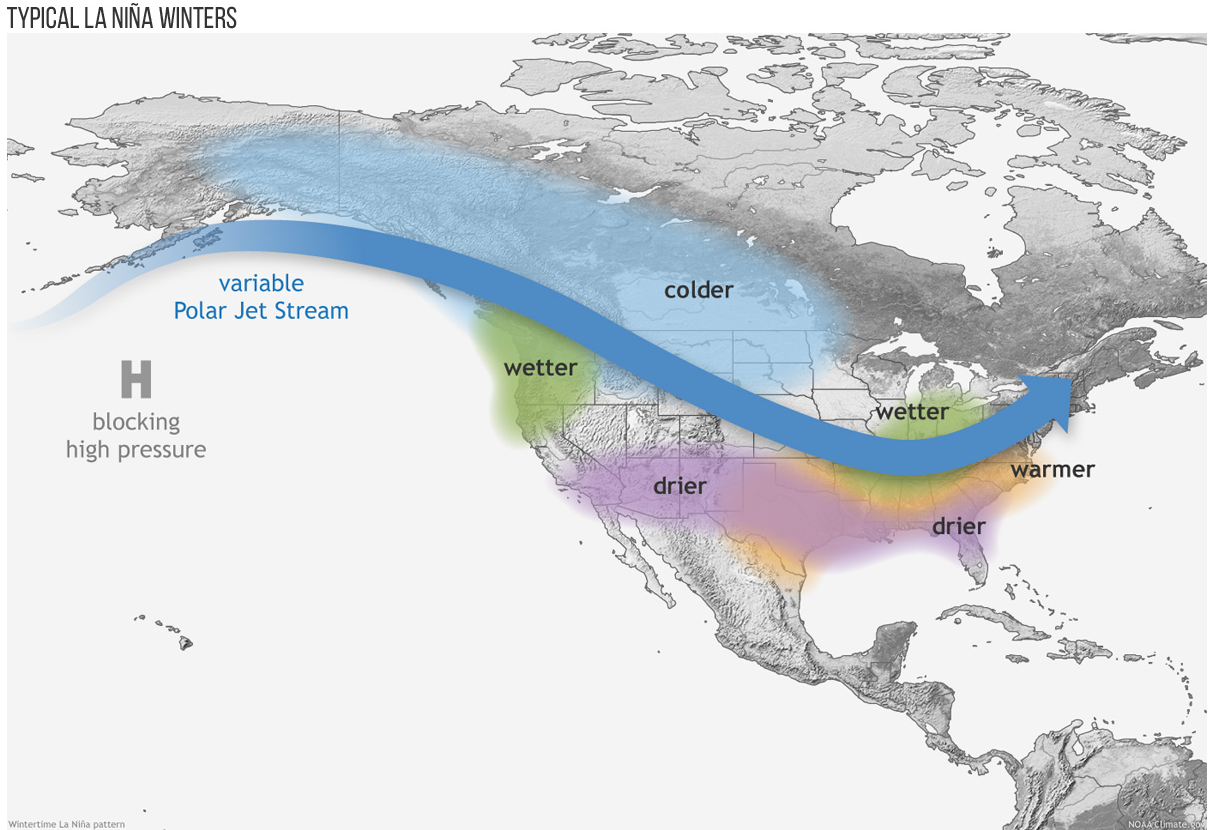
The image above shows the typical jet stream orientation for La Nina winters.
The reason for this change in the jet stream pattern is tied to the ocean temperatures in the equatorial pacific. The slight change in ocean temperatures impacts where clouds and precipitation fall, which in turn changes the position and strength of both the pacific and polar jet streams.
Below is an example from 2025 showing La Nina conditions in the central Equatorial Pacific.
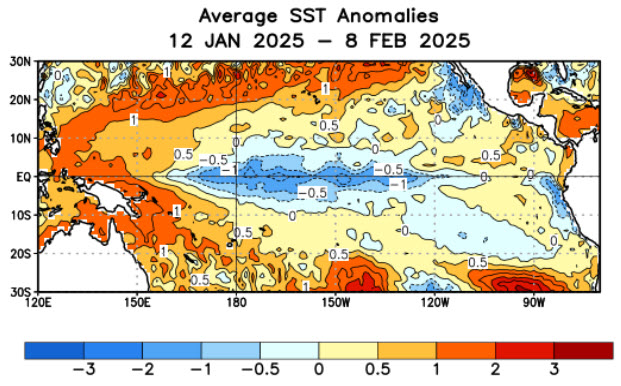
The above graphic shows Sea Surface Temperature Anomalies over a 28 day period from January 12th-February 8th, 2025. Anomalies refer to whether or not observed readings are below normal or above normal. The blue shading in the bottom graphic shows that Sea Surface Temperatures along most of the equator were below normal.
However there are other oscillations that have an impact on the atmospheric circulation. Thus, not every La Nina is the same with a wide range of possible snowfall outcomes. For example, in Spokane, the La Nina winters of 1949/1950, 1955/1956, 1974/1975, 2007/2008, and 2008/2009 resulted in over 80 inches of snowfall for the winter season. However, only 30-32 inches of snow was observed in the La Nina winters of 1967/1968, and 1970/1971. So while above average snowfall is more likely for a La Nina winter, it is not a guarantee.
The table below this paragraph shows the normal snowfall and percent of normal snowfall for La Nina Winters compared to the average of all winters. The table shows that for the eastern Columbia Basin extending east to the Spokane/Coeur D’Alene area, Palouse, Lewiston area, Blue Mountains, Camas Prairie, and Central Panhandle Mountains snowfall for a La Nina winter is 120-140% of average. Meanwhile, along the East Slopes of the North Washington Cascades and areas along the Canadian border snowfall is typically only slightly above average.
| Site | Average La Nina Snowfall | Percent of Normal |
| Bonners Ferry | 71.0" | 112% |
| Boundary Dam | 66.8" | 115% |
| Chief Joseph Dam | 33.4" | 117% |
| Coeur d'Alene | 63.0" | 123% |
| Colville | 55.5" | 118% |
| Holden Village | 316.3" | 115% |
| Kellogg | 67.0" | 125% |
| Leavenworth | 94.0" | 104% |
| Lewiston | 21.7" | 140% |
| Mazama | 131.7" | 113% |
| Moscow | 66.9" | 136% |
| Newport | 72.3" | 114% |
| Odessa | 18.0" | 119% |
| Priest River | 92.0" | 117% |
| Pullman | 46.0" | 128% |
| Republic | 60.0" | 117% |
| Ritzville | 21.5" | 113% |
| Rosalia | 30.7" | 121% |
| Sandpoint | 81.0" | 116% |
| Saint Maries | 65.0" | 116% |
| Spokane | 59.0" | 123% |
| Wenatchee | 29.4" | 113% |
| Winchester | 112.7" | 125% |
| Winthrop | 77.0" | 111% |
Data for the winters of 1949/1950 through the winter of 2016/2017 was used in this study. For sites that reported missing or erroneous snowfall data for portions of the winter season, then that year’s data was not used in the study. For some sites this meant only one or two years of missing data in the 67 year period, while for other sites that meant several years of data not used in the study. To determine whether or not each year was an El Nino year, Neutral year, or La Nina year, the Climate Prediction Center historical ENSO table was utilized. The link to the table is listed below.
https://origin.cpc.ncep.noaa.gov/products/analysis_monitoring/ensostuff/ONI_v5.php
Anomalies less than -0.5 degrees Celsius for five consecutive three month average periods classify as a La Nina, while the anomalies greater than +0.5 degrees Celsius for the same time duration equates to an El Nino year. Note that for the 2008/2009 winter, a La Nina was not officially declared since the anomaly of -0.5C or greater was not met for five consecutive three month average periods. But since these anomalies occurred in the heart of winter and that the atmospheric circulation was La Nina like, this season was considered a La Nina when calculating statistics for each site.

