So what does El Nino typically mean for the Inland Northwest? El Nino winters often bring warmer than normal temperatures and below normal snowfall. These impacts are largely due to the Pacific jet steam sending low pressure systems south of the region into California, and the polar jet stream keeping cold air bottled up across eastern Canada.
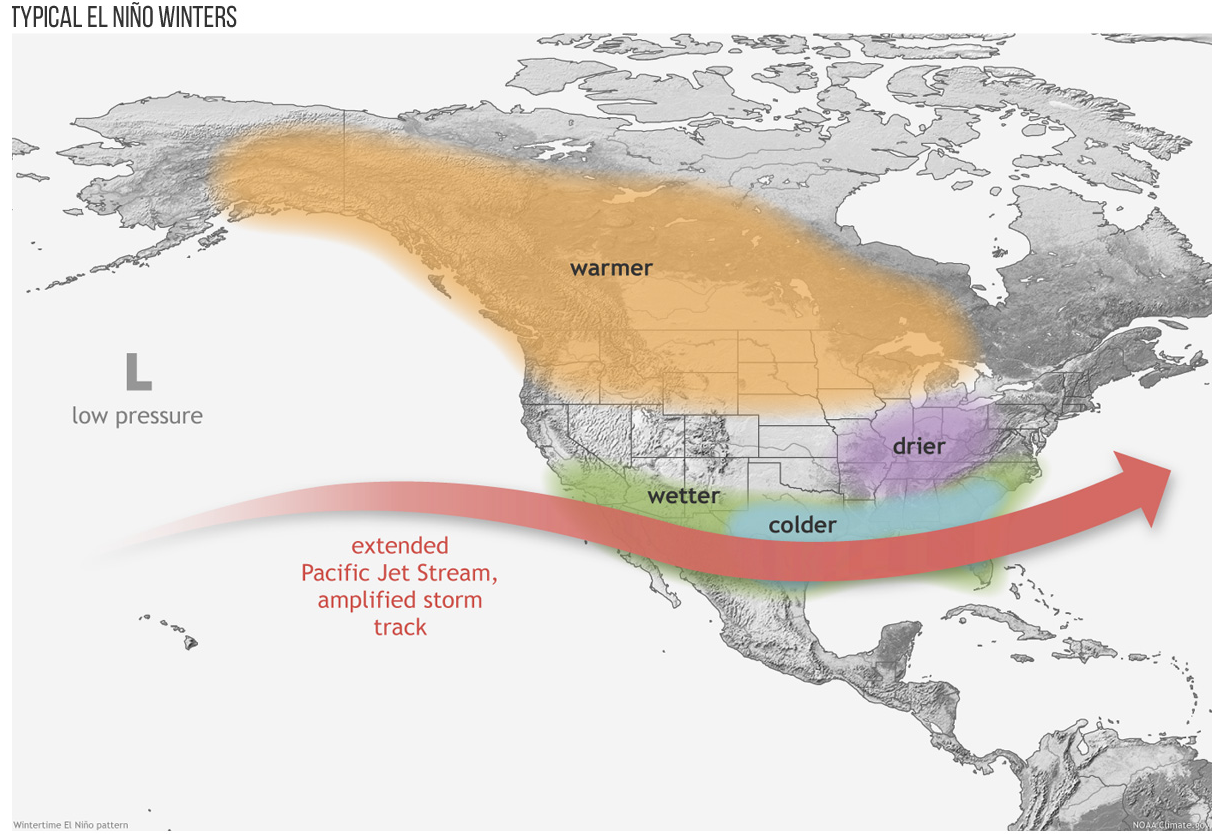
The above image shows the typical jet stream orientation for El Nino winters.
The reason for this change in the jet stream pattern is tied to the ocean temperatures in the equatorial pacific. The slight change in ocean temperatures impacts where clouds and precipitation fall, which in turn changes the position and strength of both the Pacific Jet Stream.
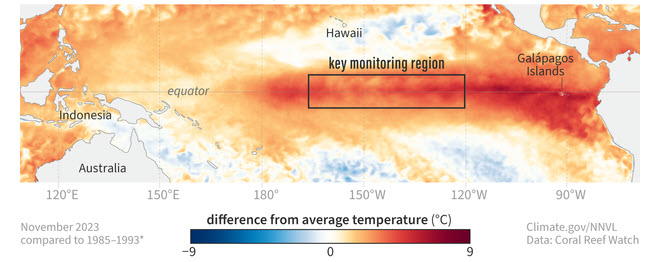
Below is an example of El Nino Conditions in the Central and Eastern Equatorial Pacific in November 2023. The orange shading in the graphic shows that Sea Surface Temperatures along all of the equator were above average.
However there are other oscillations that have an impact on the atmospheric circulation. Thus, not every El Nino is the same. For example, in Spokane, the El Nino winter of 1968/1969 brought well above normal snowfall of 78 inches for the winter season. However, less than 20 inches of snow fell in the 1972/1973, 1976/1977, 1991/1992, 1997/1998, and 2009/2010 winters. So while below average snowfall is more likely for an El Nino winter, it is not a guarantee.
The table below this paragraph show average snowfall amounts and percent of normal snowfall for an El Nino winter when compared to all winters.
| Site | Average El Nino Snowfall | Percent of Normal |
| Bonners Ferry | 53.0" | 84% |
| Boundary Dam | 46.4" | 80% |
| Chief Joseph Dam | 20.8" | 73% |
| Coeur d'Alene | 44.0" | 86% |
| Colville | 37.4" | 79% |
| Holden Village | 231.9" | 85% |
| Kellogg | 38.0" | 71% |
| Leavenworth | 94.0" | 103% |
| Lewiston | 11.1" | 72% |
| Mazama | 101.4" | 86% |
| Moscow | 33.5" | 68% |
| Newport | 48.2" | 76% |
| Odessa | 11.0" | 73% |
| Priest River | 62.7" | 79% |
| Pullman | 25.0" | 69% |
| Republic | 46.0" | 91% |
| Ritzville | 13.8" | 73% |
| Rosalia | 20.0" | 79% |
| Sandpoint | 56.0" | 80% |
| Saint Maries | 36.0" | 64% |
| Spokane | 34.4" | 72% |
| Wenatchee | 19.5" | 75% |
| Winchester | 72.2" | 80% |
| Winthrop | 66.3" | 96% |
Data for the winters of 1949/1950 through the winter of 2011/2012 was used in this study. For sites that reported missing or erroneous snowfall data for portions of the winter season, then that year’s data was not used in the study. For some sites this meant only one or two years of missing data in the 62 year period, while for other sites that meant several years of data not used in the study. To determine whether or not each year was an El Nino year, Neutral year, or La Nina year, the Climate Prediction Center historical ENSO table was utilized. The link to the table is listed below.
https://origin.cpc.ncep.noaa.gov/products/analysis_monitoring/ensostuff/ONI_v5.php
Anomalies less than -0.5 degrees Celsius for five consecutive three month average periods classify as a La Nina, while the anomalies greater than +0.5 degrees Celsius for the same time duration equates to an El Nino year.

