
Numerous severe thunderstorms are expected across a broad region from the Ohio Valley to the Mid-Atlantic and Northeast States today into tonight. Swaths of damaging wind gusts are expected and some tornadoes are possible. Bertha is expected to bring tropical storm conditions to portions of the Gulf Coast from the Florida Panhandle westward to southeastern Louisiana later today and Wednesday. Read More >
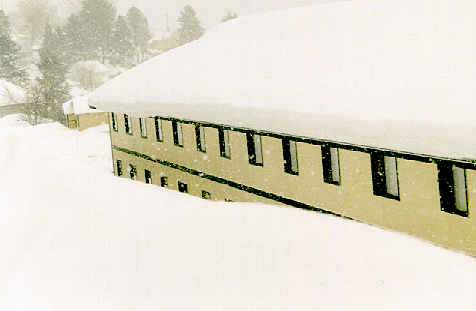
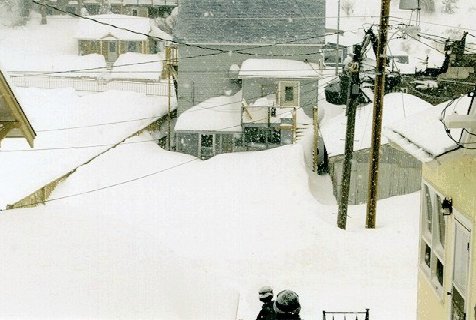
Looking at the back of a multi-story apartment building along Prospect Avenue in Lead. Picture taken by Jerome Harvey.
The blizzard of 1998 is extraordinary for two reasons: The duration of the event and the total amount of snow that fell in the northern Black Hills. From a meteorological perspective, the role the terrain played in production of the heavy snow and the location of the snow is most interesting.
The Black Hills are similar to an island, a region of elevated terrain 3000 to 4000 feet above the surrounding prairie. They are elliptical in shape oriented north to south with a length of 65 miles and a width of 30 miles. A striking contrast in average annual precipitation is found across this short distance, ranging from over 30 inches on the north end of the Black Hills to less than 15 inches on the surrounding plains. The main reason for this difference is due to upslope formed or enhanced precipitation. The following set of diagrams help explain the complexities of air circulations and how they affect the weather around the Black Hills.
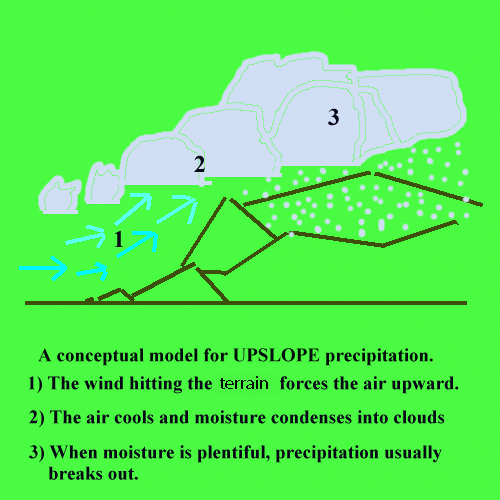
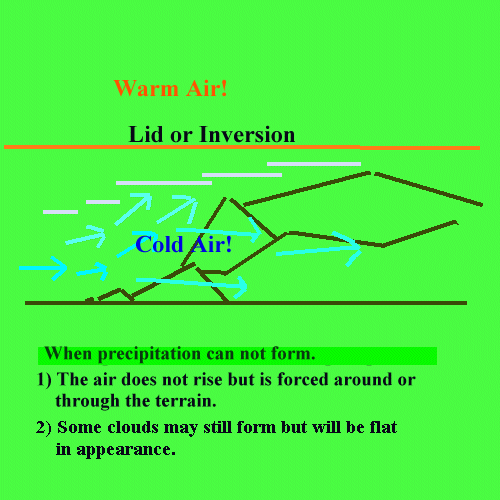
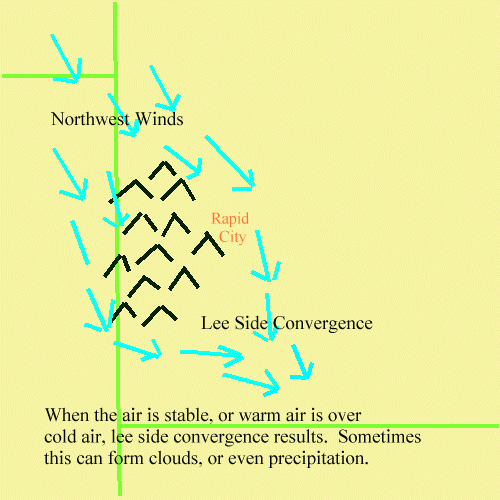
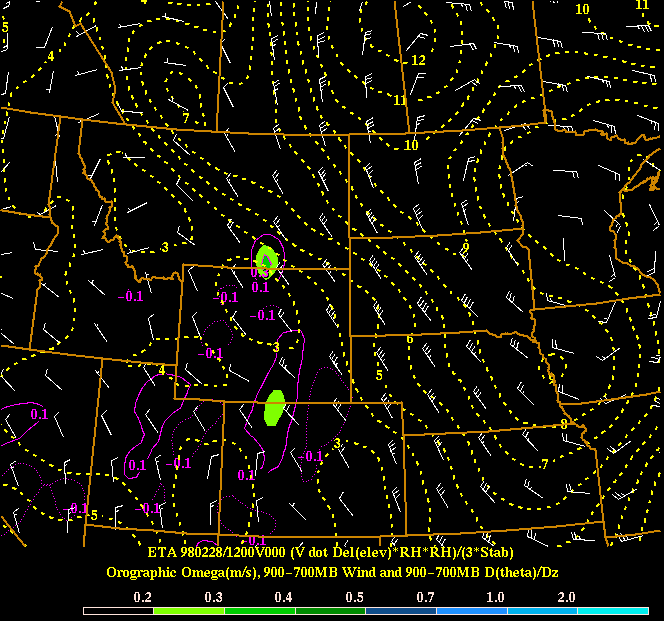
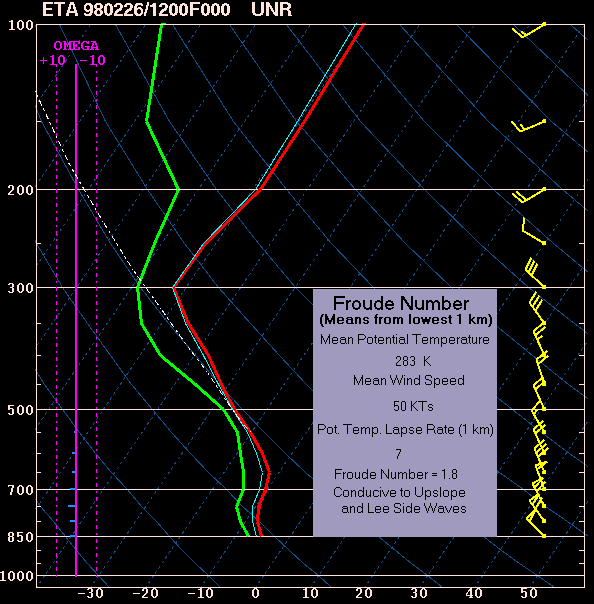
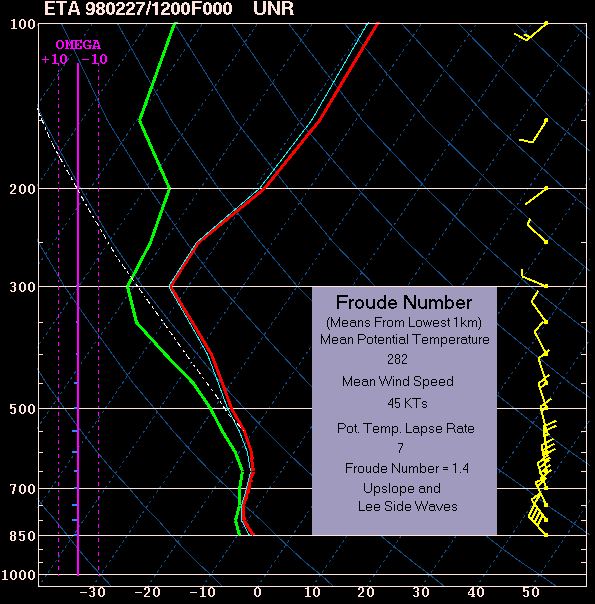
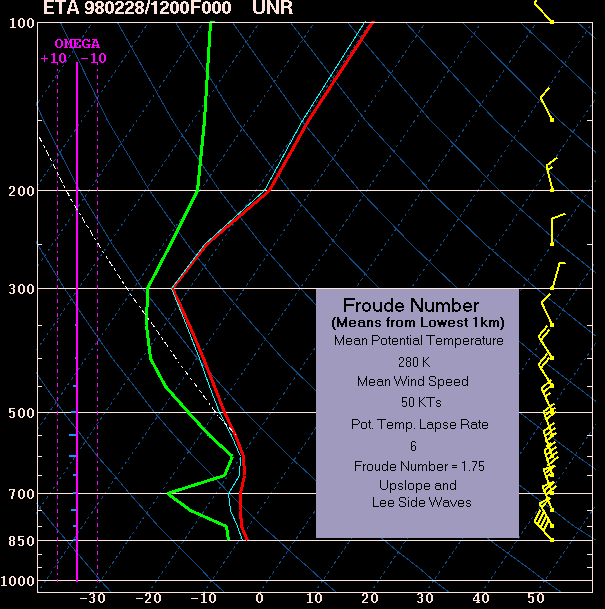
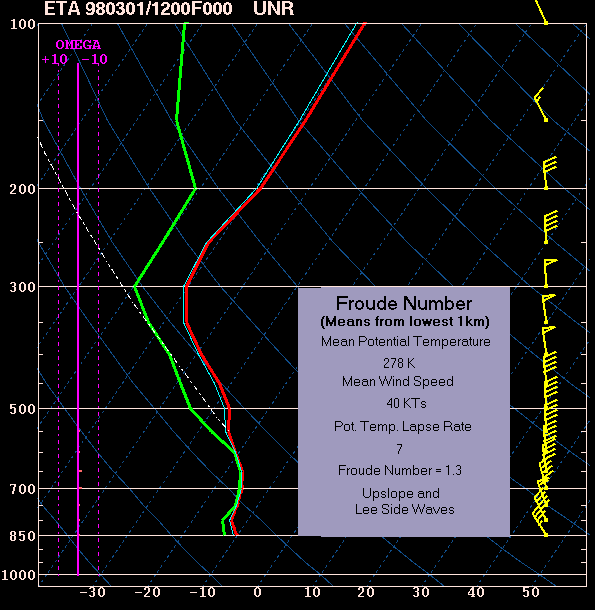
Tools have been developed to help forecasters determine when upslope precipitation may occur and what type of wind flow to expect around the Black Hills. One of these tools is the Froude number; which is a non-dimensional value based on a combination of the mean wind speed, height of the obstacle, and the buoyancy of the air. The resulting Froude number will indicate the type of flow that can be expected. When the Froude number has a value less than 1, the flow can be expected to be around the obstacle or terrain. When it is greater than 1, the air flow will go over the obstacle and upslope flow will result. If the value is within 0.2 of either side of 1, then a combination will often be observed, which results in a complex pattern of eddies and waves that form when the wind blows over western South Dakota and dramatically affects precipitation patterns.
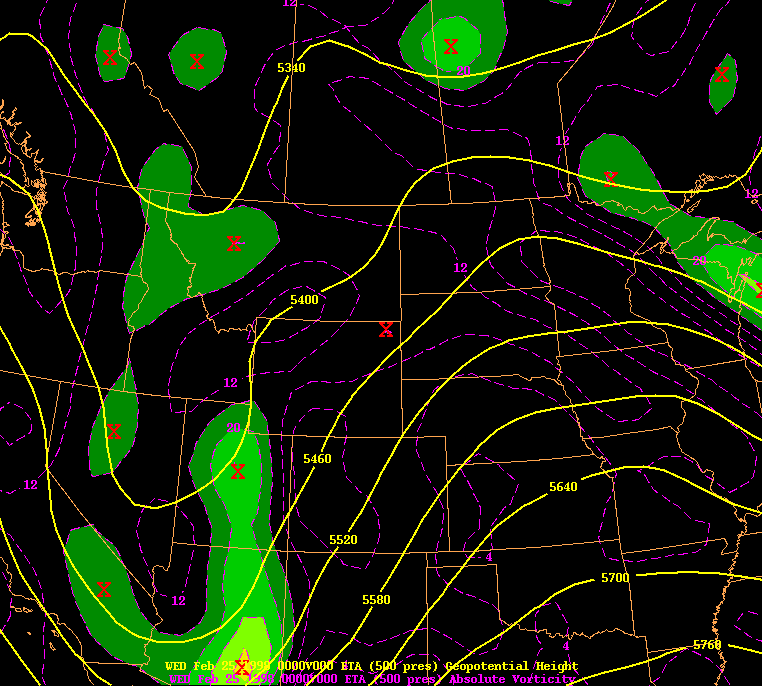
The overall northern hemisphere pattern for the 1997/98 winter season featured a split polar jet. The arctic front and subsequent airmasses remained locked in northern Canada by a strong ridge anchored over the Rocky mountains. At the same time, pacific storm systems plunged into southern California periodically undercutting the ridge. One such low geopotential slid under the ridge beginning on February 23rd and, by the 25th, began intensifying over the northern plains.
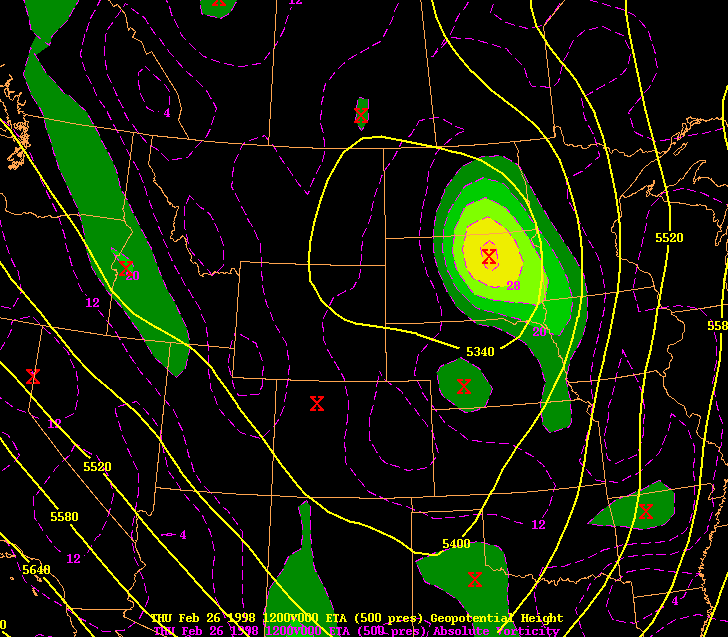
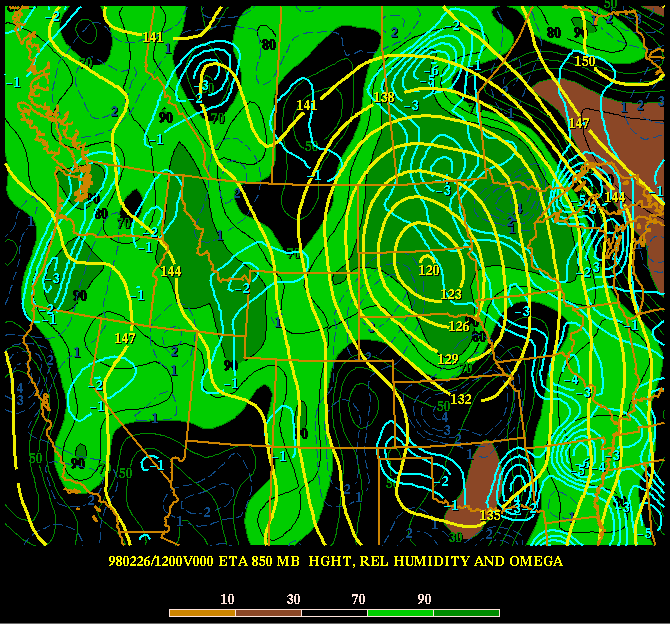
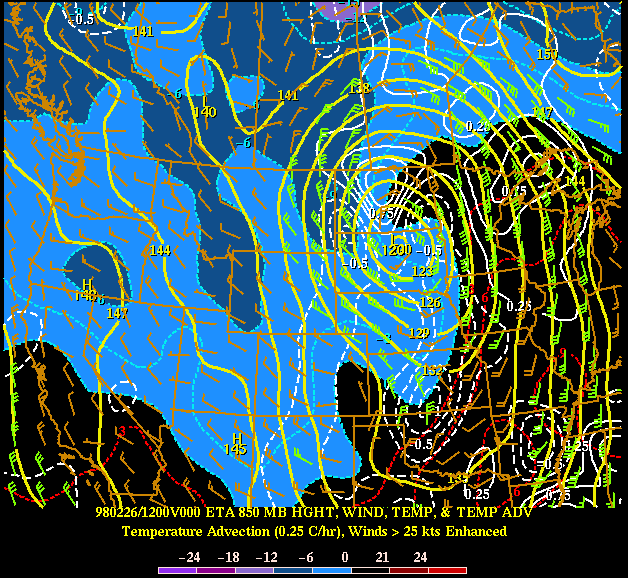
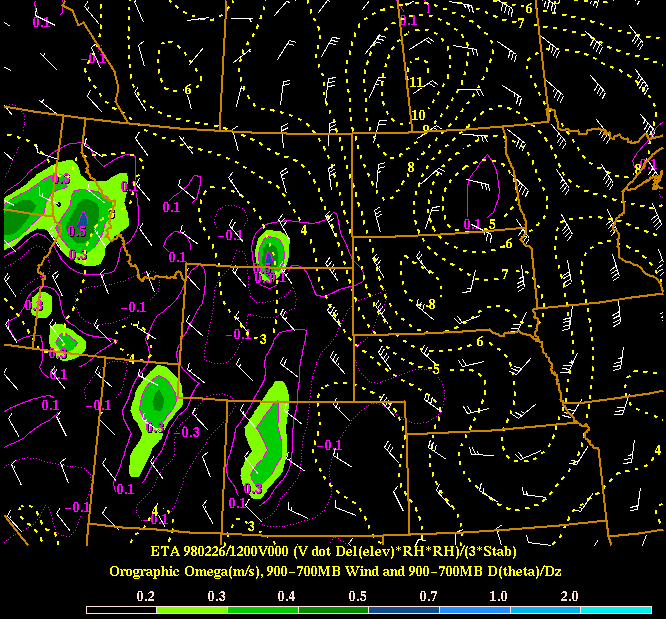
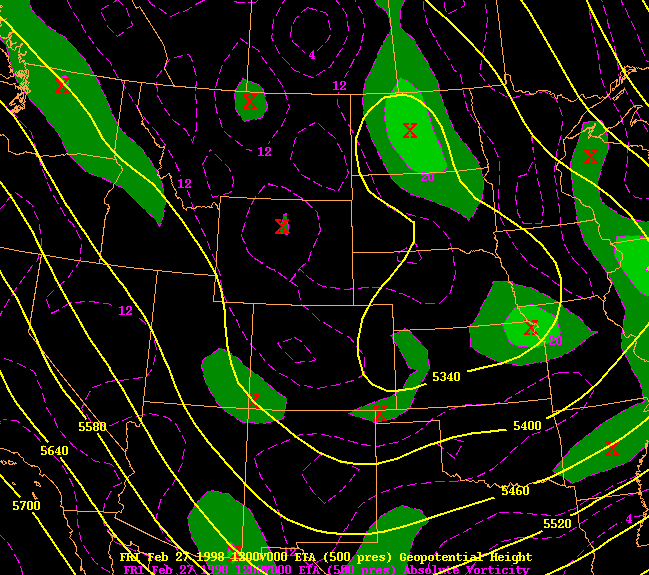
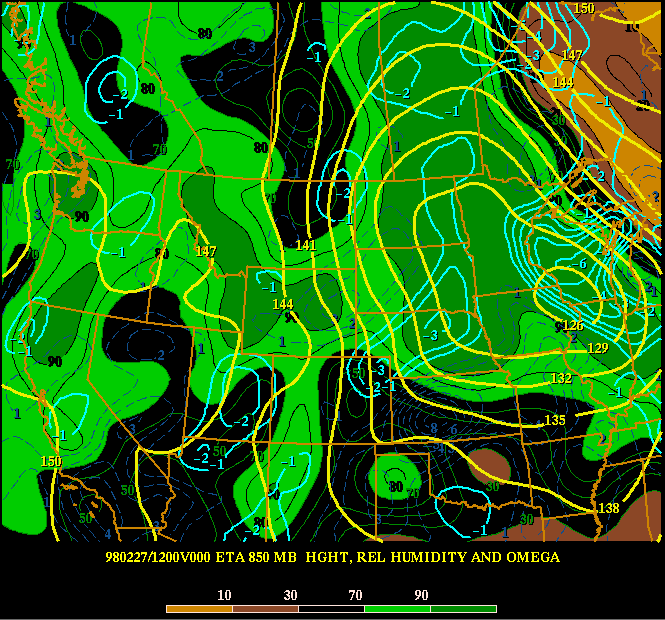
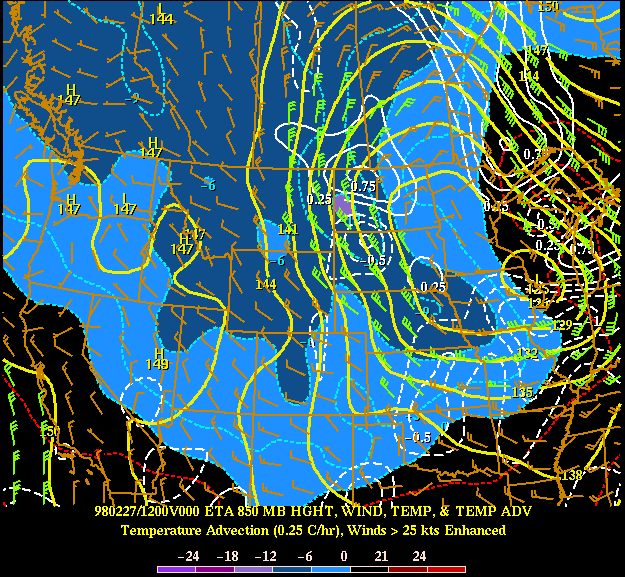
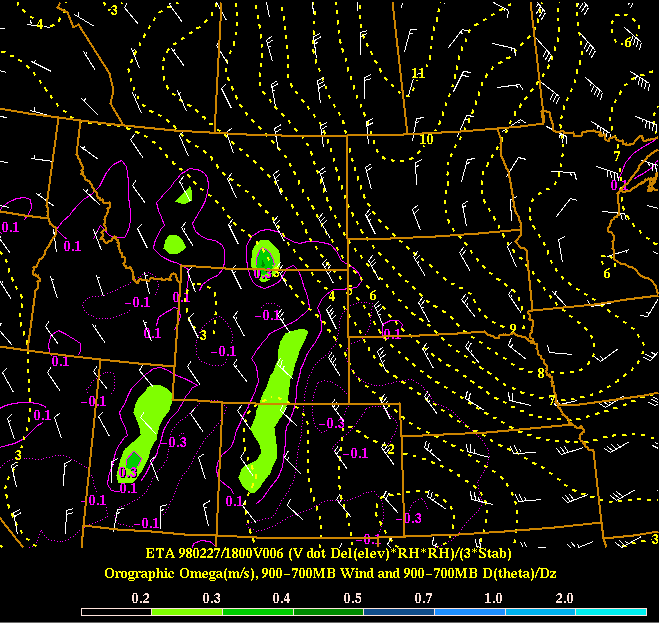
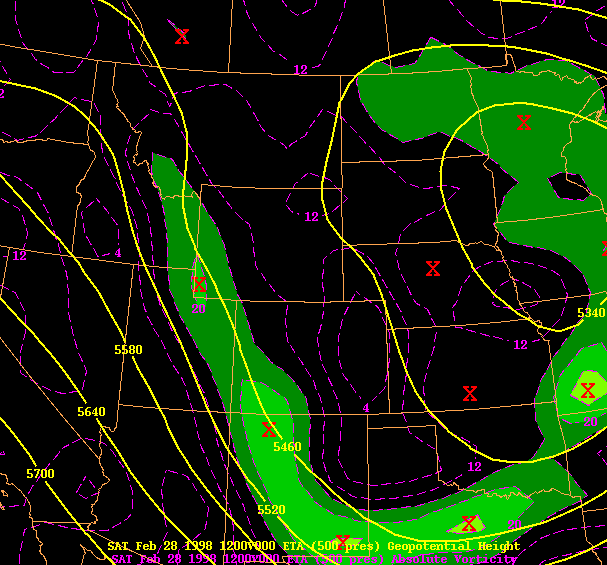
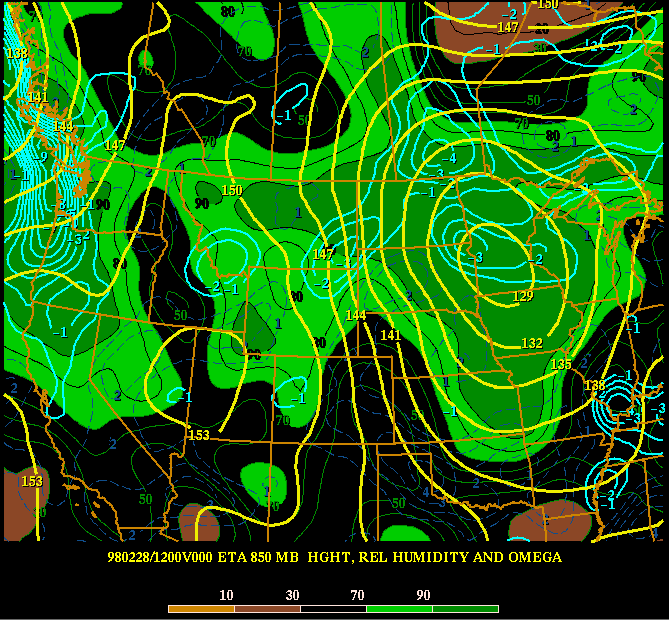
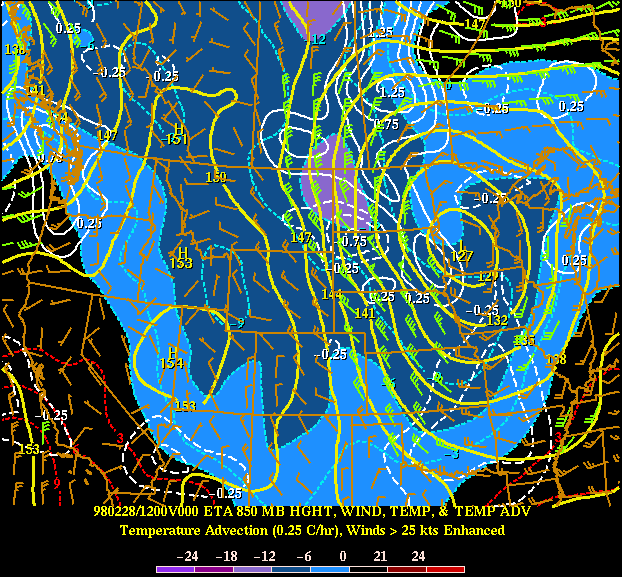
This review begins with a look at the initial model objective analysis at 980225 00z 500mb. The date-time format is YYMMDD HHZ. A strong short wave trough extended across the Rocky mountains, undercutting the mean ridge over the northern Rockies. Thirty-six hours later this wave had become a closed low over the northern plains. See the following 980226 12Z products: 500mb, 850mb A & B, 900-700mb Orographic Omega.
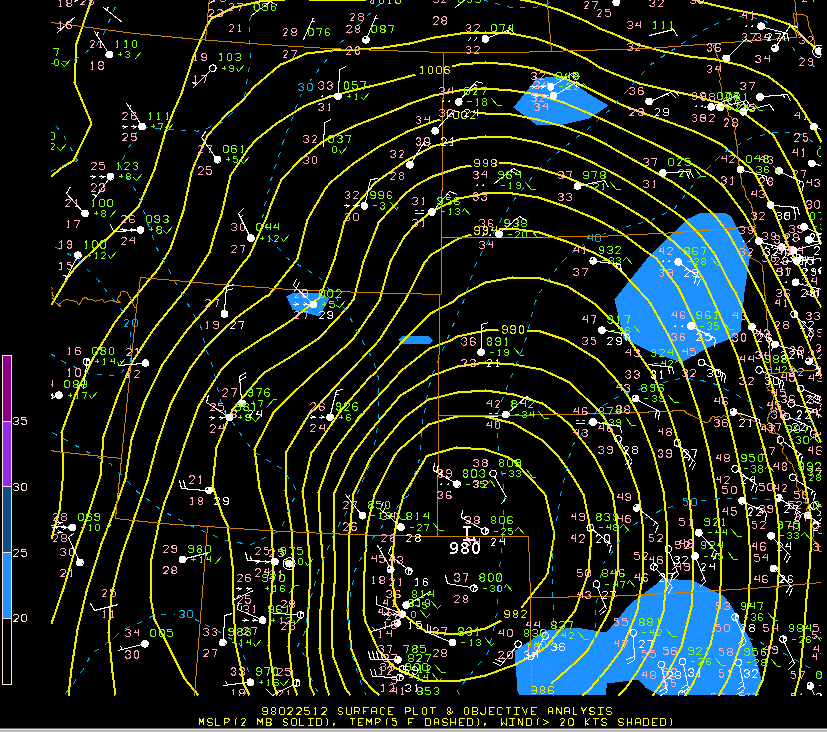
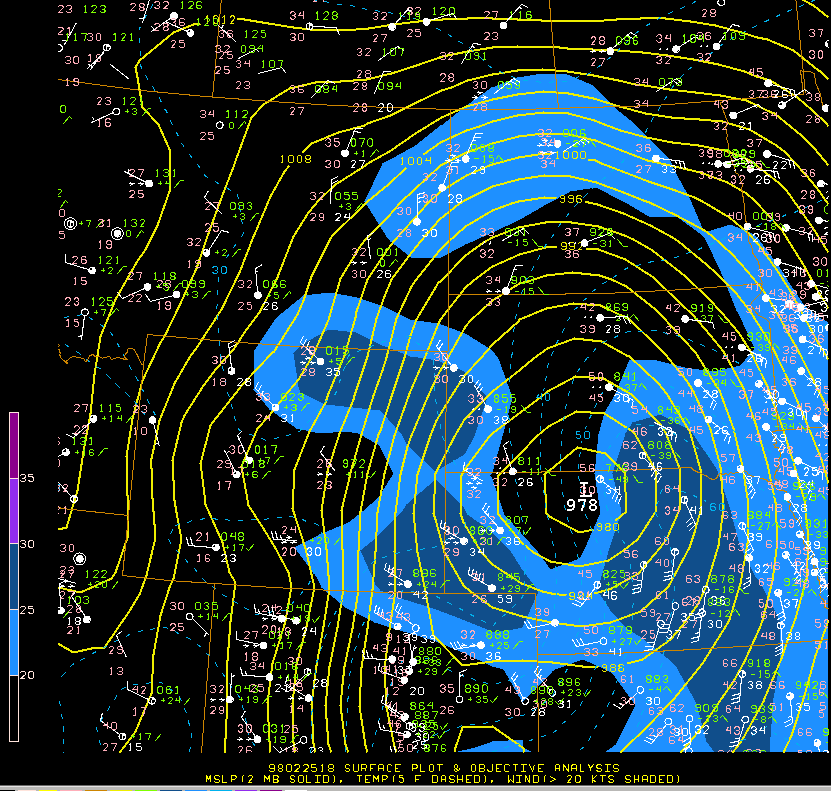
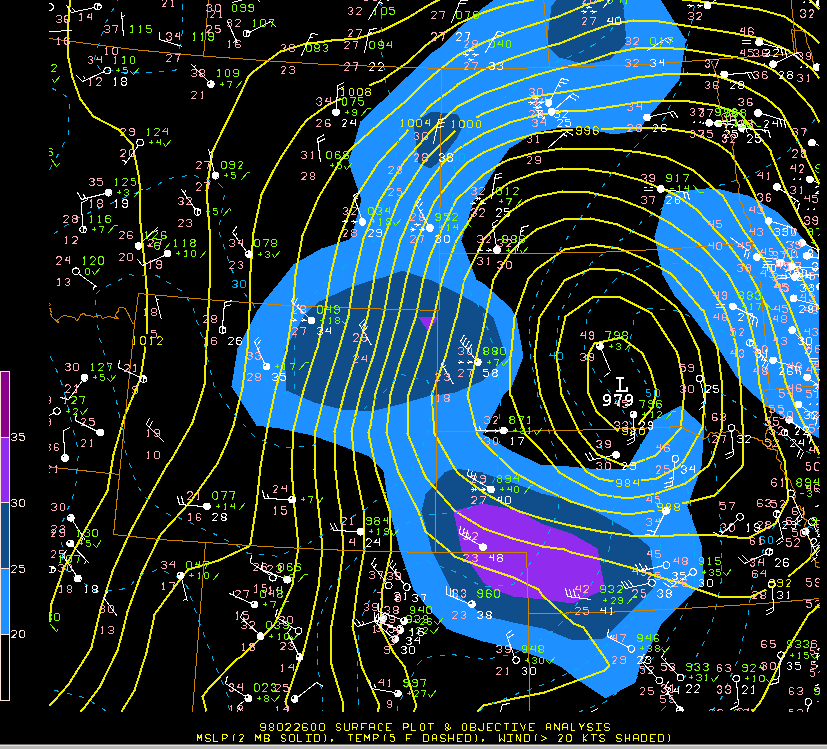
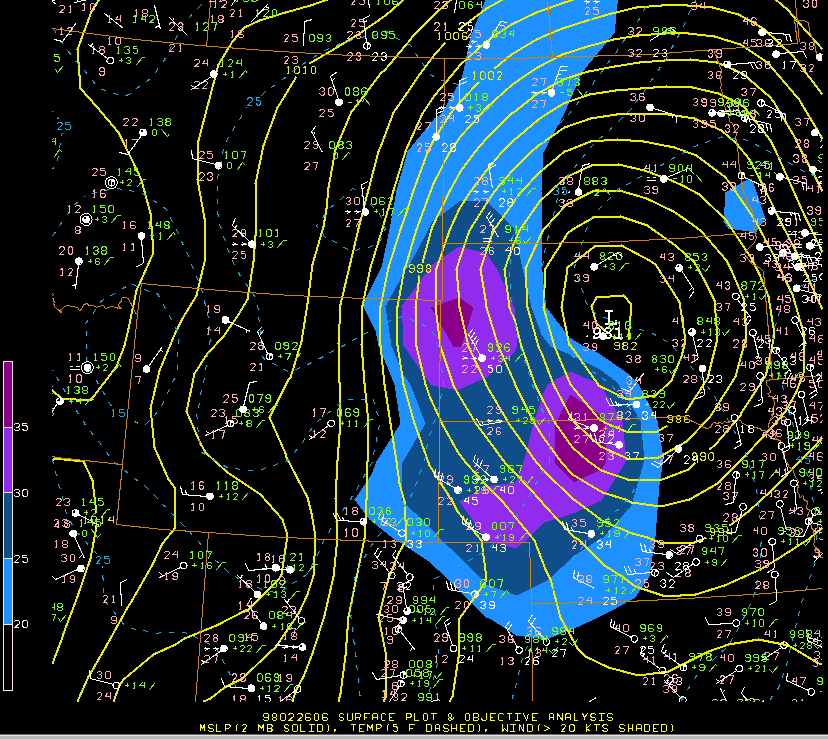
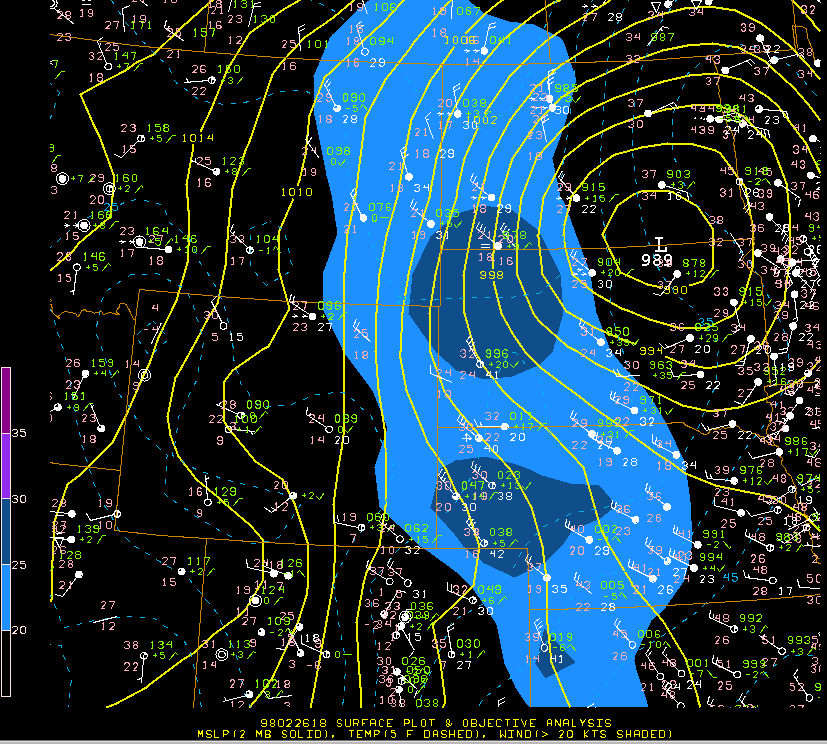
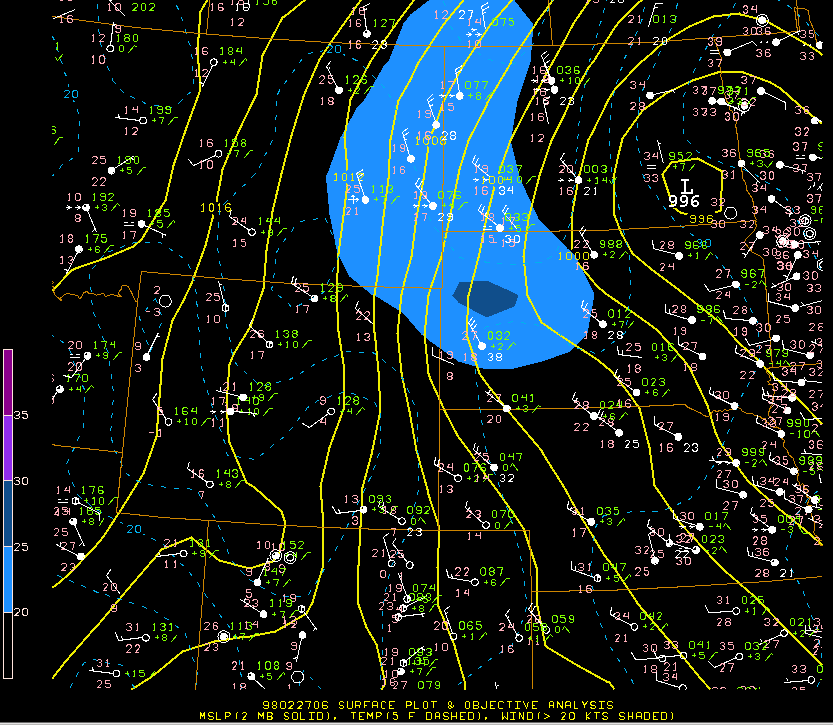
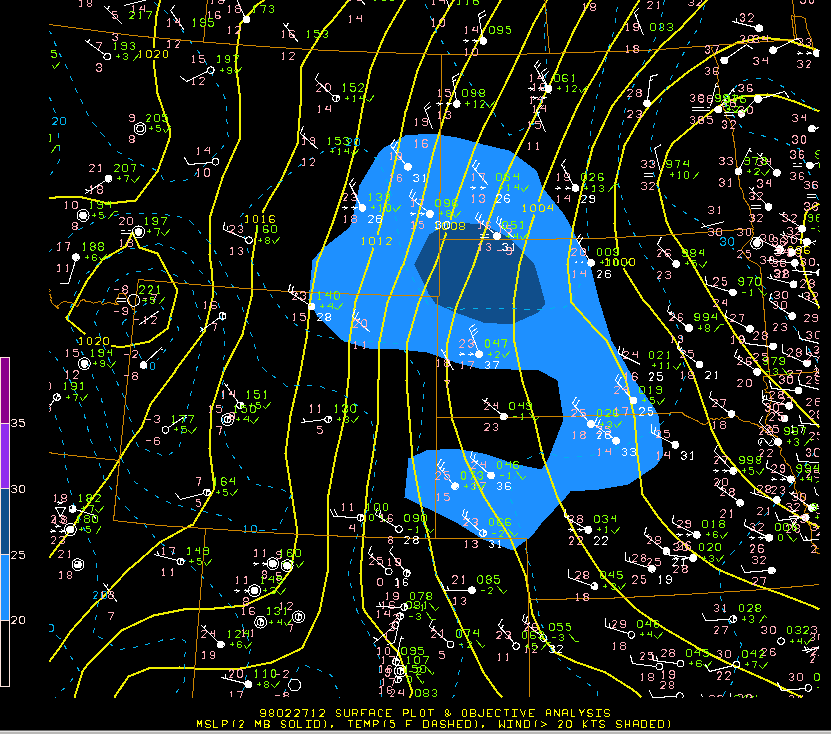
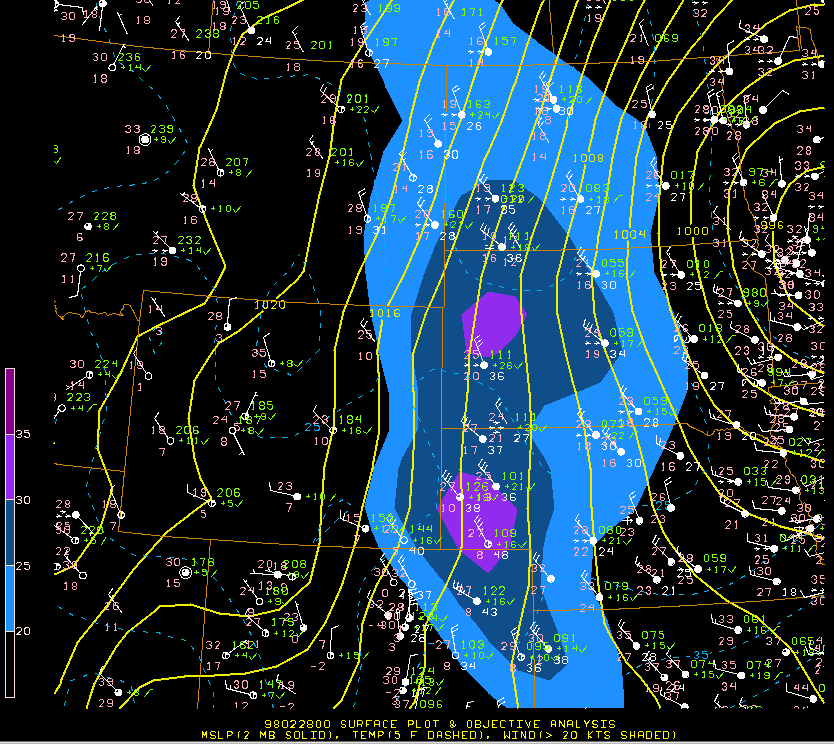
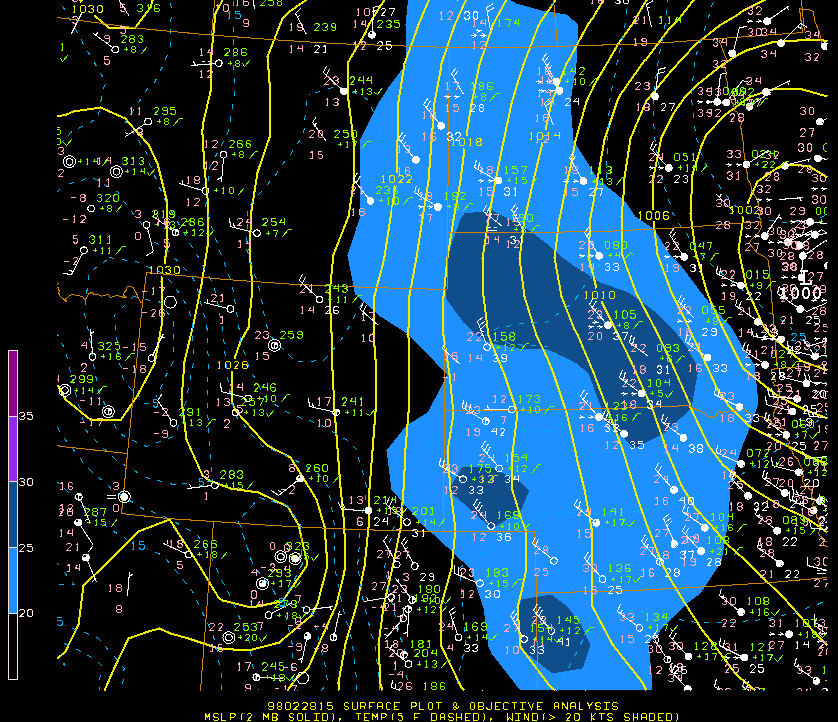
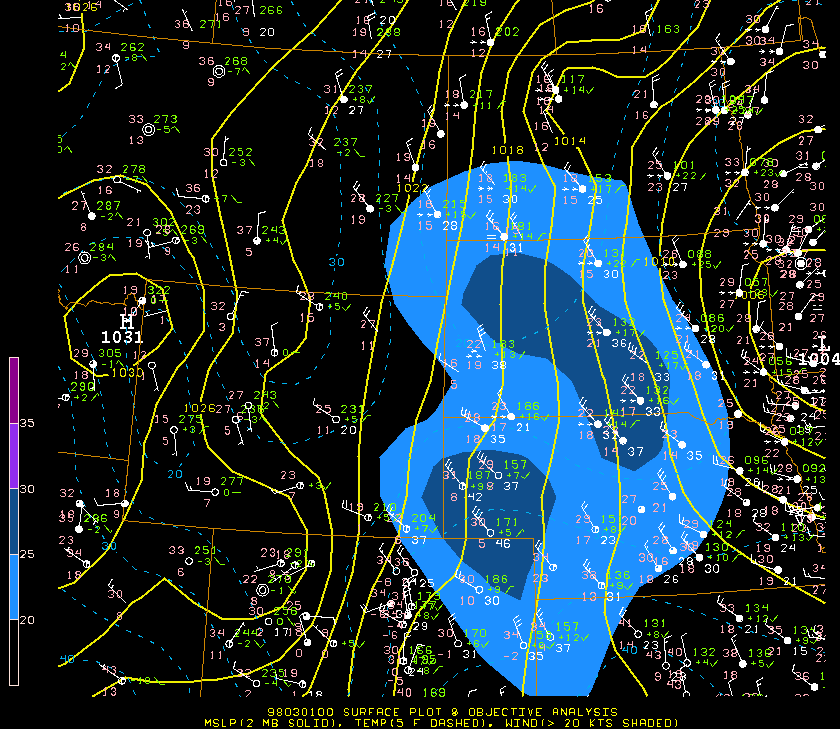
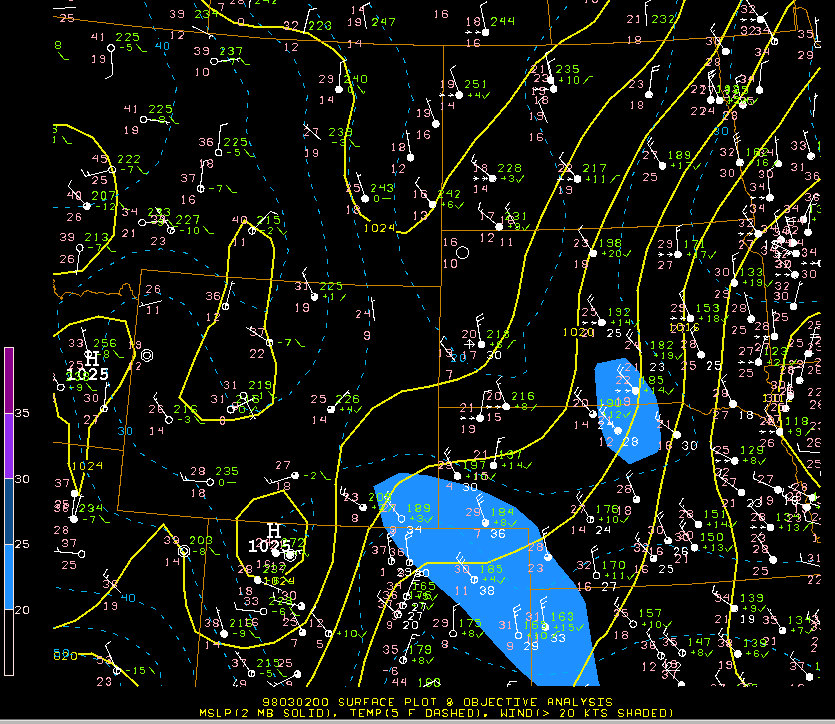
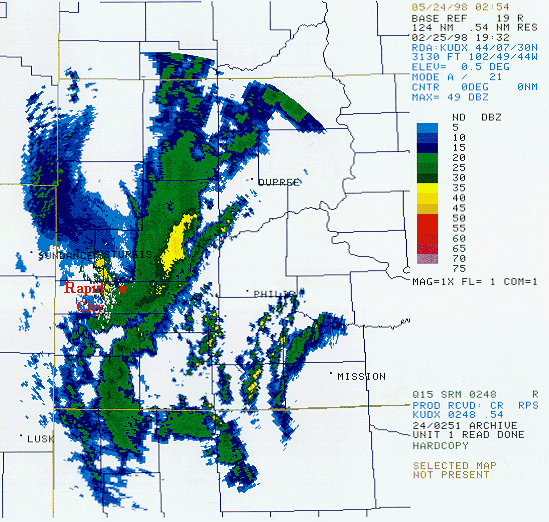
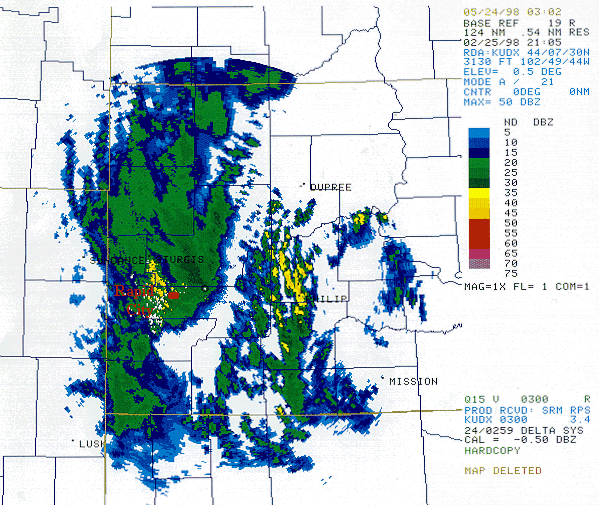
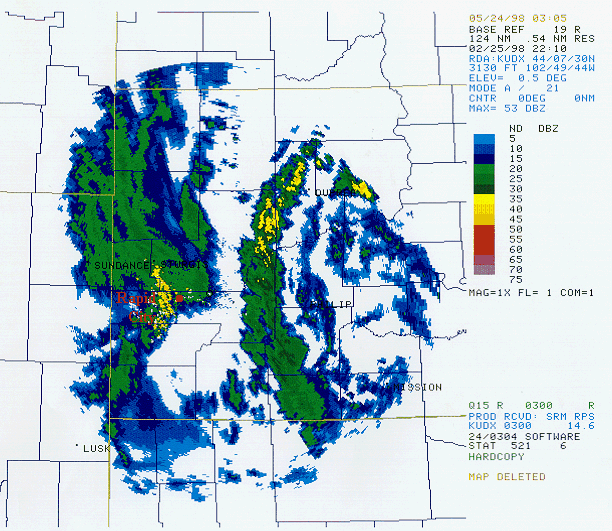
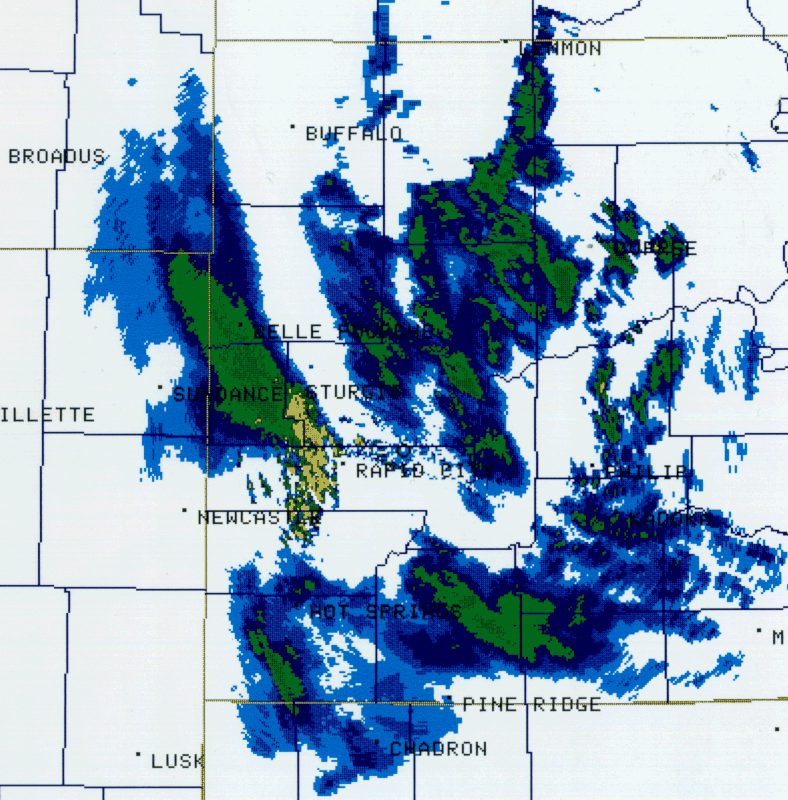
Between 12 UTC on the 25th and 12 UTC on the 26th, explosive cyclogenesis occurred over the plains from northeastern Colorado to south central South Dakota. A set of surface maps (980225 12z, 980225 21z, 980226 00z, 980226 06z, 980226 18z, 980227 06z, 980227 12z, 980228 00z, 980228 15z, 980301 00z, 980301 15z, 980302 00z) reveal the evolution of the initial low pressure center. This low tracked northeastward across South Dakota during the night on February 25-26. The spiral bands show up well on the Rapid City Doppler radar (980225 1930z, 980225 2105z, 980225 2210z). The snow combined with northwest winds up to 50 mph and caused blizzard conditions with near zero visibility. A tracked rescue vehicle was used by Pennington County Search and Rescue to bring stranded motorists just east of New Underwood on Interstate 90 to safety. Rapid City resident Gerry Broer returning from Sioux Falls was among those that spent the night at New Underwood. "It was pretty bad driving for awhile. And then a semi jack-knifed causing the interstate to be blocked, that is when they came to get us."
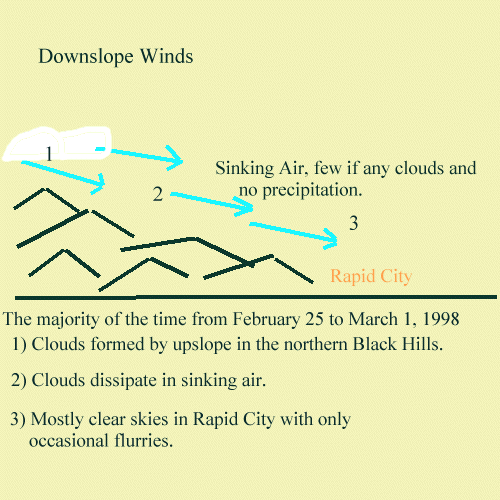
The spiral bands moved into the northern Black Hills to cause the initial bursts of heavy snow and upslope. By 980225 2210z, radar revealed that these same bands were dissipating downstream of the hills and along the eastern slopes. Rapid City received an initial burst of snow as these bands passed through. Then they dissipated as the downsloping winds overrode the dynamic and convective mechanisms responsible for their inception.
The upslope and downslope pattern set the pace for the next four days as the upper level system remained closed and locked in place over the northern plains. This is revealed in the following set of images showing the 500 mb low and its lack of eastward movement. The 850 mb maps indicate the strong northerly flow and areas of moisture that wrapped around the system to inundate the northern Black Hills. And then the atmospheric profile viewed by the soundings offers an evaluation for the Froude Number.
The following images were taken from the Rapid City Doppler radar. They begin on February 26 and go through March 2nd. The first three were taken in precipitation mode VCP 21, while the last three are in clear air mode VCP 32.
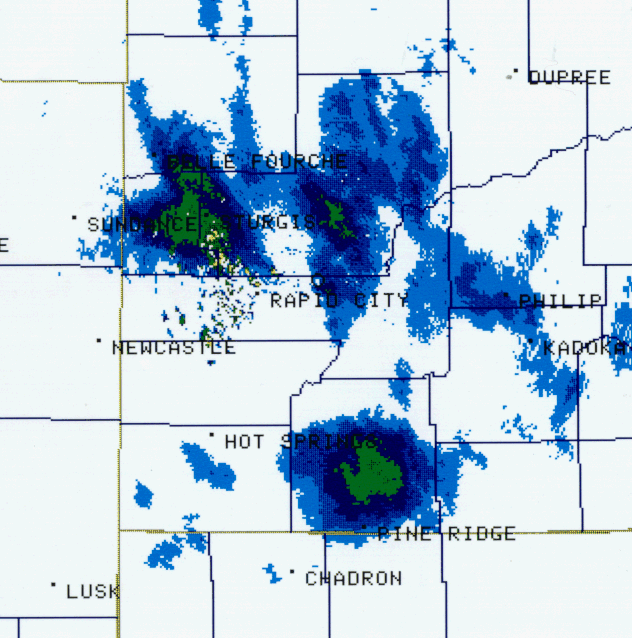
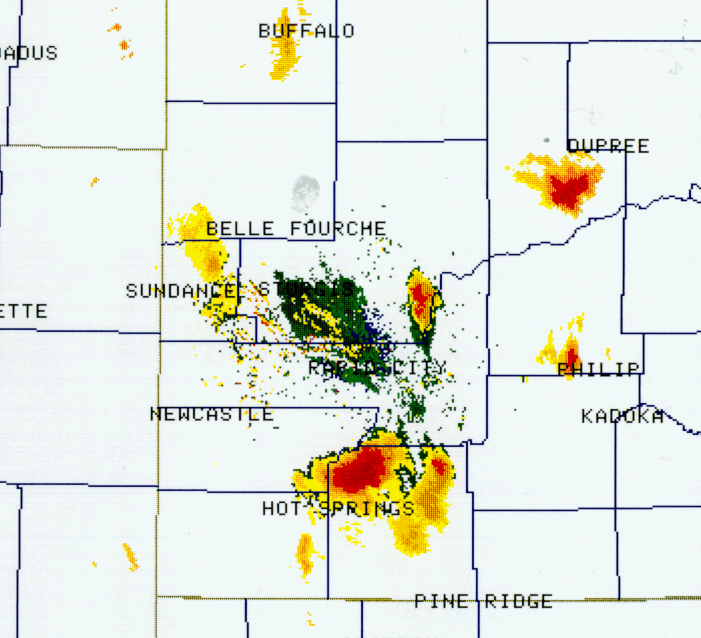
Base Reflectivity 980226 0303Z
Base reflectivity at 0303 UTC February 26 (8:03 p.m. MST February 25). Notice the absence of returns along the eastern portions of the Black Hills, from Rapid City to Hot Springs, and then another increase further south. This is due to a combination of upslope, then downslope, and then lee side convergence and wake turbulence.
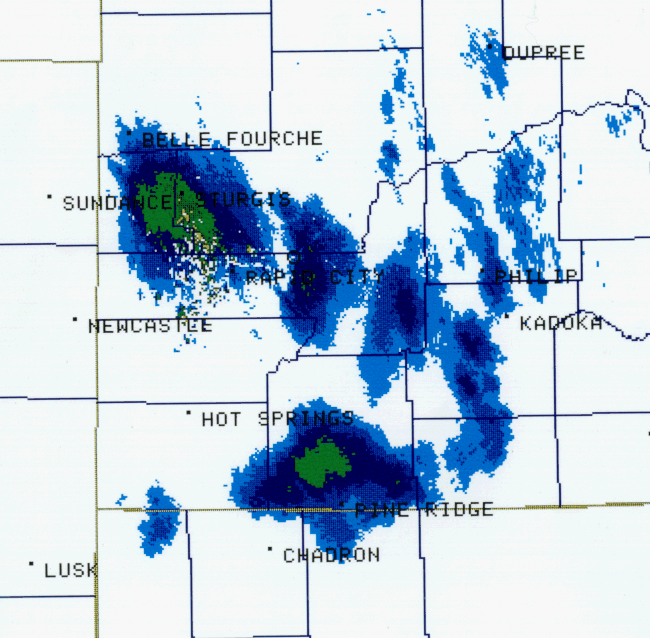
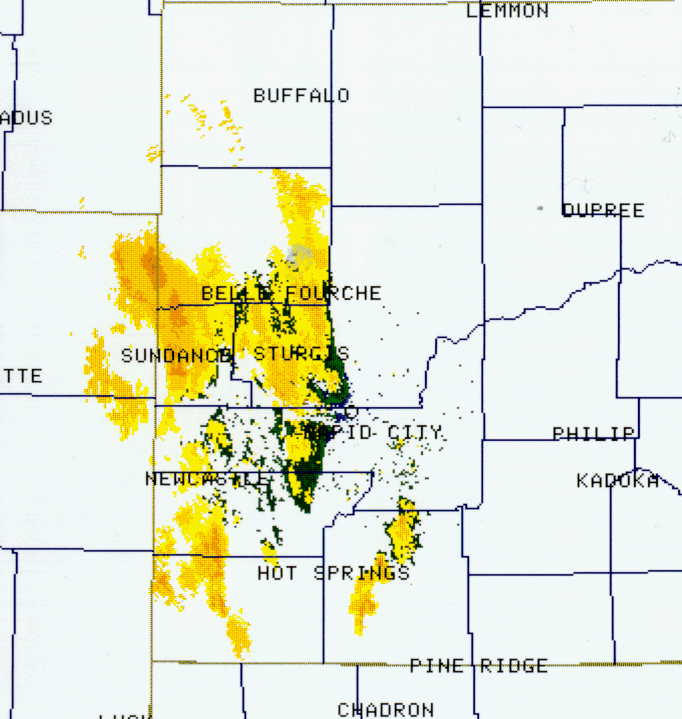
Base Reflectivity 980227 1439Z
Base reflectivity at 1439 UTC February 27 (7:30 a.m. MST). Again, notice upslope and lee side convergence over Pine Ridge.
Base Reflectivity 980228 0019Z
Base reflectivity at 0019 UTC February 28 (5:19 p.m. MST February 27). Not much change, except for the appearance of wake rotors east of the Black Hills.
Base Reflectivity 980301 0931Z
Base reflectivity at 0931 UTC March 1 (2:31 a.m. MST). Radar in clear air mode (VCP 32). The enhancement over the plains is due to wrap-around moisture from the northwest, which added another 18 inches of snow in six hours to the northern Black Hills.
Base Reflectivity 980302 0354Z
Base reflectivity at 0354 UTC March 2 (8:54 p.m. MST March 1). Returns have decreased to a few flurries.
Base Reflectivity 980302 0809Z
Base reflectivity at 0809 UTC March 2 (1:09 a.m. MST). The Northern Black Hills gets one last round of snow.
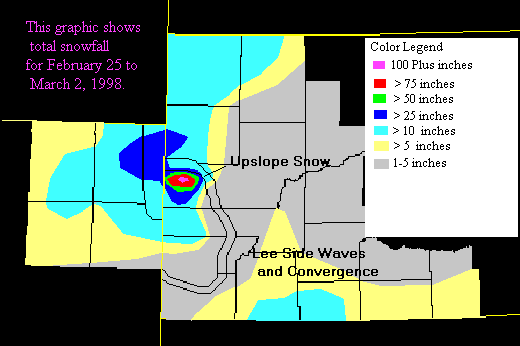
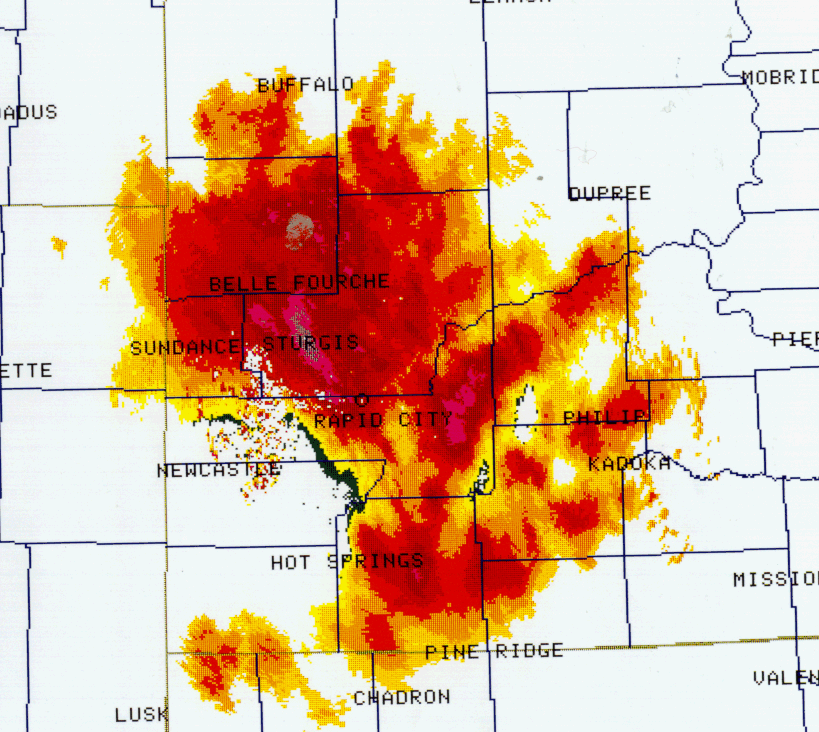
Total Snowfall for February 25 to March 2, 1998
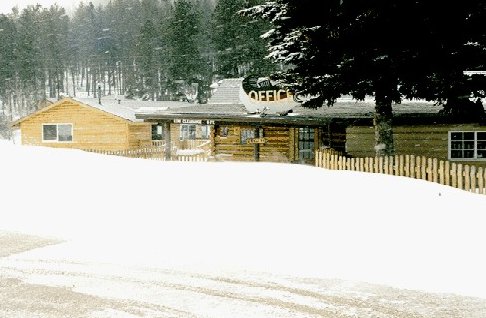
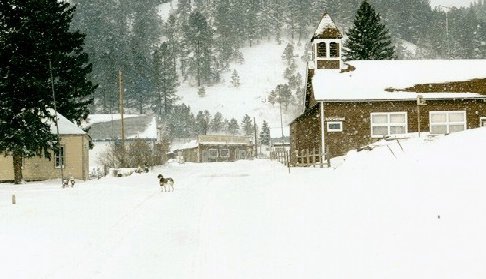
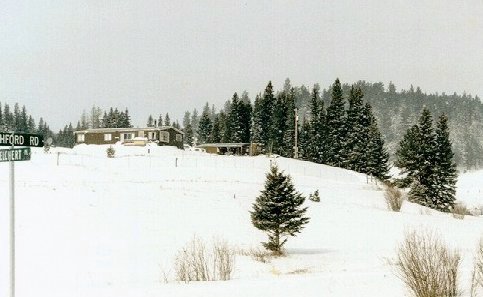
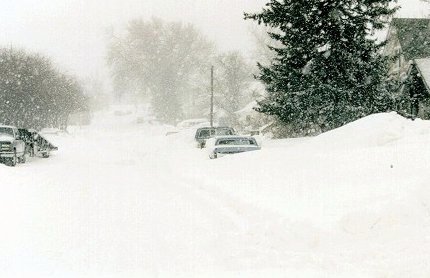
Several pictures from a storm survey of the northern Black Hills on March 1, 1998 are shown below. The route begins five miles west of Rapid City where very little snow was evident. Just 20 miles further into the Black Hills, a dramatic change occurred with over 20 inches of snow in "Down Town" Rochford. The survey turned north into Lead where the official storm total was 114 inches for the five day period. The route continued through Spearfish Canyon into Spearfish, where the upslope mechanisms were visible and ended in Sturgis.
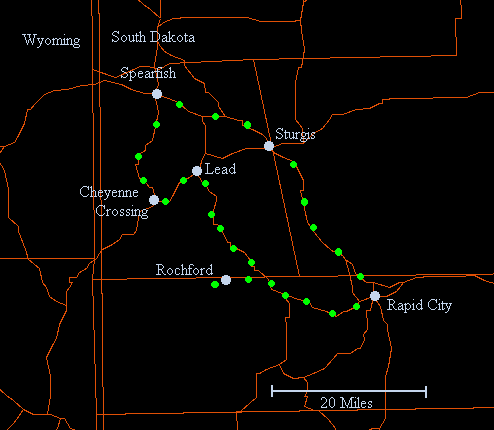
Map of the picture locations around the northern Black Hills.
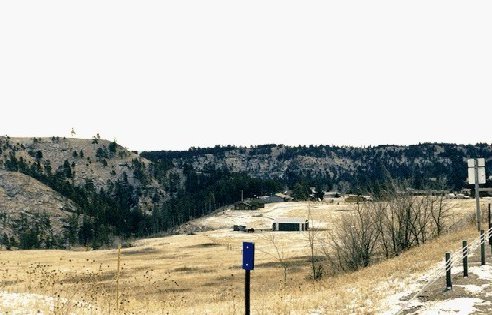
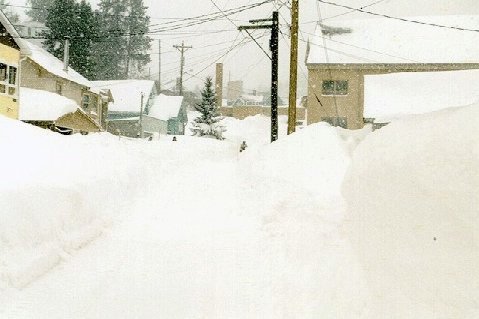
Five miles west of Rapid City on Highway 44 looking east. Highway 385 at the Pennington-Lawrence County line.
Rochford, South Dakota, 25 miles west of Rapid City, received more than 20 inches of snow.
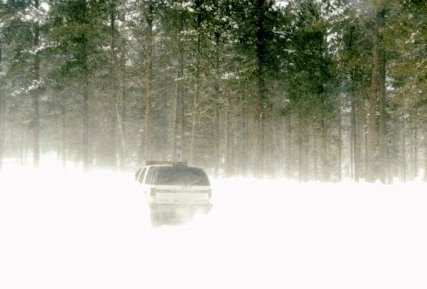
A state Highway Patrol Trooper drives down a forest road.
Lead digs out from another 18 inches of snow overnight.
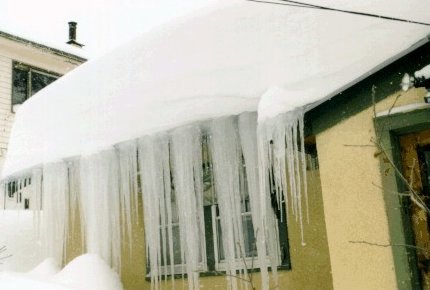
A dog takes a leap of faith and found nothing but fluff. Melting snow frozen into a near sheet of ice.
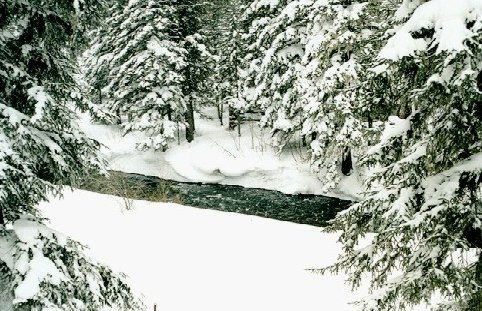
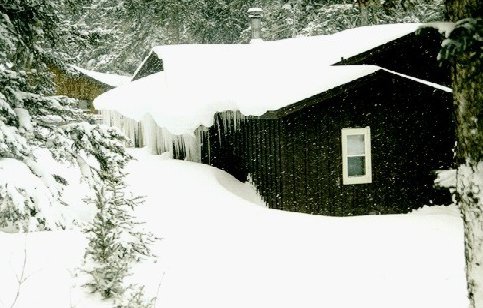
Spearfish Creek just north of Cheyenne Crossing. A cabin near Cheyenne Crossing.
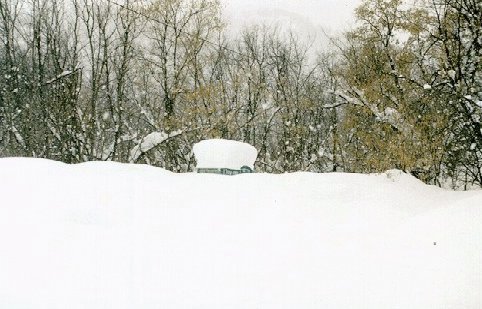
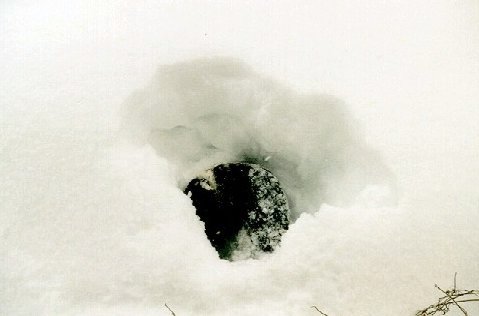
An outhouse buried under 5 feet of snow.
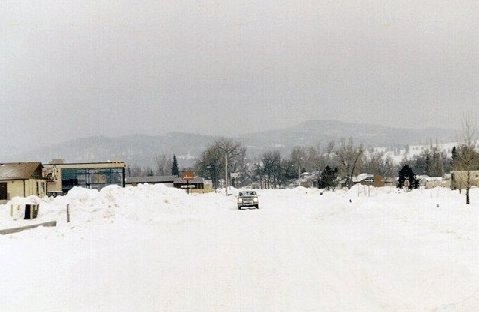
Looking south from Spearfish toward the northern Black Hills. A Sturgis neighborhood.
Dark clouds were forming along the leading edge of the higher
terrain, and the release of moisture began just down wind as
shown by the snow in the distance.
Model forecasts and products were dependable during the blizzard and gave accurate predictions of the upcoming and prolonged event. As a result, winter storm watches were posted over the region 36 hours before the snow began. The watches were refined into the appropriate warnings describing in detail the threat to life and property.
This blizzard produced weather conditions that warranted an extended period of winter weather warnings and advisories. The duration of the blizzard conditions over northwestern South Dakota and northeastern Wyoming prevented many residents from restocking critical supplies. In the northern Black Hills, search and rescue teams used tracked vehicles to reach stranded residents with water, food, clothing and heating fuel. On the plains, many roads were blocked and impassible. Wind chill values ranged from 20 to 50 degrees F. below zero for five days.
A review of the forecast products and warning statements revealed an outstanding performance was accomplished by the Rapid City staff to keep the public informed and up to date with the latest conditions. When prolonged blizzard events occur, keeping forecasts and warnings consistent can be challenging. Warnings remained even when conditions improved for a short time, which minimized confusion and presented overall consistency with accuracy.
From a meteorological perspective, the interaction of terrain features with the synoptic weather patterns became a predominant feature in precipitation formation and enhancement. This highlights one of the main forecast dilemmas that most operational forecasters are challenged with routinely, and one of numerical weather prediction's greatest hurdles.

