Numerous severe thunderstorms are expected across a broad region from the Ohio Valley to the Mid-Atlantic and Northeast States today into tonight. Swaths of damaging wind gusts are expected and some tornadoes are possible. Bertha is expected to bring tropical storm conditions to portions of the Gulf Coast from the Florida Panhandle westward to southeastern Louisiana later today and Wednesday. Read More >
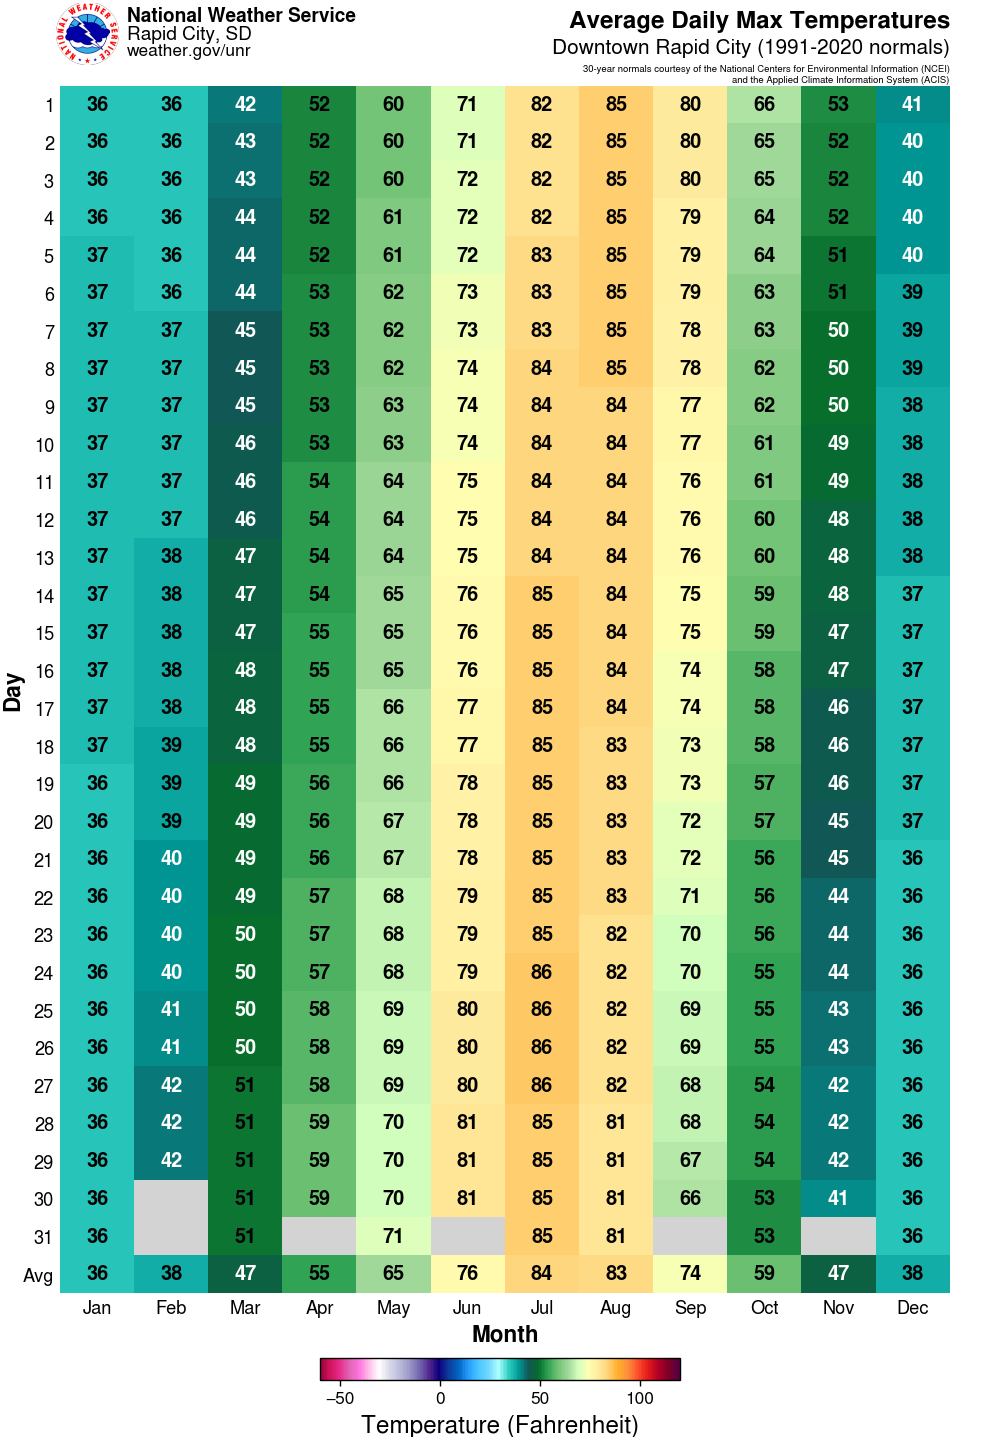
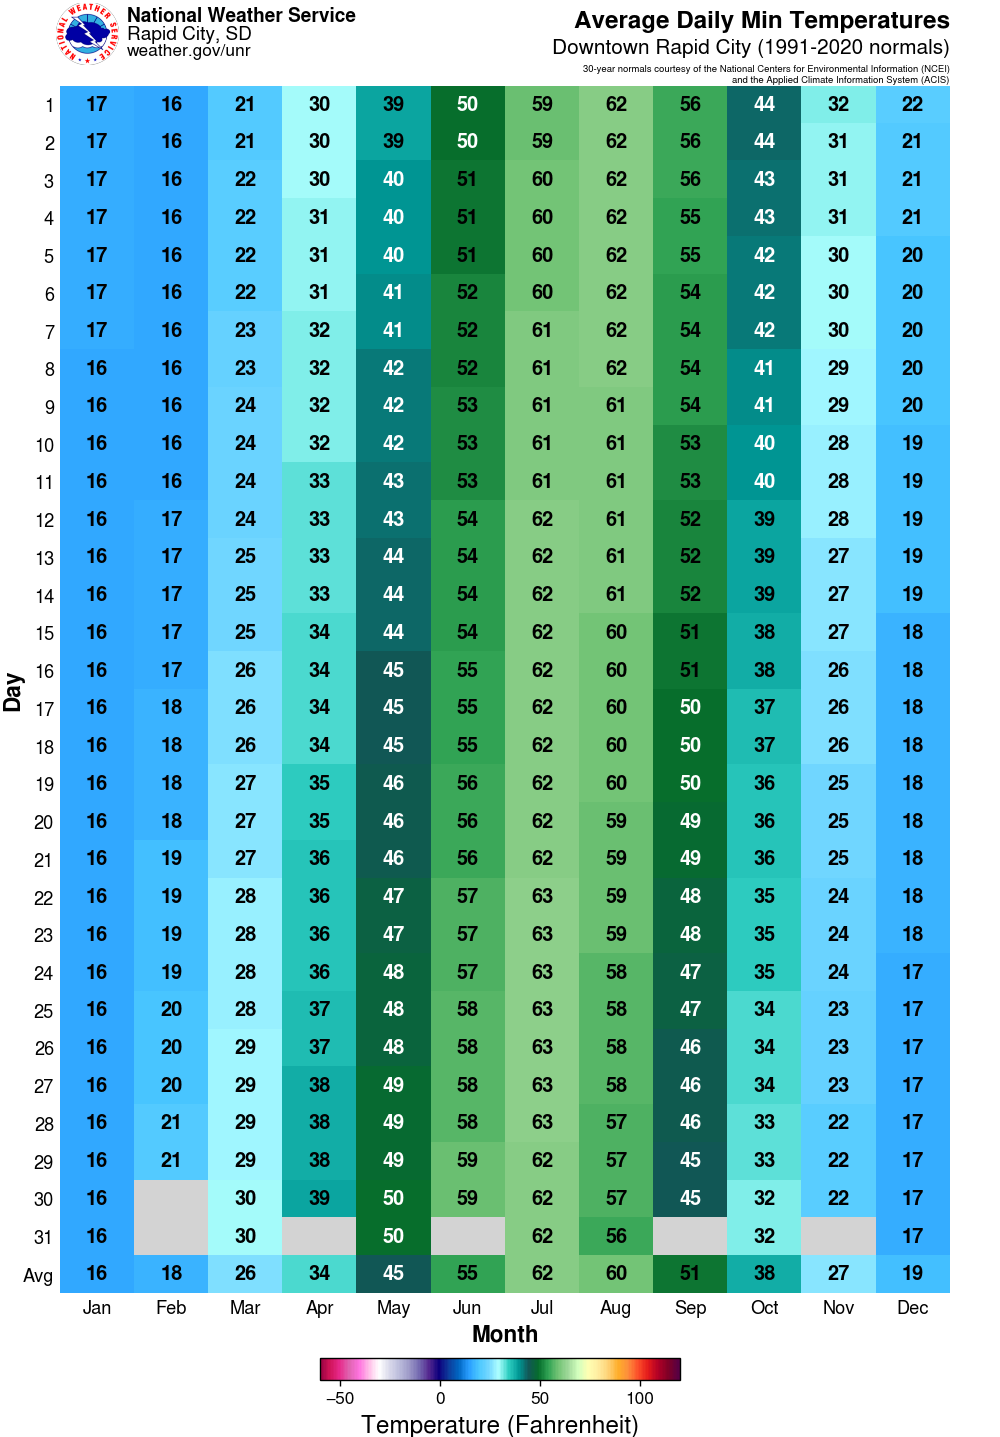
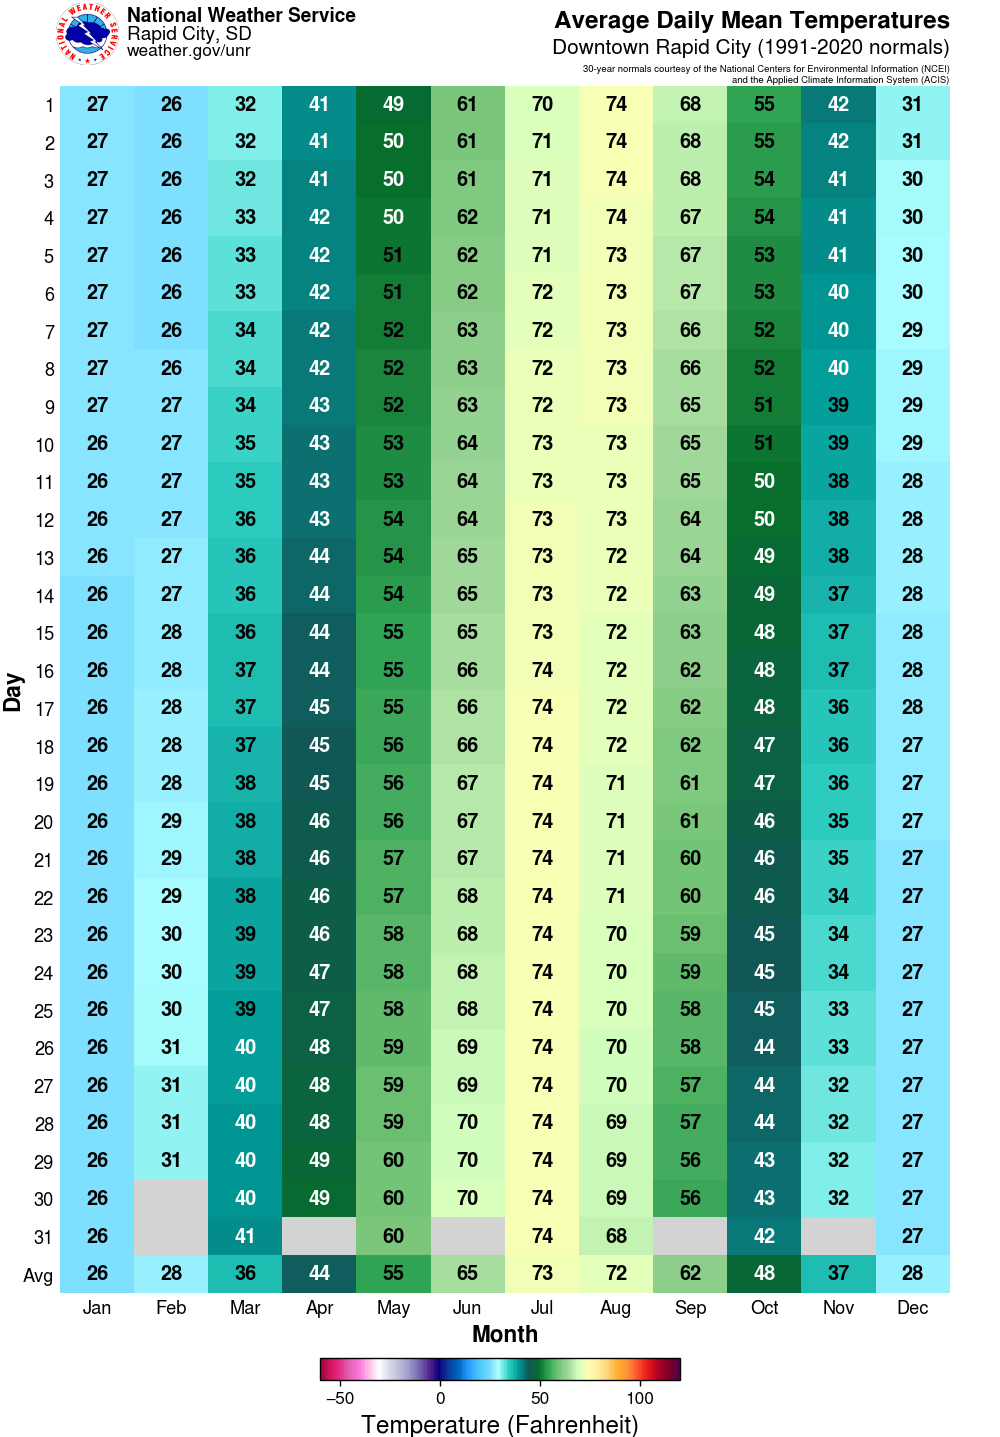
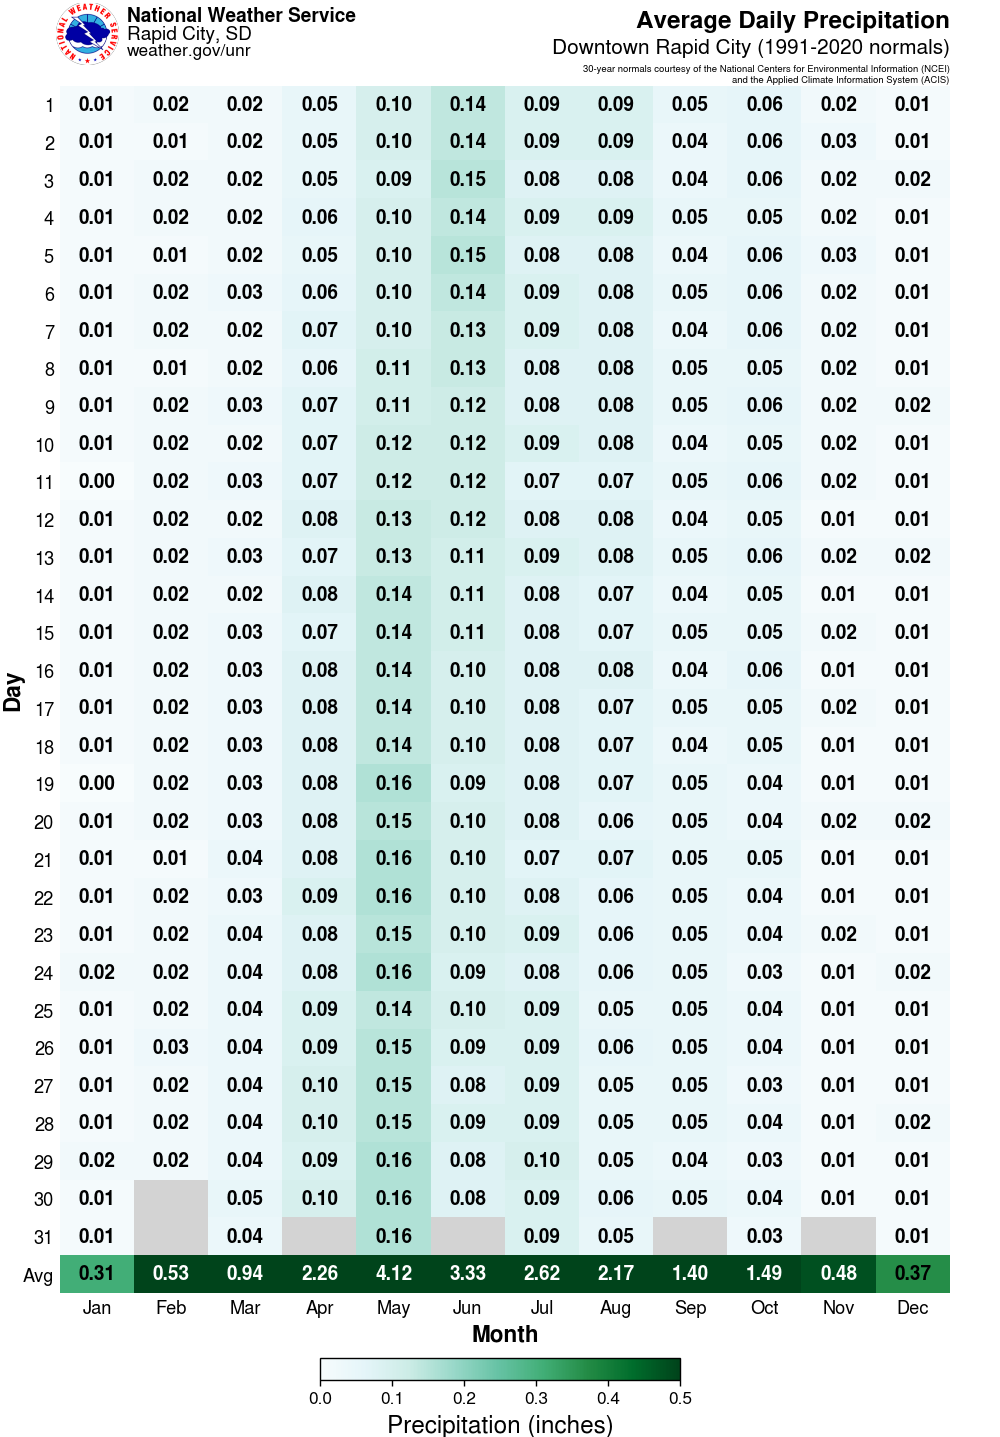
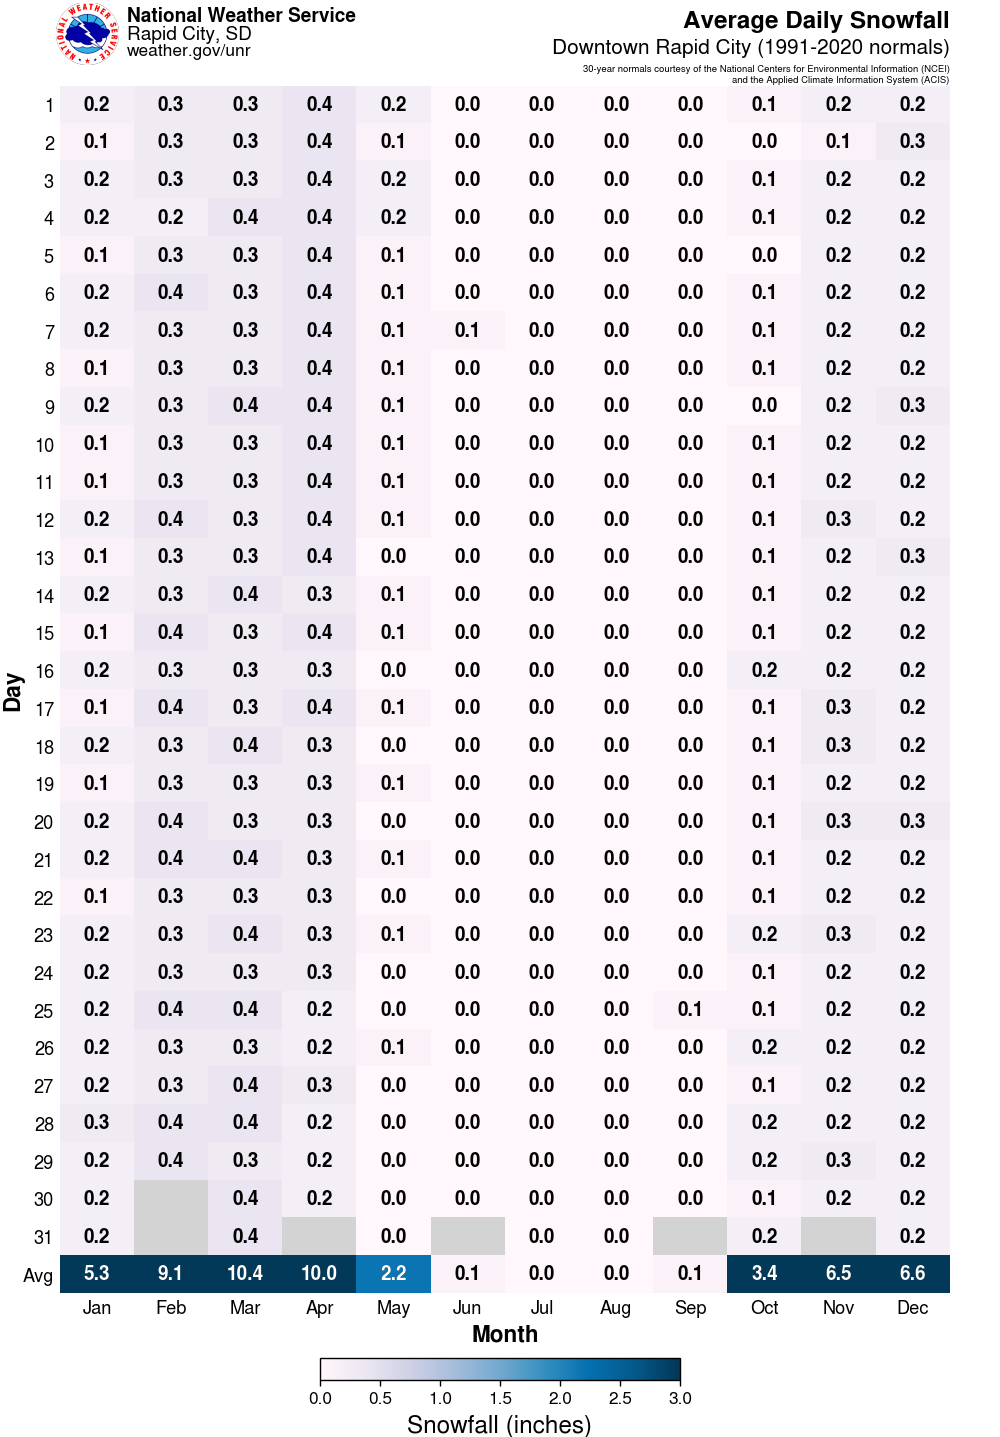
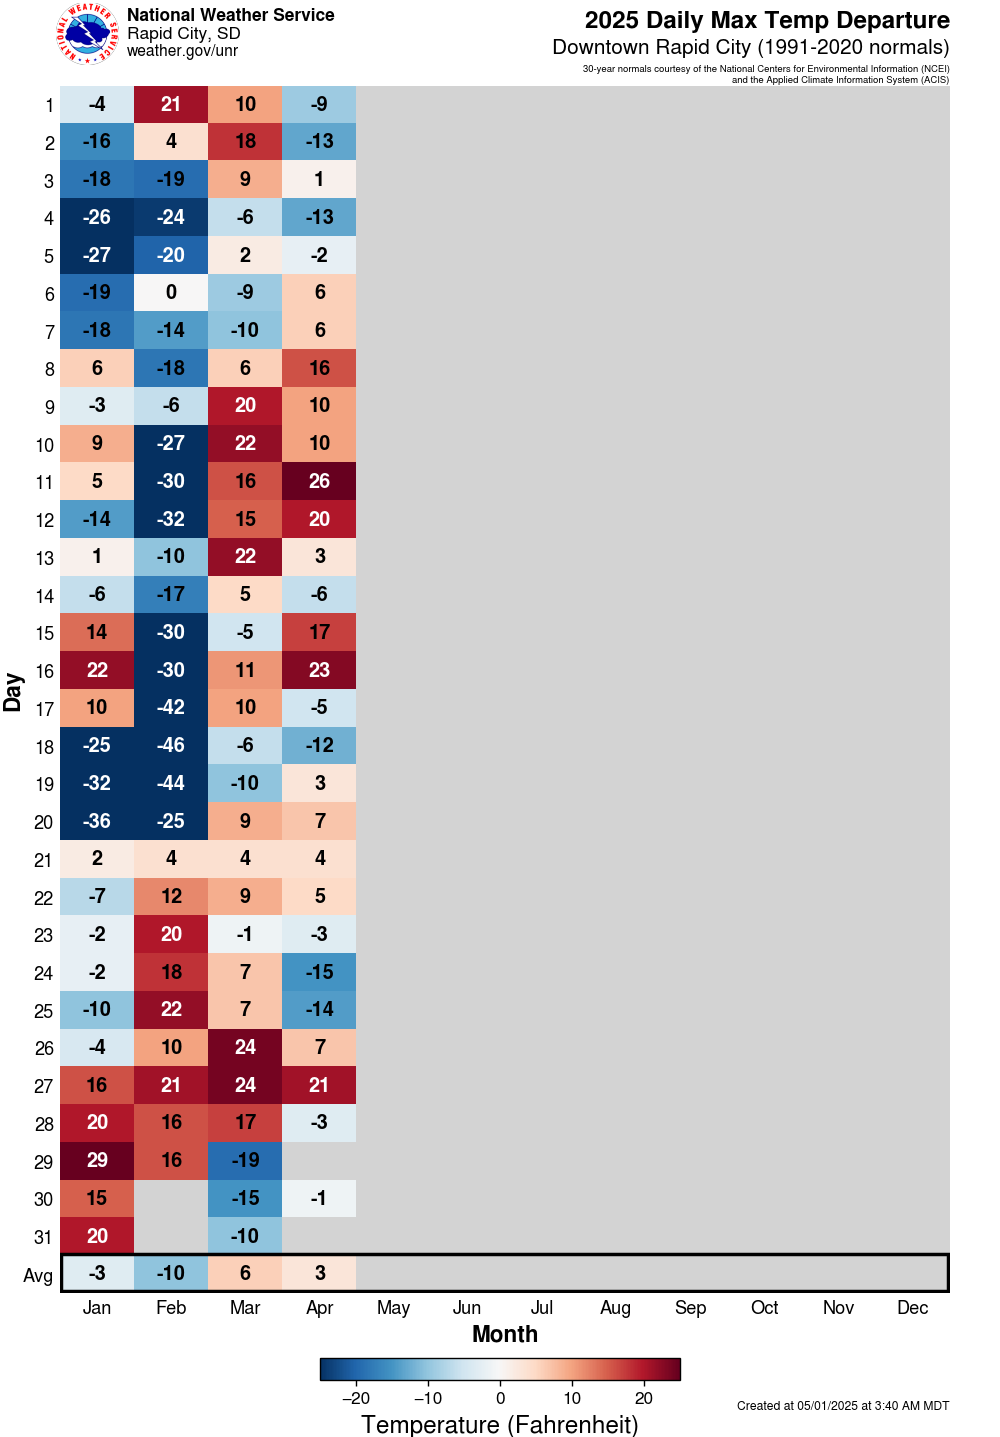
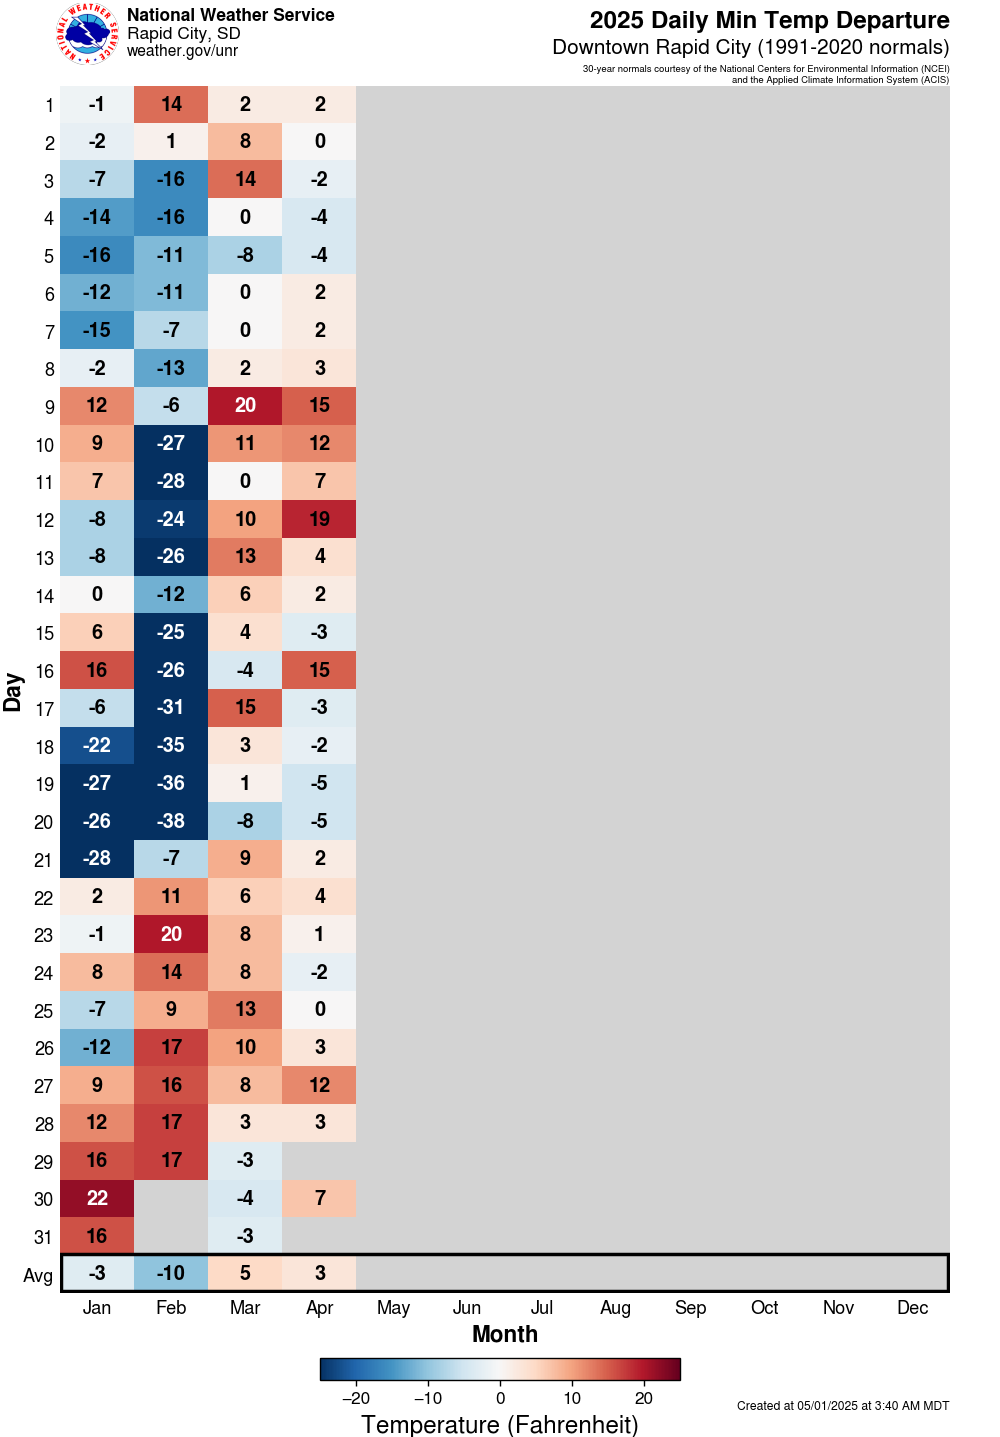
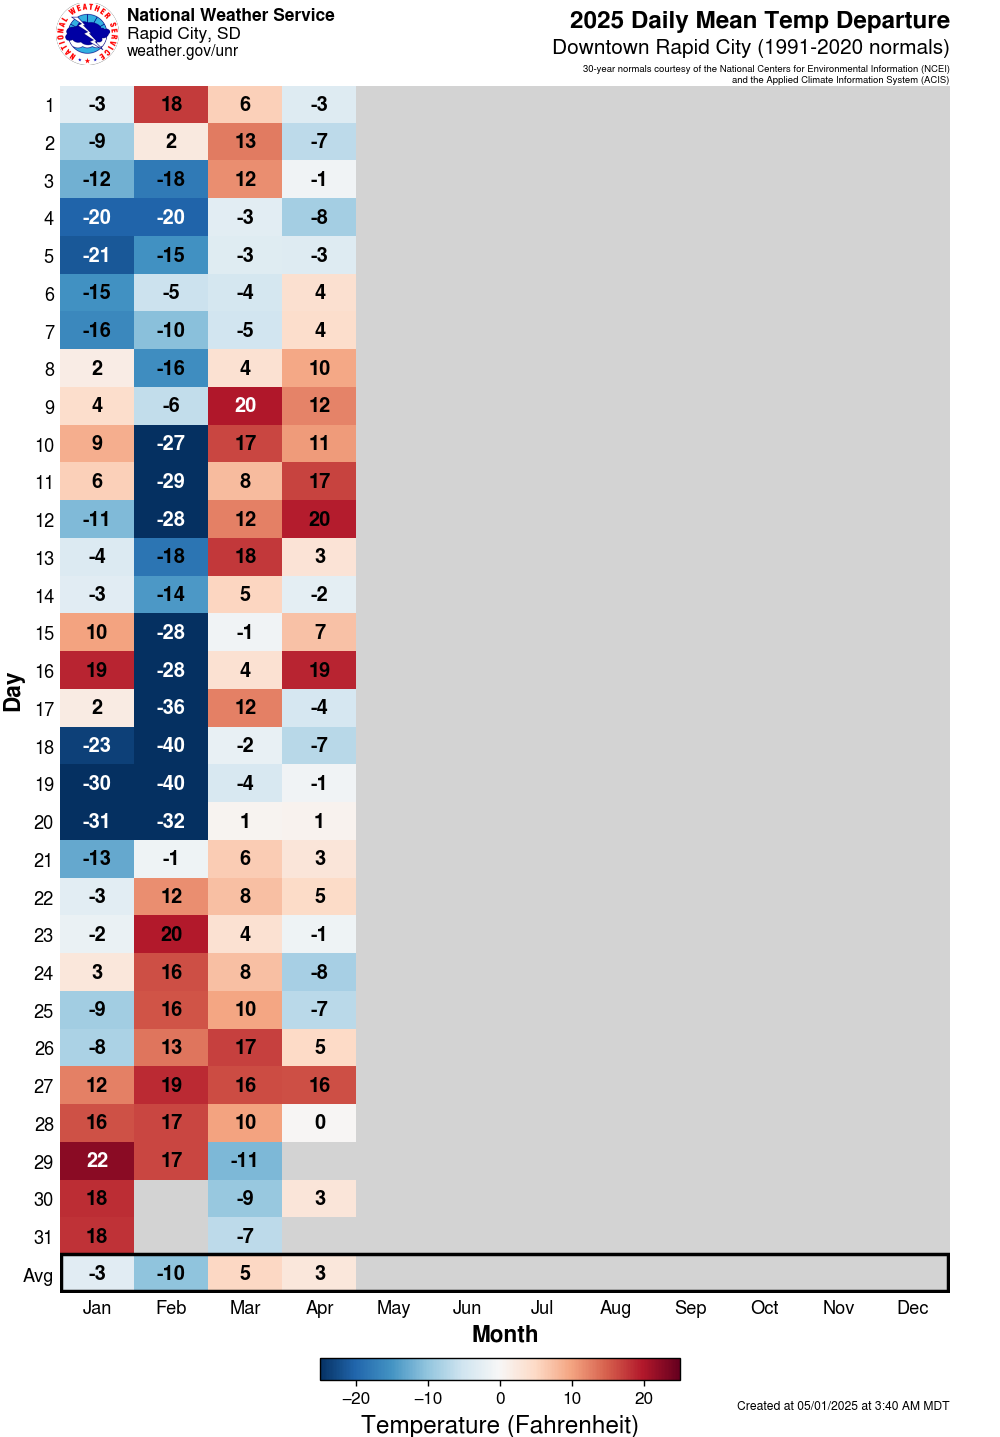
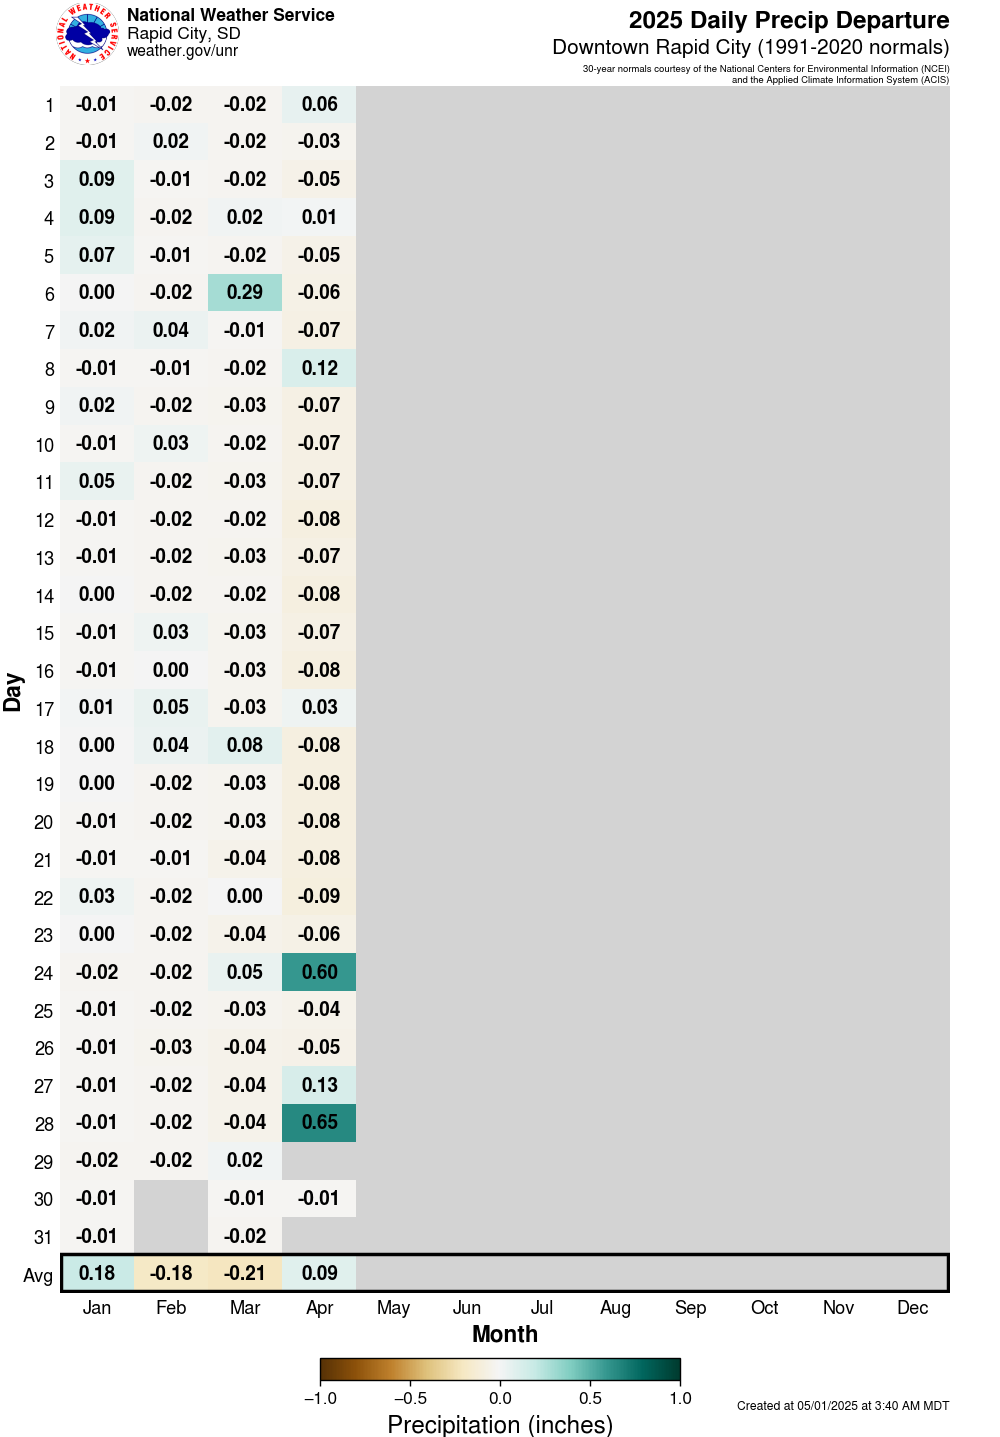
The following graphics show averages for temperatures, precipitation, and snowfall for each day of the year and each month at several observing sites across western South Dakota and northeastern Wyoming. Recently, year-to-date departures from these averages were also added.
Many of these sites are maintained by cooperative observers, a program which you can learn more about here. We are in the process of quality controlling past data, so some of these values are subject to change. To view the averages or departures, hover over a location on the left and choose the desired tab along the top of the page. 30-year averages are courtesy of the National Centers for Environmental Information (NCEI).
These values are traditionally referred to as climate "normals"; however, that does not imply that they are "usual". For example, an average high temperature of 70 degrees could be a result of several days with a high near 70°, or it could be a split of days with highs of 55° and 85°! ​