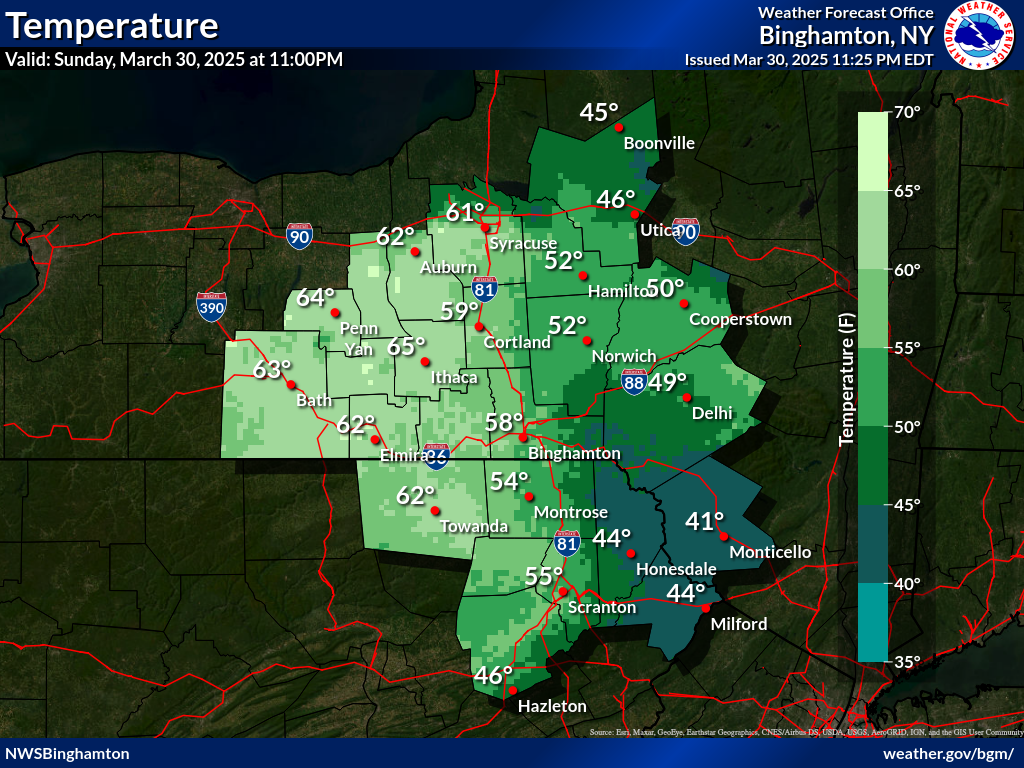
- Temperature - A measure of the warmth of the ambient air measured by a suitable instrument such as a thermometer.
- Dew Point (Dew-Point Temperature) - A measure of atmospheric moisture. The temperature to which air must be cooled, at constant pressure and moisture content, in order for saturation to occur. The higher the dew point, the greater amount of water vapor in the air mass.
- Wind - The horizontal motion of the air past a given point. Winds begin with differences in air pressures. Pressure that's higher at one place than another sets up a force pushing from the high toward the low pressure. The greater the difference in pressures, the stronger the force. The distance between the area of high pressure and the area of low pressure also determines how fast the moving air is accelerated. Meteorologists refer to the force that starts the wind flowing as the "pressure gradient force." High and low pressure are relative. There's no set number that divides high and low pressure. Wind is used to describe the prevailing direction from which the wind is blowing with the speed given usually in miles per hour or knots.
| Sustained Wind Speed |
Descriptive Term |
| 40 mph or greater |
Strong, dangerous, or damaging |
| 30-40 mph |
Very Windy |
| 20-30 mph |
Windy |
| 15-25 mph |
Breezy, Brisk, or Blustery |
| 5-15 mph or 10-20 mph |
None |
| 0-5 mph |
Light or light and variable wind |
- Relative Humidity - A dimensionless ratio, expressed in percent, of the amount of atmospheric moisture present relative to the amount that would be present if the air were saturated. Since the latter amount is dependent on temperature, relative humidity is a function of both moisture content and temperature. As such, relative humidity by itself does not directly indicate the actual amount of atmospheric moisture present.
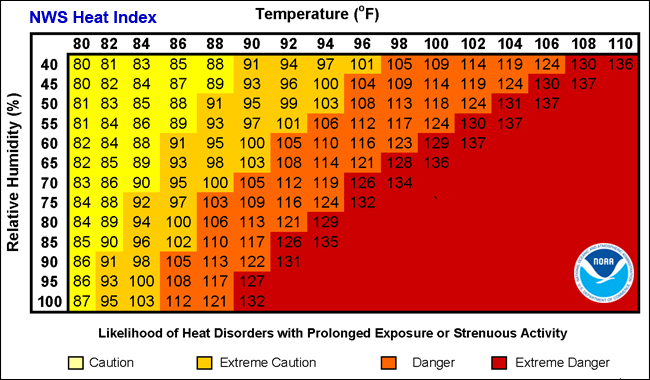
- Apparent Temperature - Heat Index - The apparent temperature is used to show heat index. Heat index is an accurate measure of how hot it really feels when the Relative Humidity (RH) is added to the actual air temperature. To find the Heat Index (HI), look at the Heat Index (HI) Chart. As an example, if the air temperature is 90°F (found at the left side of the table) and the Relative Humidity (RH) is 70% (found at the top of the table), the Heat Index (HI)--or how hot it actually feels--is 106°F. This is at the intersection of the row 90°F and the 70% column. This index was devised for shady, light wind conditions. Exposure to full sunshine can increase Heat Index (HI) values by up to 15°F. Also strong winds, particularly with very hot, dry air, can be extremely dangerous. Any value Heat Index (HI) greater than 105°F is in the Danger Category.
| Category |
Classification |
Heat Index/Apparent Temperature (°F) |
General Affect on People in High Risk Groups |
| IV |
Extremely Hot |
130°F or Higher |
Heat/Sunstroke HIGHLY LIKELY with continued exposure |
| III |
Very Hot |
105°F - 130°F |
Sunstroke, heat cramps, or heat exhaustion LIKELY, and heatstroke POSSIBLE with prolonged exposure and/or physical activity |
| II |
Hot |
90°F - 105°F |
Sunstroke, heat cramps, or heat exhaustion POSSIBLE with prolonged exposure and/or physical activity |
| I |
Very Warm |
80°F - 90°F |
Fatigue POSSIBLE with prolonged exposure and/or physical activity |
- Apparent Temperature - Wind Chill - The Apparent temperature is used to show wind chill. The wind chill temperature is based on the rate of heat loss from exposed skin caused by wind and cold and is to give you an approximation of how cold the air feels on your body. As the wind increases, it removes heat from the body, driving down skin temperature and eventually the internal body temperature. Therefore, the wind makes it FEEL much colder. If the temperature is 0°F and the wind is blowing at 15 mph, the wind chill temperature is -19°F. At this level, exposed skin can freeze in just a few minutes. The only effect wind chill has on inanimate objects, such as car radiators and water pipes, is to shorten the amount of time for the object to cool. The inanimate object will not cool below the actual air temperature. For example, if the temperature outside is -5°F and the wind chill temperature is -31°F, then your car's radiator temperature will be no lower than the air temperature of -5°F.
|


 Follow us on YouTube