| I. Introduction | |
| Westerly flow upslope snow events are one of the more challenging aspects of forecasting in Vermont. These are highly localized, possibly high impact events that affect the region. Upslope precipitation in general is produced by cool moist air being forced up the mountain slopes, and in this study, on northerly to westerly winds. Depending on the details of each event, impacts can range from only a few inches along the peaks of the Green Mountains to a highway-closing 1 to 3 foot snowstorm along the western slopes of the Green Mountains and even into the Champlain Valley. One of the main factors in these events is the terrain of Vermont, as shown in Figure 1. The Green Mountains, with peaks as high as 4395 feet (Mount Mansfield) run primarily north to south through the central portion of the state and are one of the main contributors to upslope snowfall in the state. But what makes one event high impact while others go unnoticed except to the ski resorts? | |
Click to enlarge  |
|
| II. Synoptic Weather Pattern | |
| The state of the atmosphere leading up to an upslope (orographic) snow event has been examined in previous studies, but can generally be characterized by an upper level trough or closed upper low moving through the region, typically with a vorticity maximum crossing the area (Figure 2). At the surface, a low pressure system is exiting the region, with increasing westerly to northerly flow in the low levels of the atmosphere (Figure 3). Figure 2 shows the composite 500 mb pattern of all upslope events between 2007 and 2012 (25 cases). Note the mean upper level trough across southeast Canada and into the Northeastern United States. Figure 3 shows the composite MSLP (Mean Sea Level Pressure) pattern. Note the closed surface low exiting the region through the Canadian Maritimes. This west to northwest flow in the low levels combined with lingering low and mid-level moisture leads to the development of upslope snow showers. It is at this point when it becomes critical how the mesoscale features develop with time. | |
Click to enlarge  |
Click to enlarge  |
| Why does one upslope event in one scenario bring heavy snow to the western slopes of the Green Mountains (Figure 4 from 7 December 2010), while in other events with similar synoptic patterns, the heaviest snows are less organized and the snow falls only in the mountains or well east of the spine (Figure 5 from 27 January 2010)? | |
Click to enlarge  |
Click to enlarge  |
| III. The Froude Number | |
| Differences in the amount and distribution of snowfall in upslope events can be partly attributed to the difference between "Blocked Upslope Flow" and "Unblocked Upslope Flow", which can be quantified by the Froude Number. The Froude Number is a number representing the flow of air when it comes in contact with a barrier, or in Vermont's case, the Green Mountains. The Green Mountains are oriented such that within only 15 miles, the elevations rise from around 300 feet in Burlington (KBTV) to nearly 4400 feet on Mount Mansfield. The mountains are aligned from north to south, such that it acts as a barrier for westerly (or easterly) flow. In general westerly flow, the Froude Number is an estimation of whether the flow can make it over the mountains and is basically a ratio of the wind perpendicular to the mountain chain versus the atmospheric stability (as measured by the potential temperature at the surface and at mountain top, see equation below). | |
Click to enlarge  |
|
Click to enlarge  If the Froude Number is low (< 1), it is called subcritical and is blocked (Figure 6). The air will not make it over the mountain and the precipitation will back up behind the barrier. If the Froude Number is high (> 1), it is supercritical and unblocked (Figure 6). The air will flow freely over the mountains and deposit the heaviest precipitation on the east side. A Froude Number near 1 is considered critical, and the heaviest precipitation will likely fall along the barrier. If the Froude Number is low (< 1), it is called subcritical and is blocked (Figure 6). The air will not make it over the mountain and the precipitation will back up behind the barrier. If the Froude Number is high (> 1), it is supercritical and unblocked (Figure 6). The air will flow freely over the mountains and deposit the heaviest precipitation on the east side. A Froude Number near 1 is considered critical, and the heaviest precipitation will likely fall along the barrier. |
|
| a. Characteristics of Blocked Events | |
Click to enlarge  Leading up to a "blocked event" there are several key features that have been identified in the North American Model (NAM) forecast soundings. In blocked events, NAM-forecast Froude Numbers have been shown to be less than 1. The vertical wind profile typically has a veering signature with generally west-northwest winds at the surface and turning to northwest at 4000 feet (or around mountain-top). One of the most important identifiable features is the presence of an inversion or isothermal layer near or below the mountain height level. Using the KBTV NAM sounding, the low levels are nearly saturated with a surface average relative humidity of 85-90% and a 925-850mb average of 95-100%. An example of a "blocked event" occurred on 7 December 2010 and the snowfall amounts can be seen in Figure 4, with the forecast sounding in Figure 7. A radar loop of another blocked event, the 28 December 2011 case can be seen in Figure 8, and is characteristic of most blocked event cases. Leading up to a "blocked event" there are several key features that have been identified in the North American Model (NAM) forecast soundings. In blocked events, NAM-forecast Froude Numbers have been shown to be less than 1. The vertical wind profile typically has a veering signature with generally west-northwest winds at the surface and turning to northwest at 4000 feet (or around mountain-top). One of the most important identifiable features is the presence of an inversion or isothermal layer near or below the mountain height level. Using the KBTV NAM sounding, the low levels are nearly saturated with a surface average relative humidity of 85-90% and a 925-850mb average of 95-100%. An example of a "blocked event" occurred on 7 December 2010 and the snowfall amounts can be seen in Figure 4, with the forecast sounding in Figure 7. A radar loop of another blocked event, the 28 December 2011 case can be seen in Figure 8, and is characteristic of most blocked event cases. |
|
Click to enlarge  |
|
| b. Characteristics of Unblocked Events | |
Click to enlarge  Similarly there are also several key features that have been identified in forecast soundings preceding an "unblocked event". NAM forecast Froude Numbers have been shown to be greater than 1, sometimes much greater (as high as 4), which indicate unblocked flow. The vertical wind profile typically lacks a veering signature with very little directional shear. The observed wind direction is generally west-northwest throughout the lowest 4000 feet. An inversion or isothermal layer is typically absent below 4000 feet and conditions are generally well-mixed in the lower levels. Compared to blocked cases, in the KBTV sounding, the low levels are not saturated with a surface average relative humidity of 80-85% and a 925-850mb average of 85-90%. An example of an "unblocked event" is the 27 January 2010 case and the snowfall amounts can be seen in Figure 5, with the forecast sounding in Figure 9. A mosaic 0.5° reflectivity loop of this case can be found here, and is characteristic of most unblocked event cases. Similarly there are also several key features that have been identified in forecast soundings preceding an "unblocked event". NAM forecast Froude Numbers have been shown to be greater than 1, sometimes much greater (as high as 4), which indicate unblocked flow. The vertical wind profile typically lacks a veering signature with very little directional shear. The observed wind direction is generally west-northwest throughout the lowest 4000 feet. An inversion or isothermal layer is typically absent below 4000 feet and conditions are generally well-mixed in the lower levels. Compared to blocked cases, in the KBTV sounding, the low levels are not saturated with a surface average relative humidity of 80-85% and a 925-850mb average of 85-90%. An example of an "unblocked event" is the 27 January 2010 case and the snowfall amounts can be seen in Figure 5, with the forecast sounding in Figure 9. A mosaic 0.5° reflectivity loop of this case can be found here, and is characteristic of most unblocked event cases. |
|
| c. Three Types of Upslope Events | |
Click to enlarge  This study has shown there are three main types of westerly flow upslope events, with very different snowfall distributions. The first type is "unblocked" where the Froude Number is above 1. In these cases, the spine of the Green Mountains and areas east such as Jay Peak, Waterbury, Stowe, and the Northeast Kingdom are favored for the greatest snowfall. This study has shown there are three main types of westerly flow upslope events, with very different snowfall distributions. The first type is "unblocked" where the Froude Number is above 1. In these cases, the spine of the Green Mountains and areas east such as Jay Peak, Waterbury, Stowe, and the Northeast Kingdom are favored for the greatest snowfall.As an example, Figure 11 shows the snowfall distribution for all events with Froude Numbers between 1.0 and 1.33. |
|
Click to enlarge  The second type is our classic western slopes upslope events where the spine of the Green Mountains and the western slope communities such as Underhill, Jericho, Richmond, Bolton, and South Lincoln are favored for heavy snowfall. This typically occurs when the Froude Number falls between 0.5 and 1.0. The second type is our classic western slopes upslope events where the spine of the Green Mountains and the western slope communities such as Underhill, Jericho, Richmond, Bolton, and South Lincoln are favored for heavy snowfall. This typically occurs when the Froude Number falls between 0.5 and 1.0.Figure 12 shows the snowfall distribution for all events with Froude Numbers between 0.85 and 0.99. |
|
Click to enlarge  Our third type is somewhat rarer, where the flow is strongly blocked and the heaviest precipitation backs up into the Champlain Valley. This occurs when the Froude Number is very low, generally less than 0.5. Our third type is somewhat rarer, where the flow is strongly blocked and the heaviest precipitation backs up into the Champlain Valley. This occurs when the Froude Number is very low, generally less than 0.5.Figure 13 shows the snowfall distribution for all events with Froude Numbers less than 0.25. |
|
| IV. Heavy Snow in Westerly Upslope Flow Scenarios | |
| This study has identified several favorable scenarios for heavy upslope snow in our three most impacted areas; the Champlain Valley (Burlington-Essex), the western slopes (Underhill-Richmond), and then east of the spine of the Green Mountains (Jay Peak-Stowe). See Table 1 below for each scenario. | |
Click to enlarge  |
|
| Examples of each scenario can be seen below in Figures 14a and 14b for the Champlain Valley, 15a and 15b for the western slopes, and 16a and 16b for the eastern slopes. | |
Click to enlarge  |
Click to enlarge  |
Click to enlarge  |
Click to enlarge  |
Click to enlarge  |
Click to enlarge  |
| V. Snow Ratios | |
| One other important factor that goes into forecasting snowfall amounts is snow ratios, or the amount of snow that falls given an amount of liquid water. High snow ratios indicate low liquid water content snow, or dry "fluffy" snow. Low snow ratios indicate high liquid water content snow or a "wet" snow. It has been shown in the study that snowfall ratios during upslope events are considerably higher than in synoptic events, such as from a nor'easter. The average snow ratio during all upslope events from 2007-2012 was 28:1, with an average 850 mb temperature of -13 degrees Celsius. 850 mb temperatures and snow ratios show good correlation in these upslope events, and can be seen in Table 2 below. | |
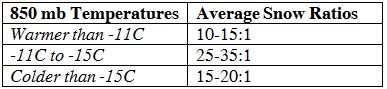 Table 2. Average Snow ratios during 25 upslope events from 2007-2012. |
|
| VI. Conclusion | |
| Westerly flow upslope snow events are one of the more challenging aspects of winter forecasting in Vermont. These are highly localized, possibly high impact events that affect the region. Examining cases from the years 2007-2012, the Froude Number has been identified as serving an important role in distinguishing between high impact heavy snow events and more ordinary and lighter upslope snowfall. It can also be used to forecast the snowfall distribution and location of the greatest expected amounts. This study has also shown what wind, temperature, and moisture profiles are associated with these events. | |

