 Email the authors
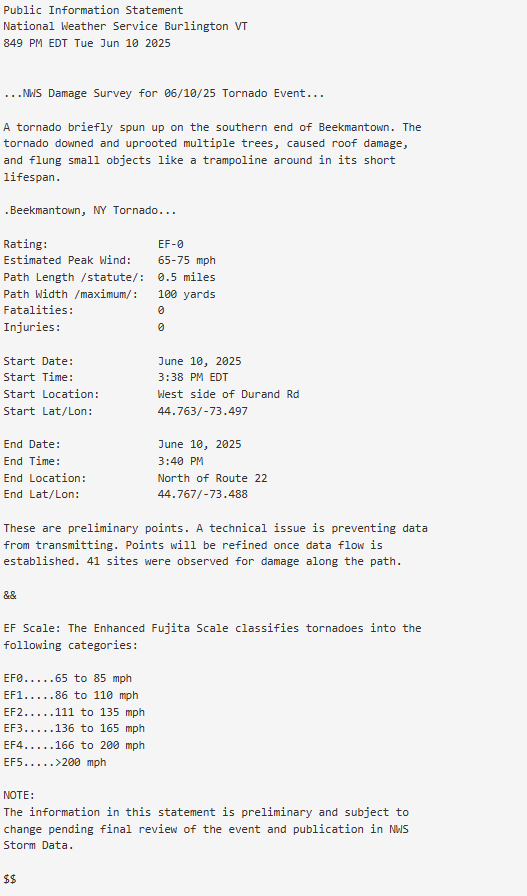
On 10 June 2025 at approximately 3:38 PM EDT, a weak tornado touched down near the southern end of Beekmantown, New York. The tornado downed and uprooted multiple trees, caused roof damage, and flung small objects - including a trampoline - as it moved generally in an east-northeastward direction. A post-event damage survey conducted by the National Weather Service (NWS) Forecast Office in Burlington, Vermont determined that the path length of the tornado was approximately one-half mile and the maximum width of the tornado reached 100 yards. This brief and small circulation was extremely difficult for highly trained NWS meteorologists to warn for, as the rotation only lasted for two volume scans, before weakening.
The tornado began on the west side of Durand Road, and tracked generally east-northeast before dissipating just north of State Route 22 (see Figure 1). Based on the path length and speed of movement of the parent thunderstorm, the tornado is estimated to have been on the ground for roughly 2 minutes between 3:38 - 3:40 PM EDT. The damage caused by the tornado was consistent with peak winds of 65-75 mph, rating this an EF-0 tornado on the Enhanced Fujita (or EF) Scale. Fortunately, no injuries or fatalities were reported. The Public Information Statement associated with this tornado is available here. This was the first confirmed tornado in Clinton county New York in over 20 years, with the last one occurring on 8 July 2004 when a F0 tornado struck the town of Mooers.
The purpose of this writeup is to document the meteorological conditions and near-storm environment leading up to the tornado, as well as to document the dual-pol radar attributes associated with the parent thunderstorm and associated mesocyclone. The remainder of this document is organized as follows. Section 2 documents the pre-storm environmental conditions on the synoptic and mesoscale. Section 3 provides a review of the WSR-88D radar data available from Burlington, Vermont (KCXX). Section 4 offers some concluding thoughts and photographs taken during and following the tornado.
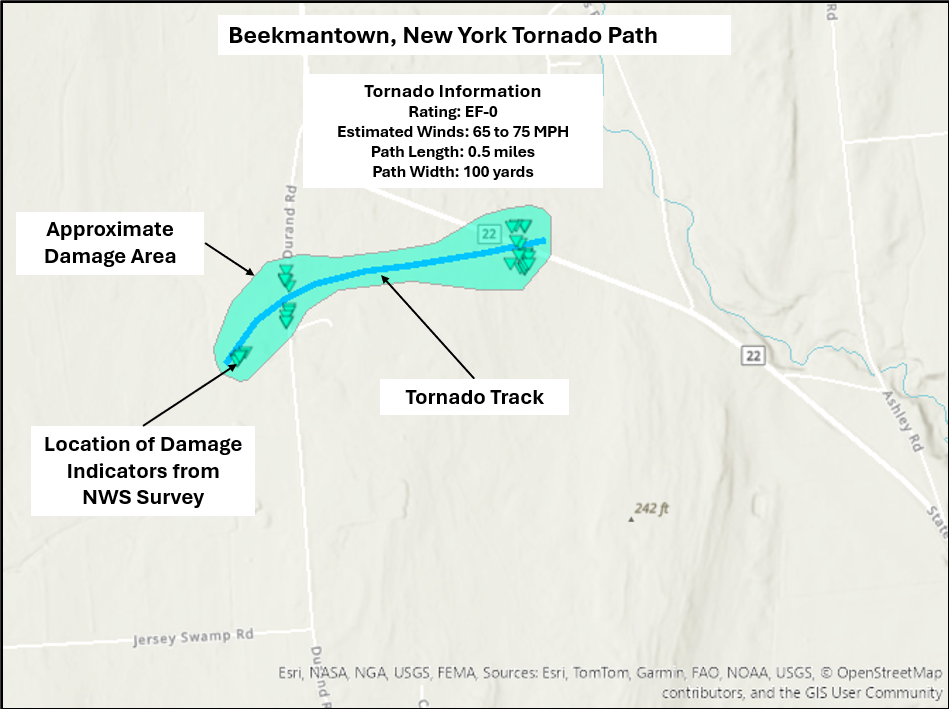
Figure 1: The 10 June 2025 Beekmantown, New York tornado path and damage locations, as documented during a post-storm damage survey and via the Damage Assessment Toolkit (DAT).[click to enlarge]
The pre-storm environmental conditions on 10 June 2025 featured strong deep-layer shear, but relatively modest instability values, as clouds and rain showers over the region during the first half of the day minimized surface heating. As the morning clouds and rain exited, a narrow instability axis was able to develop. Temperatures warmed into the upper 60s to lower 70s with surface dewpoints in the lower 60s contributing to surface-based CAPE values in the 800-1200 J/kg range. Given the developing modest instability, the Storm Prediction Center (SPC) placed the eastern Adirondacks and most of Vermont into a marginal risk for severe thunderstorms.
Figure 2 shows the 1230 PM EDT (1630 UTC) SPC Day 1 categorical outlook (left panel) and Day 1 probabilistic wind (middle panel), and probabilistic hail (right panel). A marginal risk implies areas of severe storms of either limited organization and longevity, or very low coverage and marginal intensity. The wind probability in the Day 1 convective outlook indicated at 5% area, which suggests the chance that the given type of severe weather (tornado, hail, or damaging thunderstorm wind) will happen within about 25 miles of a point. Note the hail probability was mostly confined to southern and eastern Vermont.
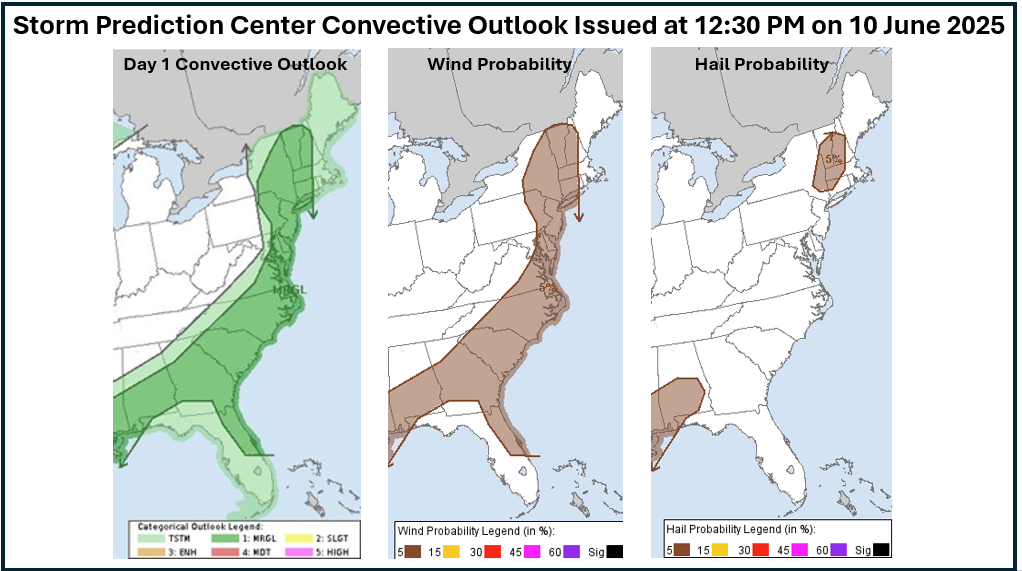
Figure 2: The Storm Prediction Center (SPC) Day 1 categorical outlook (left) and SPC Wind (middle) and Hail (right) Outlooks issued at 12:30 PM EDT 10 June 2025.[click to enlarge]
The 500 hPa (20,000 feet above ground level) showed a deep closed trough across the northern Great Lakes, with a ribbon of enhanced winds greater than 50 knots lifting from the Tennessee Valley into the northeast United States, on 10 June 2025 at 8 AM EDT (Figure 3). In addition, the image shows a potent shortwave trough across the eastern Great Lakes, which moved into the Saint Lawrence Valley by 11 AM EDT and slowly toward the Champlain Valley by 5 PM EDT. This shortwave and classic upper level divergent pattern, helped to produce large-scale lift for thunderstorm development, while the stronger winds aloft enhanced the deep-layer shear to support a threat for organization convection.
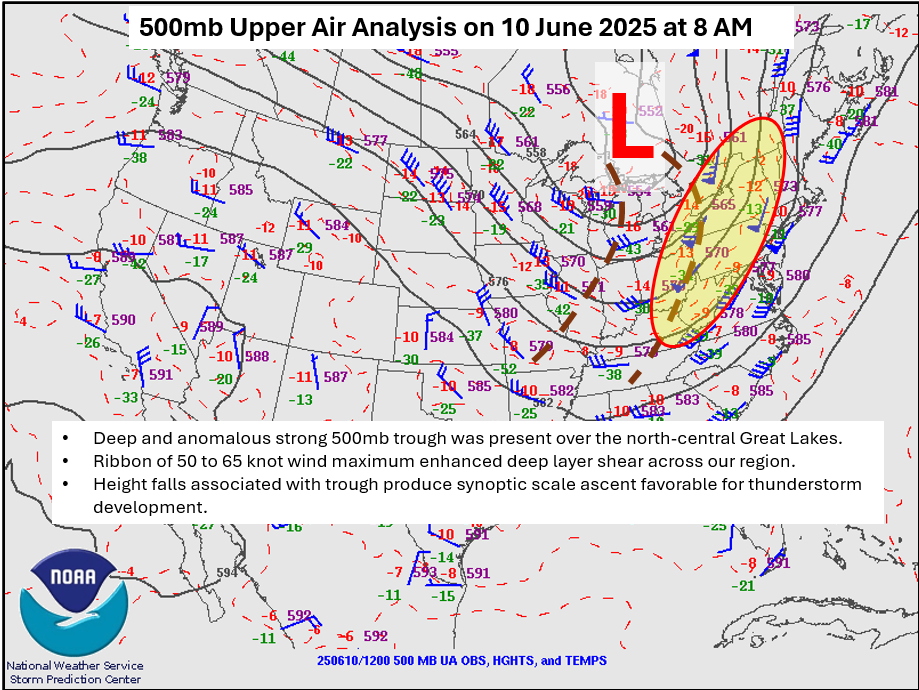
Figure 3: The 500 hPa (20,000 feet above ground level) upper air analysis on 10 June 2025 at 8 AM EDT. Displayed are wind barbs (plotted in blue, 1 arrow=50 knots, 1 barb=10 knots, 1/2 barb=5 knots), 500 hPa heights (decameters, black lines), and temperatures (Celius, dotted red).[click to enlarge]
In addition to a potent shortwave trough, a surface cold front/occlusion boundary with a triple-point low was located over northern New York at 2 PM EDT (Figure 4). The wind direction behind this boundary was from the west-southwest, while a lake breeze boundary from near Beekmantown to Plattsburgh was producing southeast winds along and east of the boundary. These sharply turning low-level winds locally enhanced low-level storm relative helicity in the area, while dynamics and stronger winds aloft produced favorable lift for showers and thunderstorm development. Within this area of convergence and updraft interaction a weak EF-0 tornado developed just south of Beekmantown at approximately 3:38 PM EDT on 10 June 2025. Surface temperatures were only in the upper 60s to lower 70s ahead of the approaching cold front as clouds and earlier rain showers minimized surface heating and instability for robust thunderstorm development. Figure 4 shows the surface analysis evolution at 2 PM EDT (left panel) and 5 PM EDT (right panel) on June 10th.
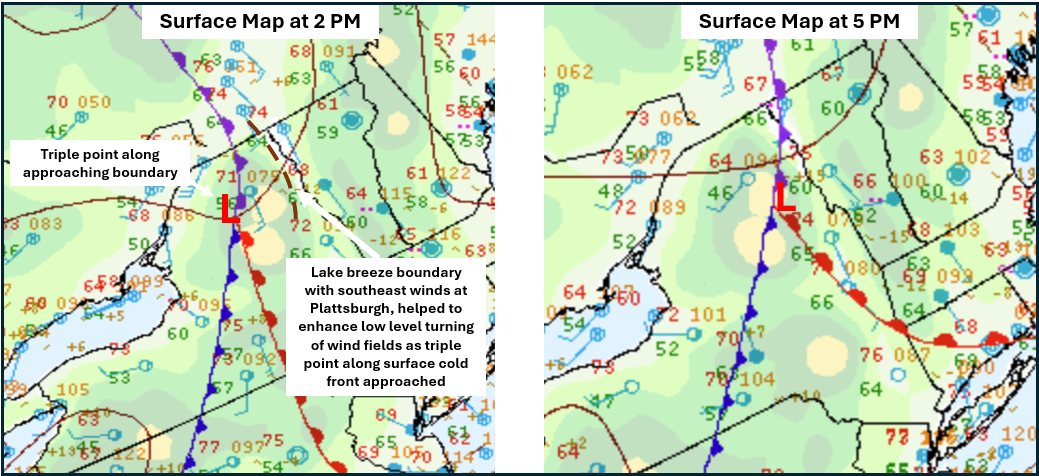
Figure 4: Surface map at 2:00 PM EDT (left) and 5:00 PM EDT (right) on 10 June 2025. [click to enlarge]
The thunderstorm that produced the tornado was part of a low top bowing line segment with a northern bookend vortex, which was where the EF-0 tornado was located. The thunderstorm top was only up to 28,000 feet and produced minimal lightning during its lifecycle.
The GOES-19 Day Cloud Phase product loop from 3 PM to 5 PM EDT on the 10th showed a broken line of developing cumulus clouds along the surface cold front (Figure 5). The deep dry air aloft and weak instability limited the vertical growth and areal coverage of the convection, with the Geostationary Lightning Mapper (GLM) product indicating widely scattered lightning activity. The two strongest cells based on the cloud structure and lightning observed were the Beekmantown tornadic storm and another cell near Ticonderoga, New York in the southern Champlain Valley. Also, note the southeast winds at Plattsburgh, NY prior to the convective cloud line, switching to westerly once the line passes toward the end of the loop.
Figure 5: GOES-19 Day Cloud Phase with station plots and GOES Geostationary Lightning Mapper (GLM) flashes from 3:00 PM to 5:00 PM EDT on 10 June 2025. [click to enlarge]
Next, we will discuss thermodynamic and environmental wind conditions ahead of the approaching cold front and examine what parameters were favorable for a brief tornadic thunderstorm to occur. Figure 6 shows the NAM3KM forecast sounding near Beekmantown, New York on 10 June 2025 at 3:00 PM EDT. This sounding indicated progged surface temperatures were expected to be 74°F, while the dewpoint temperature was 68°F, creating a Mean Layer Convective Available Potential Energy (MLCAPE) of 1310 J/kg. The MLCAPE was probably overdone by 200 to 400 J/kg, as surface dewpoints at Plattsburgh were only 64°F during the event. Note the southeast winds near the surface of 10 to 20 knots associated with lake breeze, which quickly shifted to the southwest to west and increased 25 to 35 knots through 700 hPa. This changing wind direction and speed with height produced favorable low-level shear profiles to support a tornadic thunderstorm.
The 0-to-1-km Storm Relative Helicity (SRH) was 85 m2s-2, while the surface to 6-km bulk shear was 54 knots, which is very strong and driven by progged 500 hPa winds of 60 to 65 knots. Per SPC, “larger values of 0-3-km SRH (greater than 250 m2 s-2) and 0-1-km SRH (greater than 100 m2 s-2), do suggest an increased threat of tornadoes. For SRH, larger values are generally better, but there are no clear thresholds between non-tornadic and significant tornadic supercells”. Another parameter that was favorable for potential tornadic development was a low Lifted Condensation Level (LCL) of 500 meters (or 1640 feet) above ground level. The LCL is the level at which a parcel becomes saturated and it is a reasonable estimate of cloud base height when parcels experience forced ascent. Typically the closer the cloud bases are to the ground, the higher the probability a condensation funnel can reach the surface and form a tornado. Another interesting aspect from this progged sounding near Beekmantown, NY was that the potential hazard type via the N-SHARP algorithm was “tornado” (Figure 6).
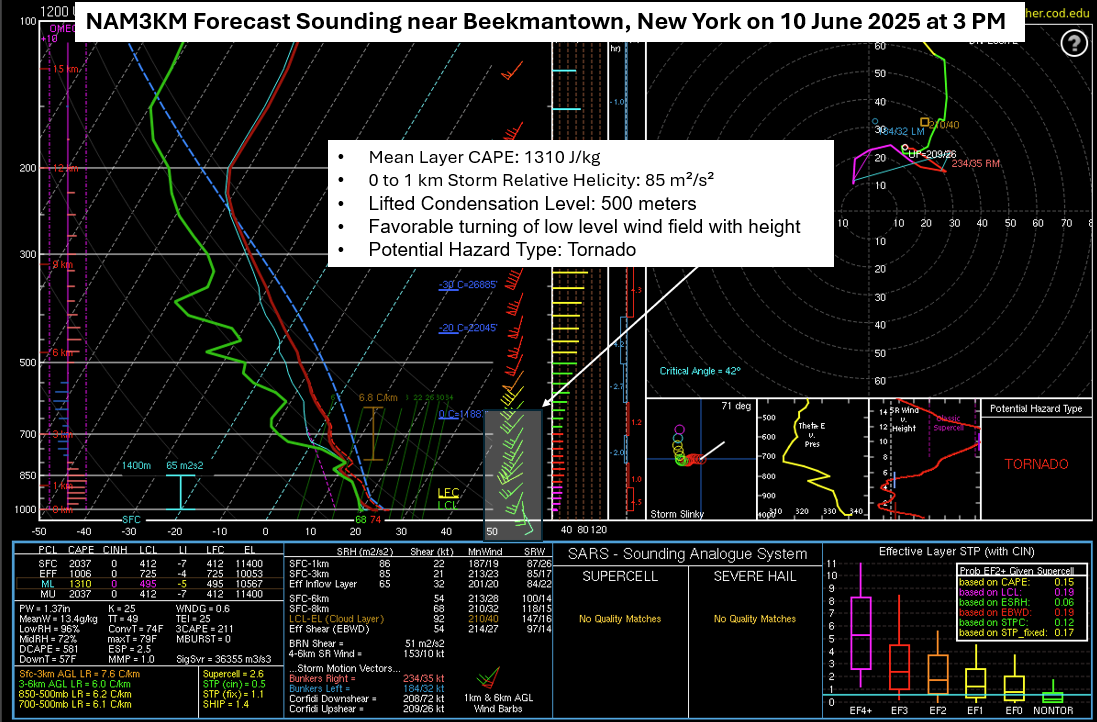
Figure 6: NAM3KM forecast sounding near Beekmantown, New York initialized at 8:00 AM and valid for 3:00 PM EDT on 10 June 2025. [click to enlarge]
In this section we will interrogate the radar data associated with the tornadic thunderstorm near Beekmantown, New York. The reflectivity structure was classified as a bowing line segment with a northern bookend vortex, where the tornado occurred per video and NWS damage survey. The embedded tornado was short-lived (2 minutes based on the NWS storm survey), which makes it nearly impossible to detect by the WSR-88D as the update time between base reflectivity and velocity data is roughly 3 minutes between low-level scans when Supplemental Adaptive Intra-Volume Low-Level Scan (SAILS) is used. In addition, the bowing segment was moving perpendicular to the radial beam, resulting in an underestimation of the velocity sampling from the KCXX radar. The overall reflectivity structure was only up to 28,000 feet above ground level, indicating relatively low topped convection with limited instability. Figure 7 shows the KCXX 0.8° base reflectivity (left image) and storm relative motion (right image) at 3:42 PM EDT, near the time of the tornado touch down. The weak reflectivity echo channel on backside, suggests a descending rear inflow jet, helping to enhance a cyclonic circulation on the northern bookend vortex, as it wraps back westward into the storm. This created a brief rotational velocity couplet of 42 knots inbound winds and 30 knots outbound at 2000 feet above ground level, suggesting a moderate mesocyclone was present within the northern bookend vortex, which is where the tornado occurred. The gusty southwest winds aloft with the modest instability, helped to create a strongly tilted storm updraft in a northerly direction. The strong shear quickly weakened the circulation and the tornado dissipated after being on the ground for just a couple of minutes. These brief and small circulations are extremely difficult for highly trained NWS meteorologists to warn for, as they typically only last for a volume scan or two, before weakening.
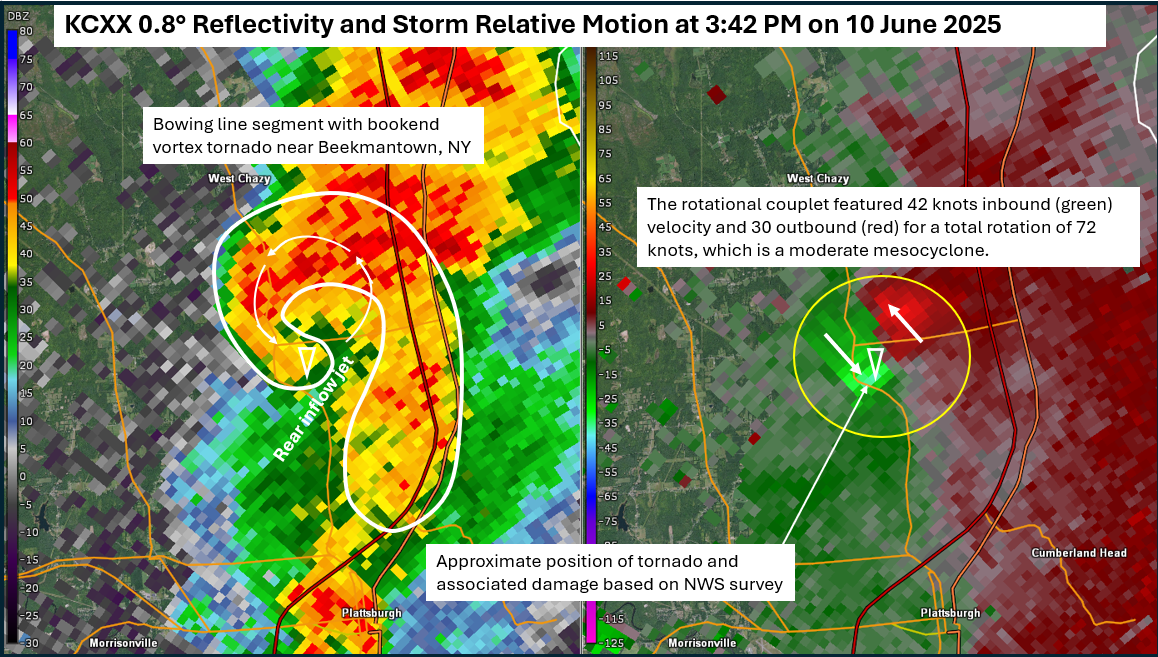
Figure 7.Figure 7: KCXX 0.8° base reflectivity and storm relative motion at 3:42 PM EDT on 10 June 2025. [click to enlarge]
The KCXX 4-panel shows additional radar products used by NWS warning meteorologists to help determine if a thunderstorm is capable of producing a tornado (Figure 8). In this event, the correlation coefficient (CC) (upper left panel in Figure 8), highlighted the location of a tornado debris signature (TDS). A significant drop in CC was present on KCXX radar with values < 80, indicating a TDS, which was co-located within the moderate rotational signature (velocity couplet). The TDS essentially identifies areas of high reflectivity where debris is being lofted into the air by a tornado. This product measures the consistency of radar signals from targets. A high CC (e.g., above 0.8) suggests similar shapes and sizes, which are typically found with meteorological targets like rain or hail. A low CC (e.g., below 0.8) indicates a high variability in shapes and sizes, often associated with non-meteorological objects like various types of debris lofted by a tornado. When a tornado is on the ground, it lifts debris, which causes a significant drop in the CC value. This drop is often accompanied by a hook-shaped echo on reflectivity radar and a tight rotational signature (velocity couplet) in the velocity data.
As previously mentioned, in this event the storm relative motion (SRM) velocity data (upper right panel in Figure 8) shows a rotational velocity couplet of 42 knots inbound and 30 knots outbound. This tight rotational signature matches up with the drop in CC values and higher SW values, making for a clear TDS. Additionally, the Probability of Tornado Debris Signature (PTDS) briefly reached 100% for one volume scan at 3:42 PM EDT (bottom left panel in Figure 8) before quickly dissipating, increasing the confidence this thunderstorm was producing a tornado. This quickly developing and short-lived circulation was extremely difficult for NWS warning meteorologists to issue a potential tornado warning for, because the next volume scan showed a much weaker and already dissipating circulation.
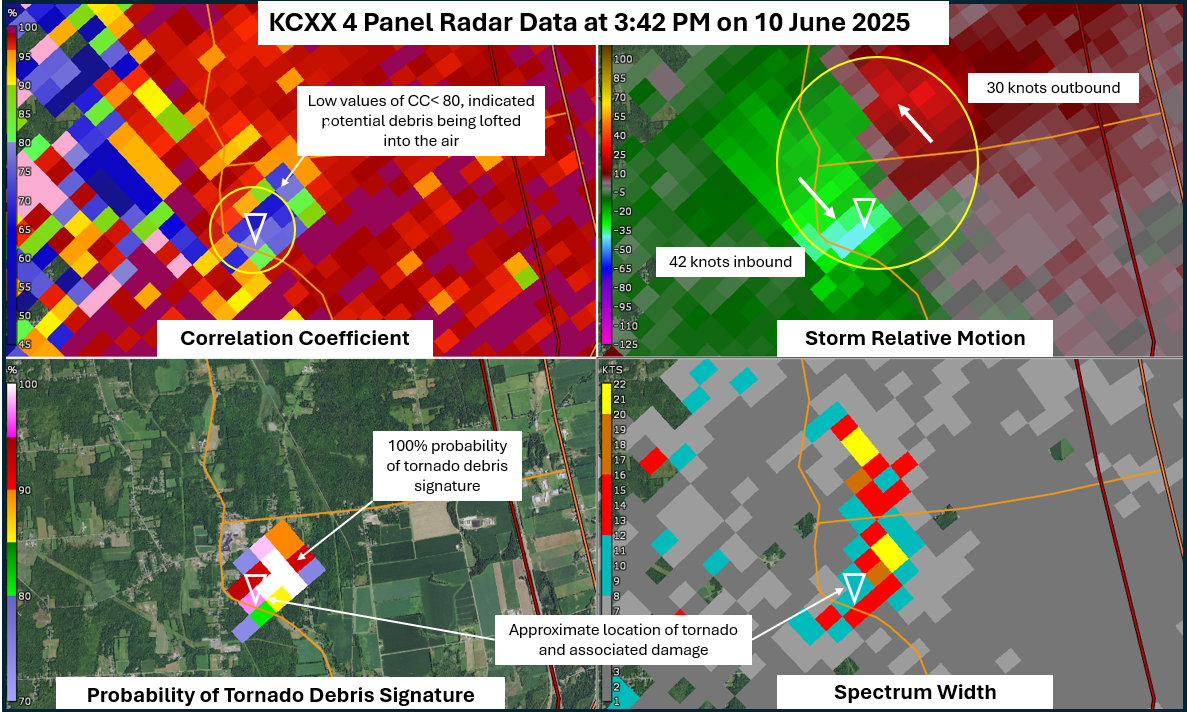
Figure 8. KCXX 0.8° Correlation Coefficient (CC) (upper left image), Storm Relative Motion (SRM, in knots) (upper right image), Probability of Tornado Debris Signature (PTDS, in percent) (lower left image), and Spectrum Width (SW, in knots) at 3:42 PM EDT on 10 June 2025. [click to enlarge]
The Multi-Radar Multi-Sensor (MRMS) Low Level Rotational Velocity (Figure 9) at 3:42 PM EDT shows the brief rotation associated with the Beekmantown, NY tornado. The MRMS Low Level Rotational Velocity product highlights circulations and areas of horizontal shear between 0-km and 2-km above ground level, which aids in identifying mesocyclones and/or tornadoes. In this event, one feature of note is that the areas of maximum rotation are displaced to the north of the confirmed tornado track due to strong southwesterly winds aloft; the condensation funnel and associated low-level mesocyclone exhibited a northwestward tilt.
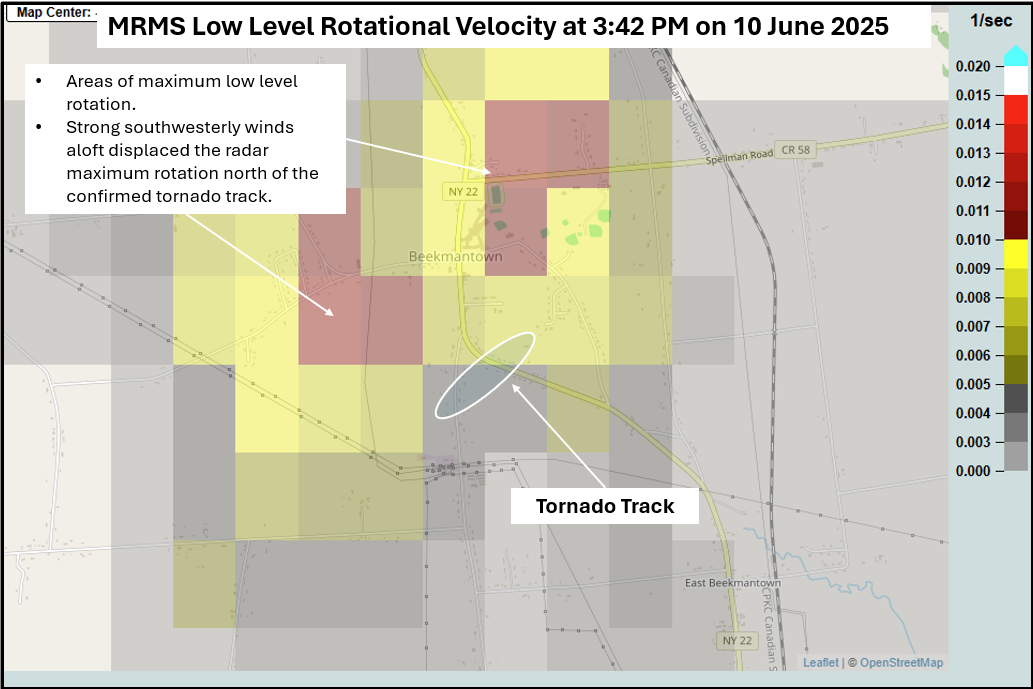
Figure 9: Multiple Radar Multiple Sensor (MRMS) low level rotational velocity at 3:42 PM EDT on 10 June 2025. [click to enlarge]
Tornadoes are relatively rare phenomena across northern New York and Vermont, with an average annual rate of occurrence since 1950 of only ~0.9 tornadoes per year (LaRocca 2016). With that said, the events of 10 June 2025 reveal how meteorological conditions on a variety of scales can come together, albeit briefly, to be favorable for tornadoes in the NWS Burlington county warning area. The interaction between the lake breeze from Lake Champlain and the triple-point low at the intersection of low-level frontal features likely bolstered the convective organization and intensity for a brief time in the vicinity of Beekmantown, New York, with sufficient instability and a favorable low-level wind profile for a tornado lasting roughly 2 minutes. A few hours of insolational heating between departing morning cloudiness and showers and an approaching frontal zone allowed for a narrow axis of surface-based instability (CAPE) to support severe thunderstorm potential. Convective storms promptly decreased in intensity as they crossed Lake Champlain and moved into Vermont after 4 PM EDT. Interestingly, the isolated thunderstorm in the Beekmantown area was the only storm along the frontal boundary to reach severe weather thresholds. Also, this EF-0 tornado was the only severe weather reported at all in the entire Northeastern United States (within a 700+ miles radius) on 10 June 2025.
A photograph of the tornado is provided in Figure 10, revealing a somewhat ragged condensation funnel and general low-level of the cloud bases associated with the parent thunderstorm on this day. Lastly, resultant tree and fence damage can be seen in a separate photo provided to NWS Burlington (Figure 11).
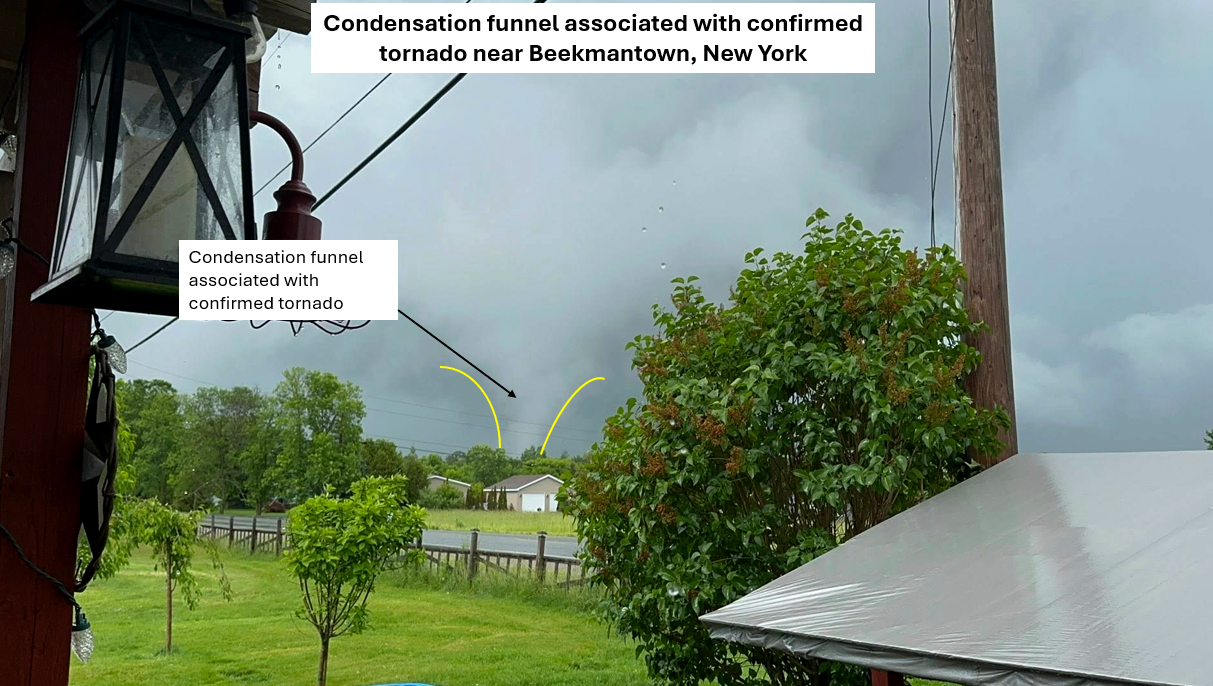
Figure 10: Condensation funnel associated with confirmed tornado near Beekmantown, New York on 10 June 2025. Photo courtesy of Debra Laplant.[click to enlarge]
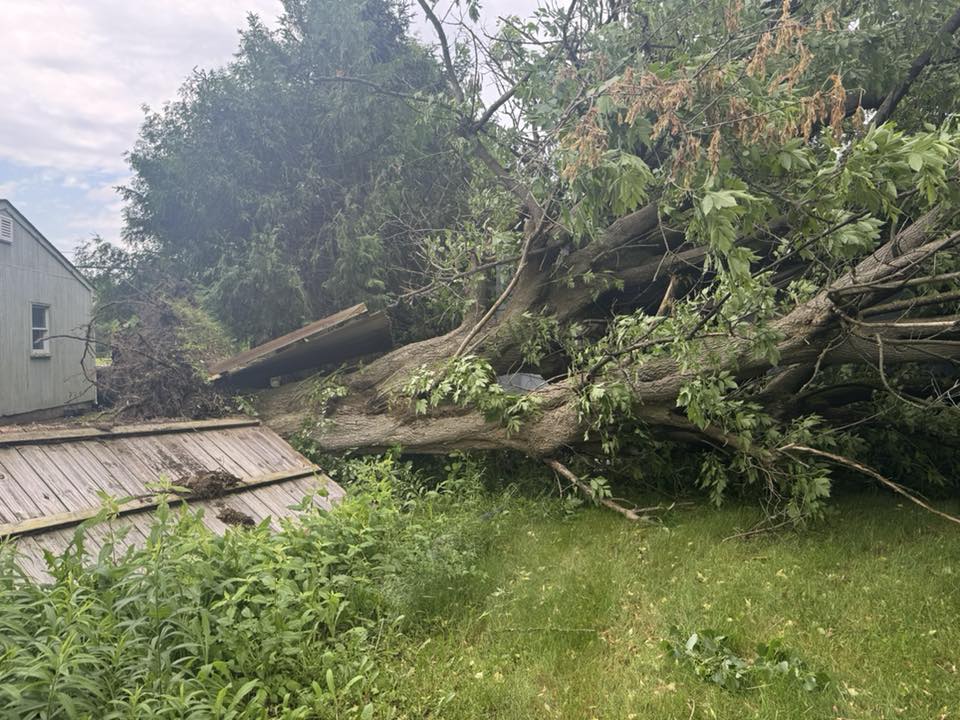
Figure 11: Tornado damage south of Beekmantown, New York on 10 June 2025. Photo courtesy of Sarah Liccardi. [click to enlarge]
Disclaimer: Figure 5 and 6 courtesy of College of DuPage Weather website: https://weather.cod.edu/
Radar imagery for images 7 and 8 were generated using GR2Analyst, Gibson Ridge Software Company http://www.grlevelx.com/gr2analyst_2/

