|
|
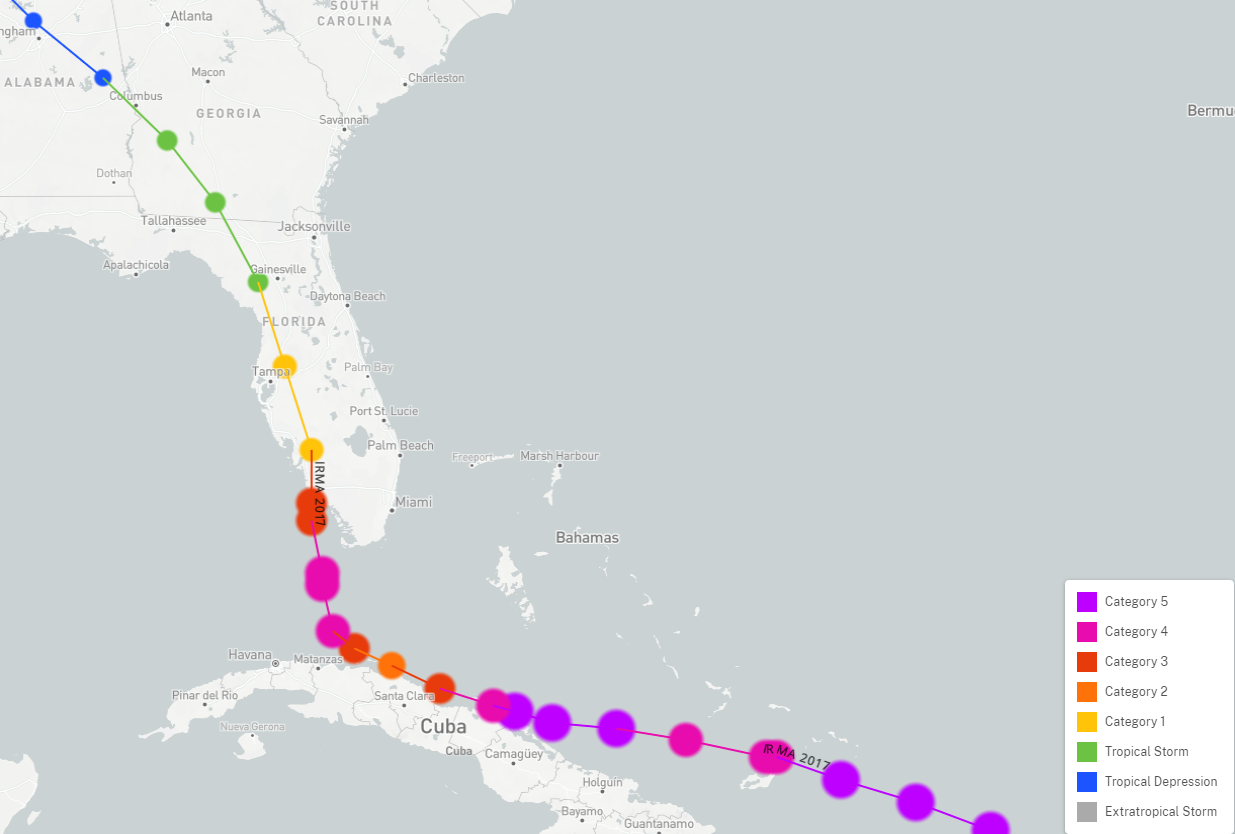
| GOES satellite (left), radar, (right-top) and track (right-bottom) imagery of Irma | |
Hurricane Irma made landfall in the Florida Keys as a Category 4 hurricane and then along the southwest coast of Florida as a Category 3 hurricane. The storm then moved north over the Florida peninsula while weakening to a tropical storm before moving into Georgia and continuing to weaken. Click here for a surface weather map from the Weather Prediction Center at 1200 UTC (8 AM EDT) on September 11 showing Tropical Storm Irma over northern Florida. The storm brought significant storm surge inundation and wind gusts near hurricane-force to coastal areas of southeast Georgia and southeast South Carolina as well as several tornadoes, flooding rainfall and river flooding. For more details on impacts to the area check out our Post Storm Report. This storm was a great example of why it's best to focus on the potential impacts and not just the forecast storm track/intensity as the storm was relatively weak in terms of max winds at it's closest approach to the SC Lowcountry/GA Coastal Empire and many other factors can ultimately determine the impacts that occur. In this case, the high pressure to the north of the storm led to very favorable winds which helped keep water levels high which led to the tremendous coastal flooding.
Click on image to enlarge

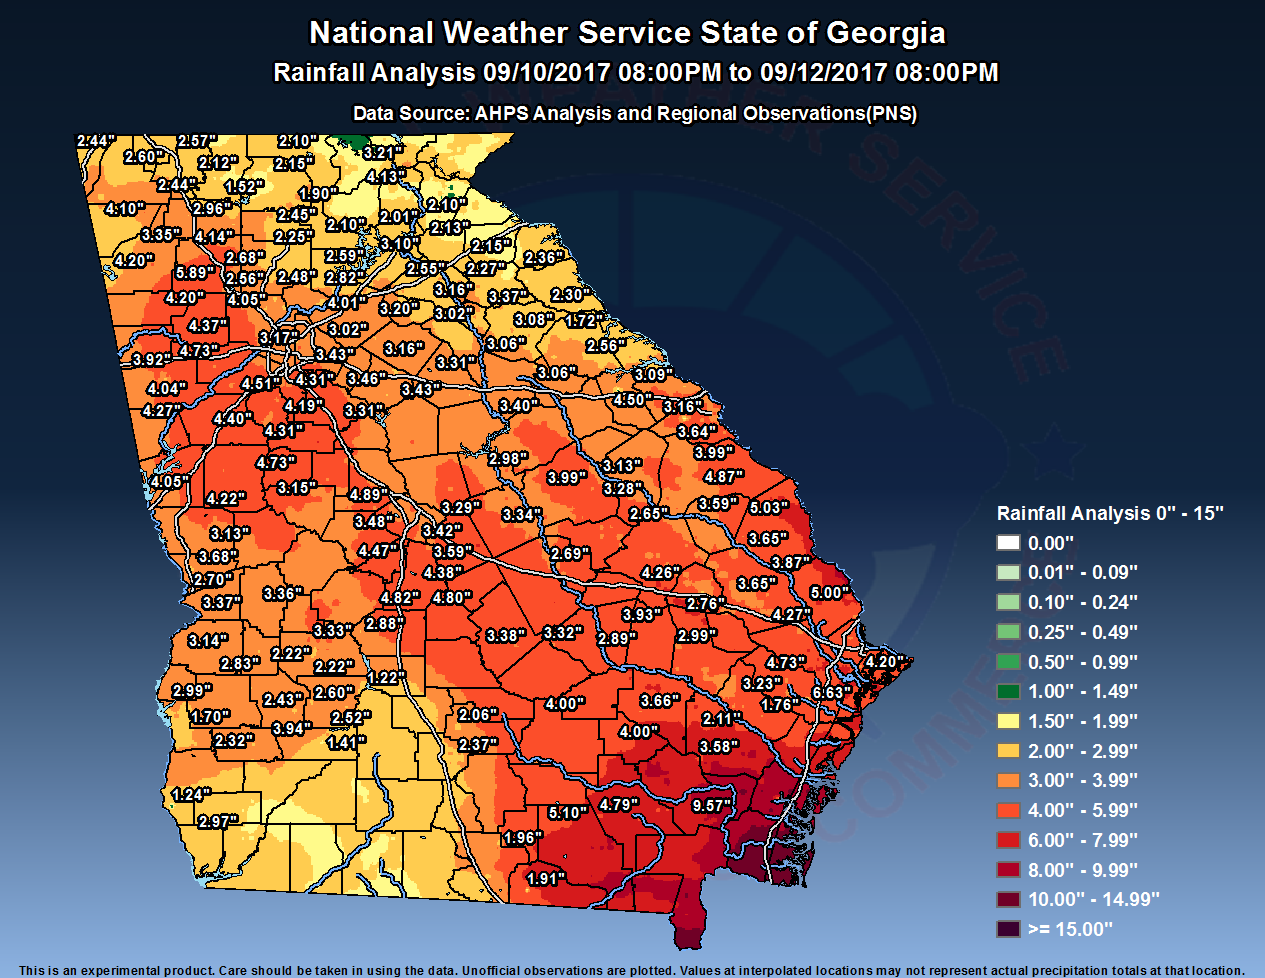
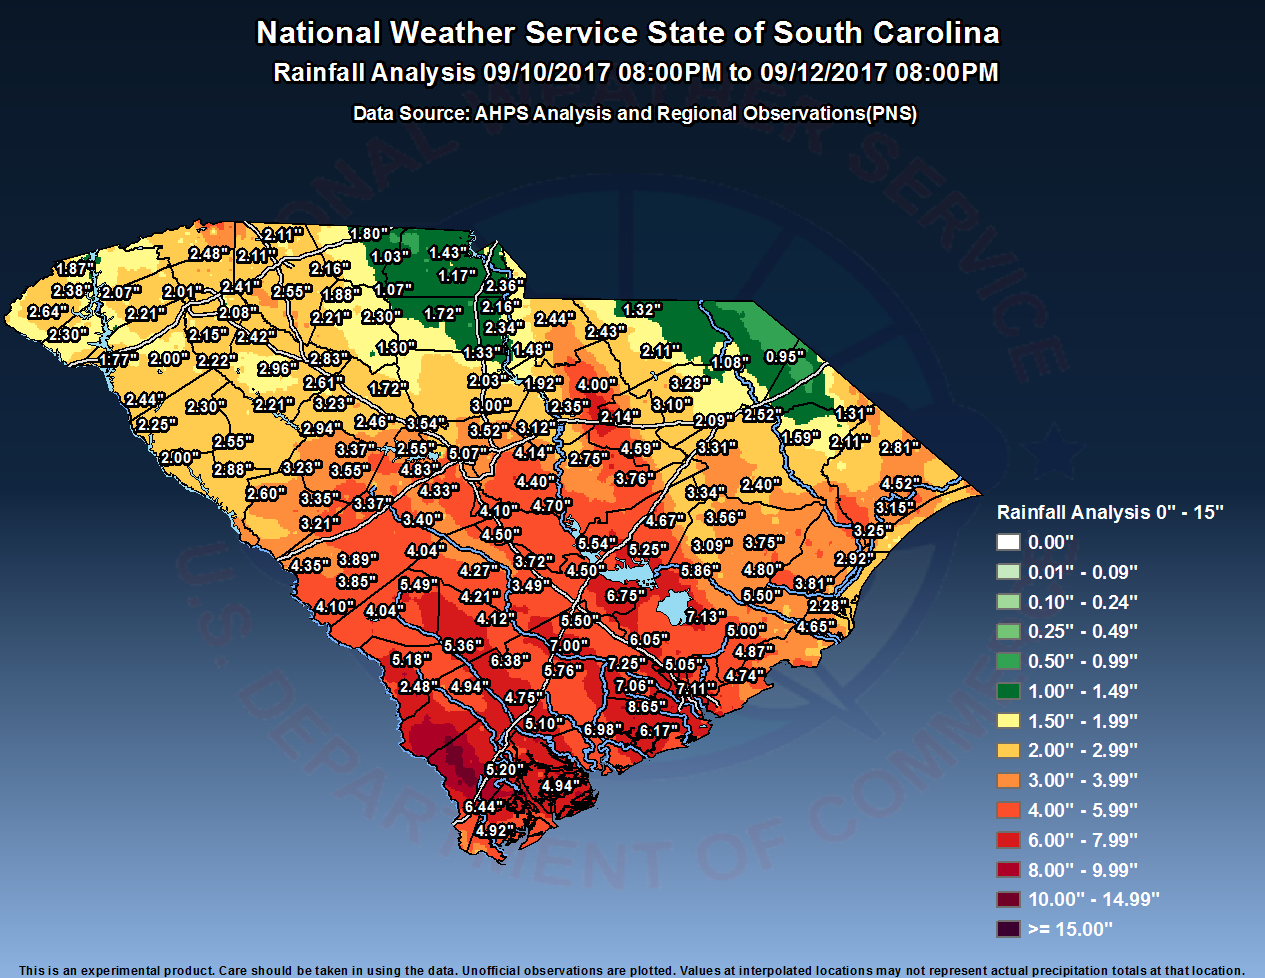
Click on images to enlarge; State-wide rainfall maps: GA and SC

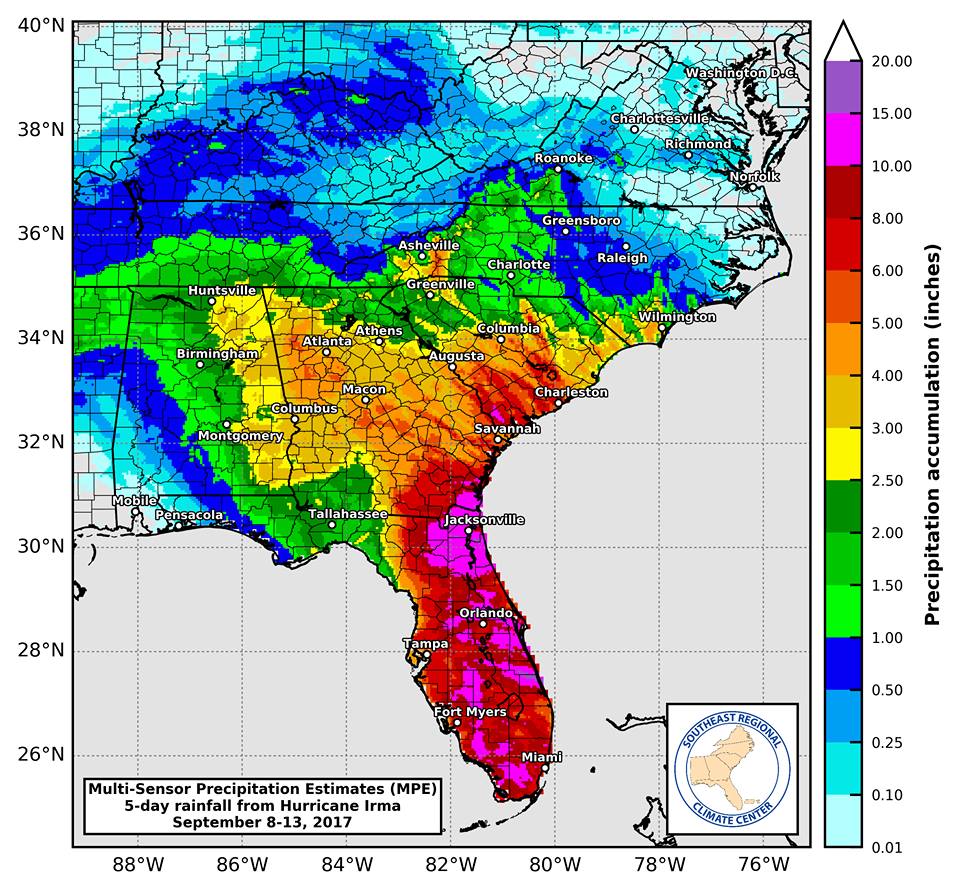
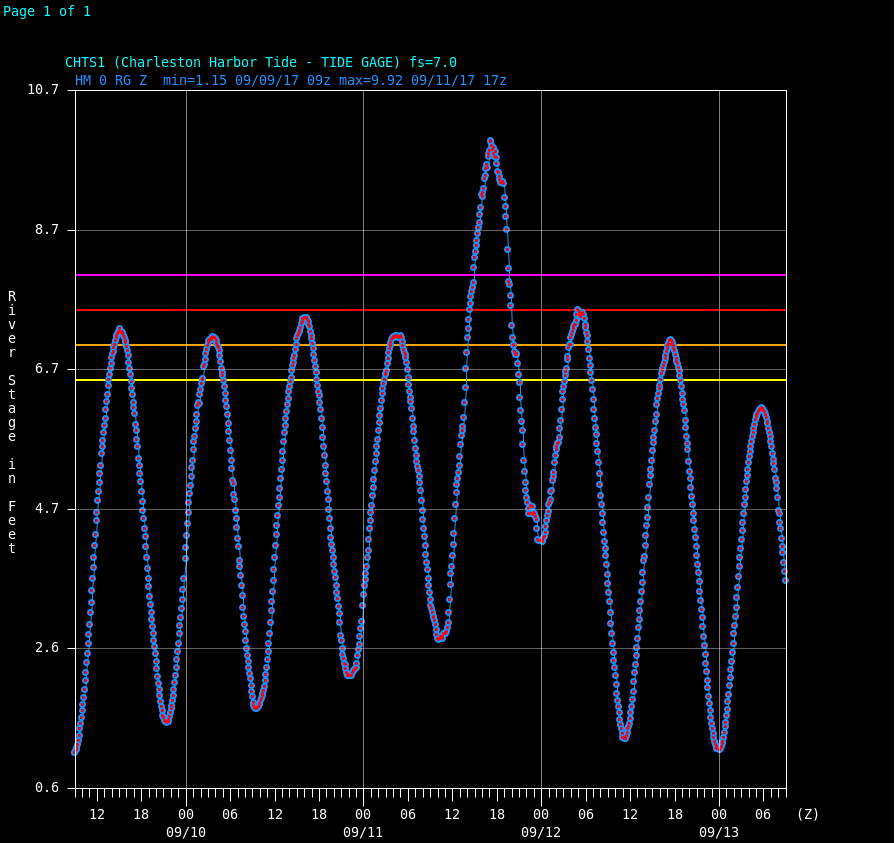
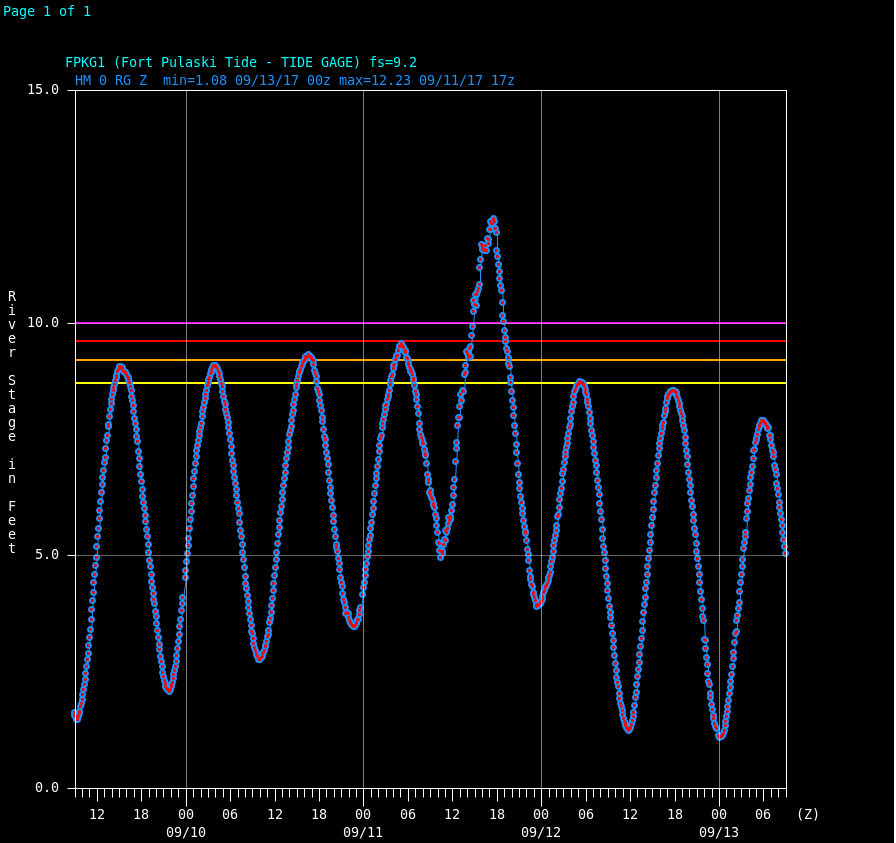
The maximum storm tide (astronomical tide + storm surge) was 12.24 feet Mean Lower Low Water (MLLW) / 4.73 feet Mean Higher High Water (MHHW) at 1742 UTC (142 PM EDT) on September 11 at Fort Pulaski, GA, which at the time was the second highest level on record. The peak storm tide in Charleston Harbor was 9.92 feet MLLW / 4.15 feet MHHW at 1718 UTC (118 PM EDT), which was the third highest on record at the time. The greatest storm surge (storm tide minus the astronomical tide) at Fort Pulaski and Charleston was 5.63 feet and 4.87 feet, respectively, although these did not occur at the same times as the highest storm tides. Click here for a map of the highest water levels recorded for many other areas along the U.S. East Coast. NOAA tide level data can be found here. Water level data collected by the USGS can be found here.
Click on images to enlarge

|
Charleston Harbor Tide Gauge |
Fort Pulaski Tide Gauge |
Four tornadoes have been confirmed in Charleston county associated with Tropical Storm Irma - three with a rating of EF-0 and one EF-1. Click here for the full summary.

Courtesy of NWS Charleston, SC; click on images to enlarge
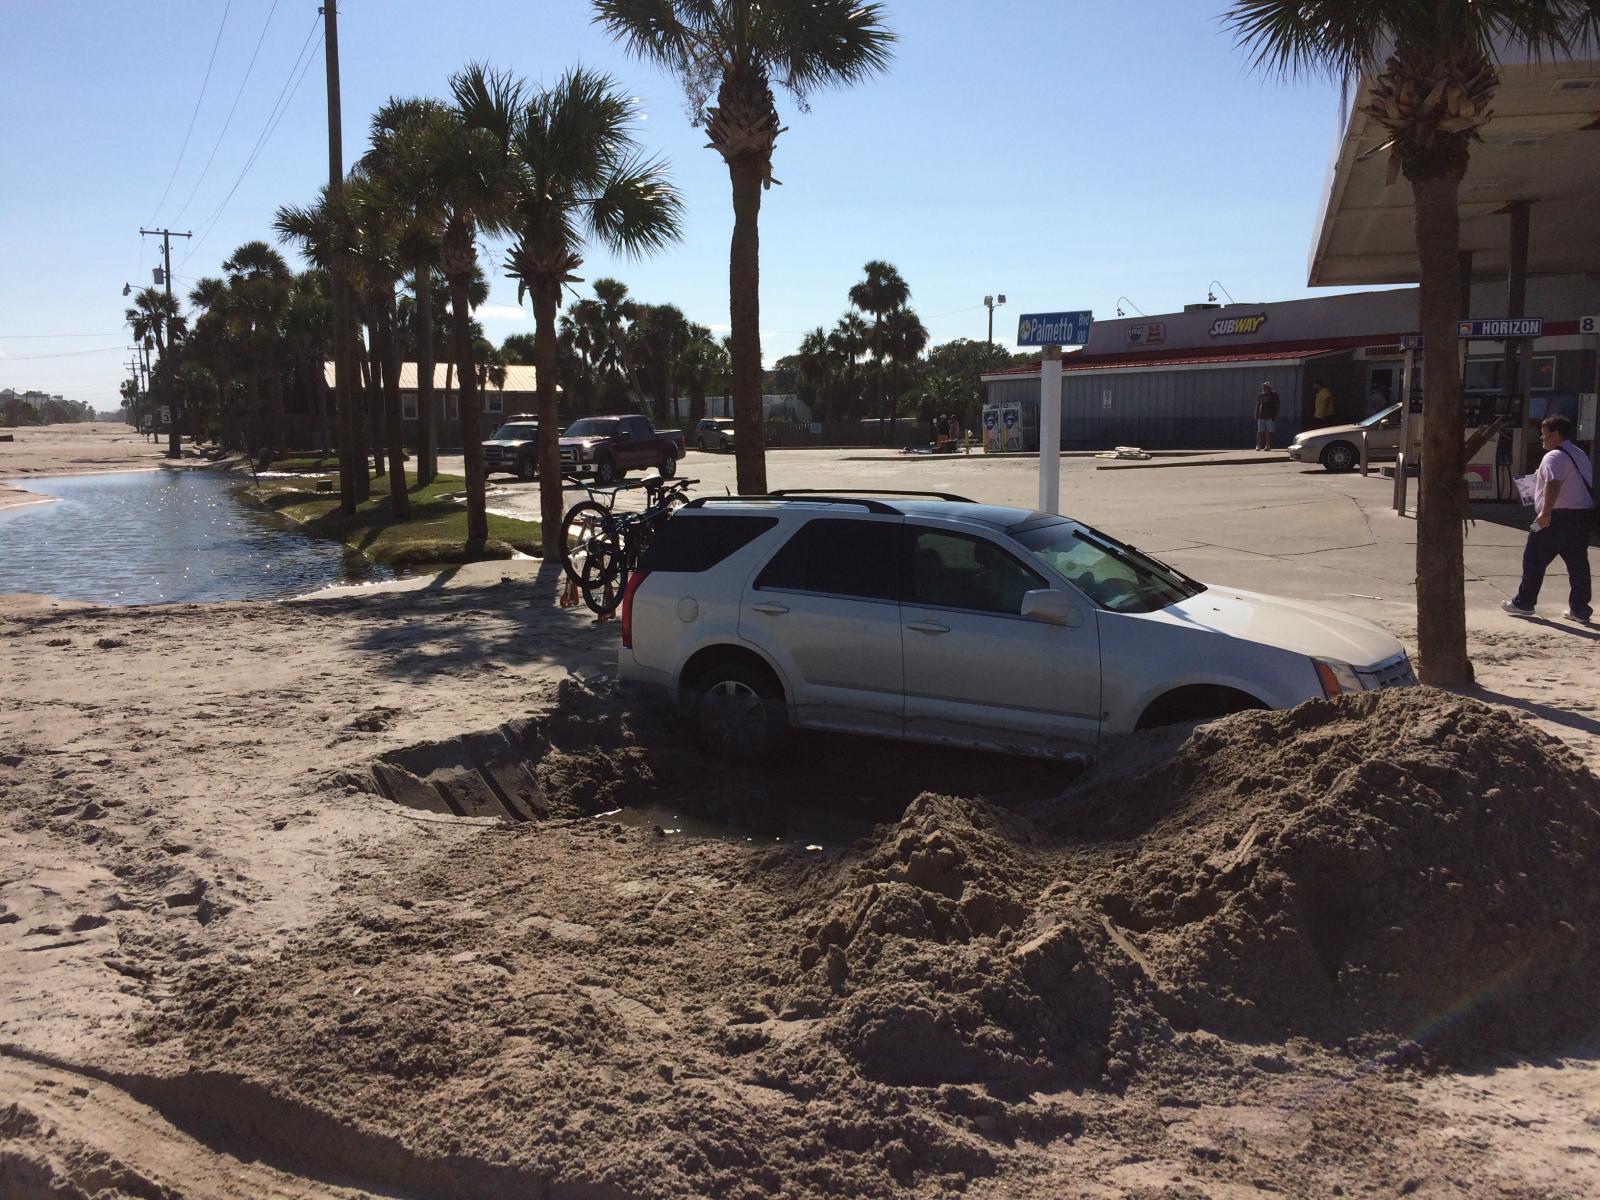
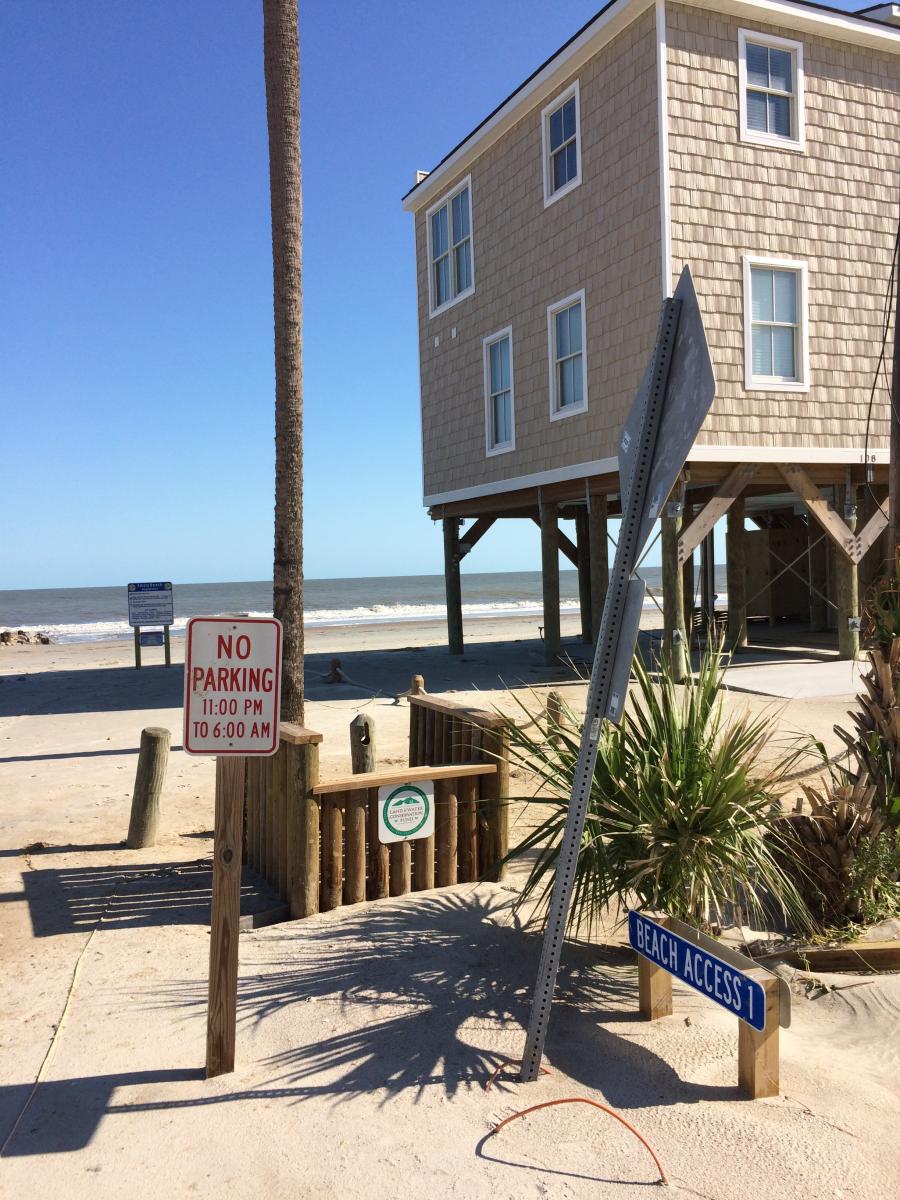
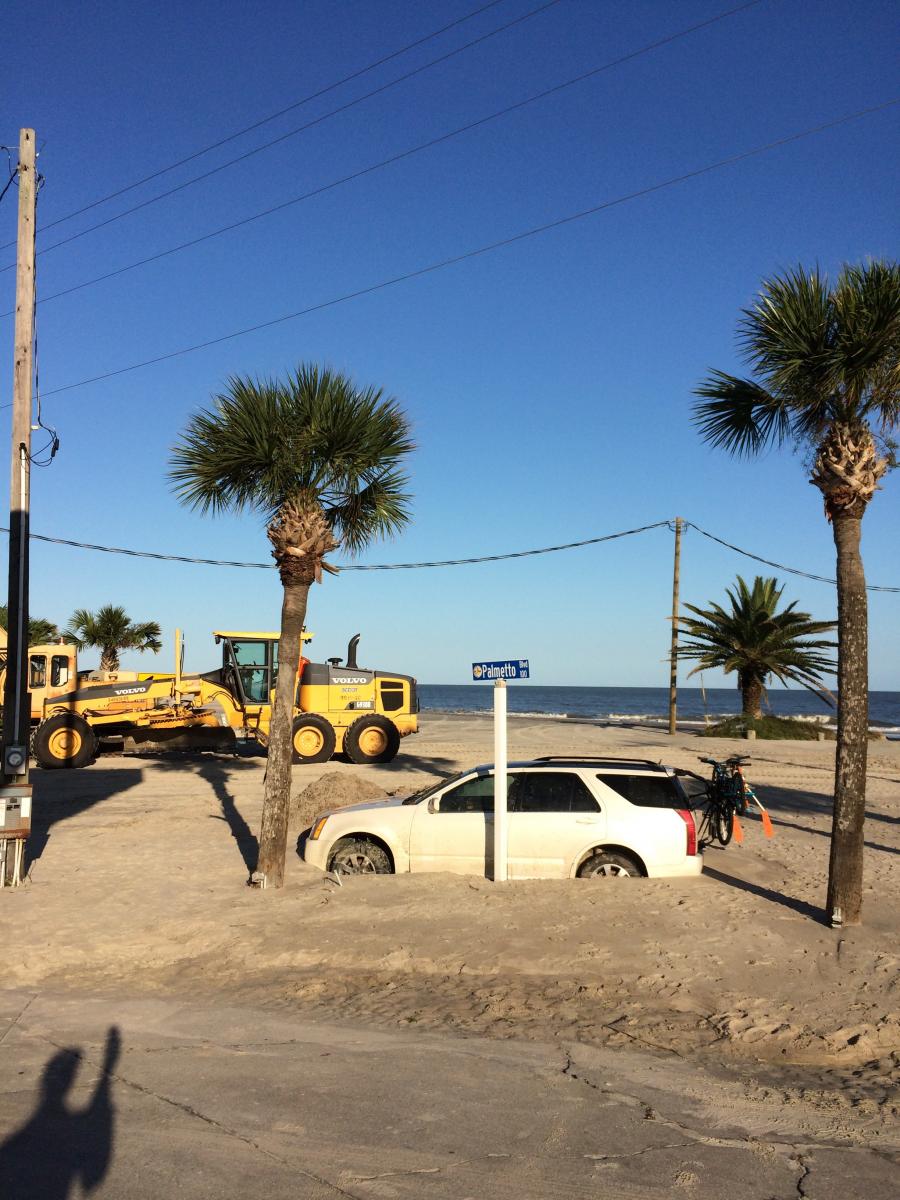
| Edisto Beach, SC | |||
 |
 |
 |
 |
 |
|||
| Tybee Island, GA | |||
 |
 |
||


 Coastal Flood