
Dangerous and extreme heat will remain across portions of the central U.S. this week, persisting across the mid to lower Mississippi Valley, Gulf Coast, southern Plains and portions of Texas. A heat wave over the Southwest U.S. will peak this weekend. Heavy to excessive rainfall may produce flash flooding from the Delmarva Peninsula north into the Hudson Valley today and tonight. Read More >
| 2025 Weather Highlights | The Year in Pictures | Winter Weather | Hydrology & Drought | Fire Weather | Severe Weather | Records & Extremes | Decision Support |
|
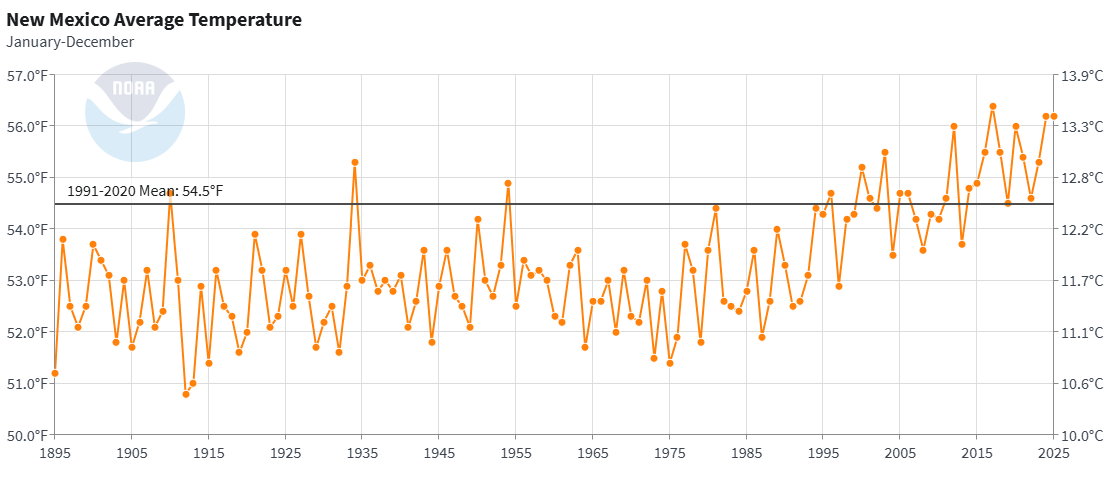
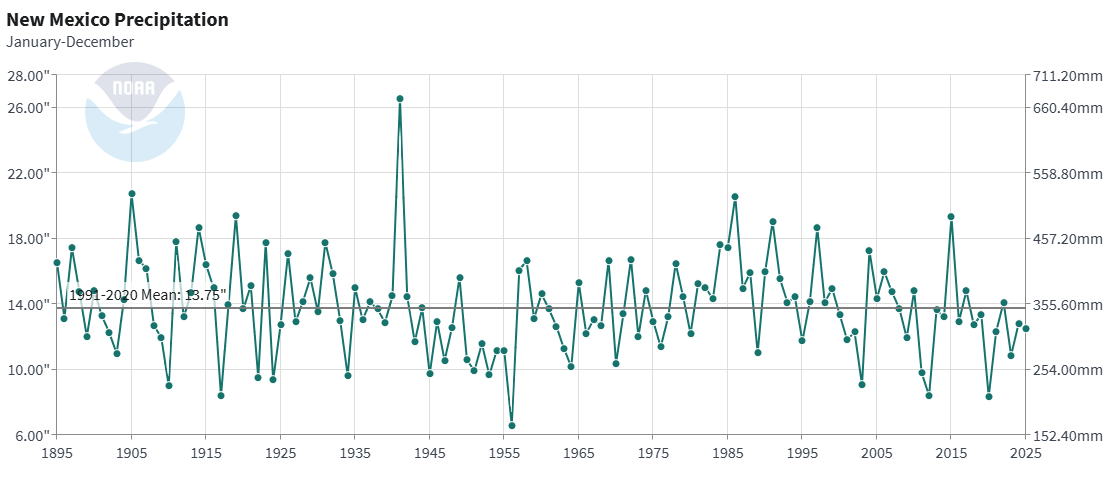
2025 was the 2nd warmest on record for NM (tied with 2024) & 38th driest |
|||||||||||||||||||||||||||||||||||||||||||||||||
|
(click the link above for a detailed climate summary of temperature and precipitation for NM and these 3 cities)
New Mexico Statewide Average Temperature & Precipitation Trend Graphics |
|||||||||||||||||||||||||||||||||||||||||||||||||
 |
|||||||||||||||||||||||||||||||||||||||||||||||||
 |
|||||||||||||||||||||||||||||||||||||||||||||||||
|
The annual weather and climate review for 2025 is organized into topics which are accessed by the tabs across the top of each page. Each topic has an associated PDF which can be viewed from any web browser or personal device. A 125% zoom level is suggested for the PDFs. Annual summary topics include; a video of the year in pictures, a review of winter weather events, a summary of the drought status and hydrology program, a brief recap of the fire weather season, a list of all the records and extremes for Albuquerque, Clayton and Roswell, a review of 2025 severe weather, and a new section dedicated to decision support services. A month-to-month recap is available for each month at the links below. All data are considered preliminary until final certification at the National Centers for Environmental Information (NCEI). |
|||||||||||||||||||||||||||||||||||||||||||||||||
|
|
|||||||||||||||||||||||||||||||||||||||||||||||||
|
|||||||||||||||||||||||||||||||||||||||||||||||||

