| Temperatures | Precipitation | ||||||
| Month | High | Low | Average | Departure | Total | Departure | Snow |
| January | 30.1 | 17.9 | 24.0 | +6.6 | 2.69 | +1.57 | 9.5 |
| February | 42.6 | 23.9 | 33.3 | +10.8 | 1.17 | +0.12 | 3.9 |
| March | 44.0 | 27.3 | 35.7 | +1.2 | 1.76 | -0.28 | 8.0 |
| April | 62.3 | 42.6 | 52.5 | +3.8 | 4.87 | +1.53 | 0.0 |
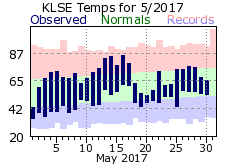
| May | 69.2 | 48.6 | 58.9 | -0.8 | 7.20 | +3.68 | T |
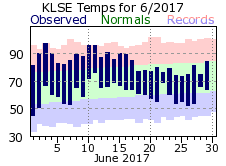
| June | 83.9 | 60.9 | 72.4 | +3.2 | 5.38 | +1.04 | ... |
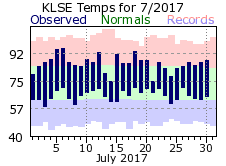
| July | 86.1 | 66.0 | 76.1 | +2.3 | 7.63 | +3.37 | ... |
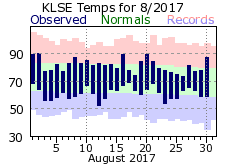
| August | 81.0 | 61.0 | 71.0 | -0.4 | 1.06 | -3.23 | ... |
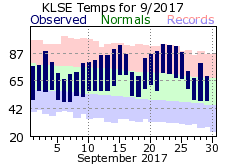
| September | 80.5 | 57.1 | 68.8 | +6.0 | 0.95 | -2.61 | ... |
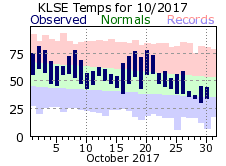
| October | 61.8 | 46.5 | 54.1 | +3.9 | 6.01 | +3.84 | T |
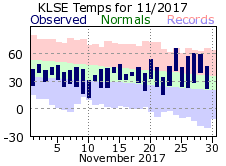
| November | 45.4 | 27.7 | 36.6 | +0.6 | 0.35 | -1.66 | T |
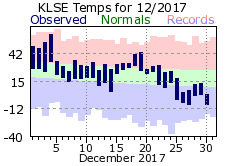
| December | 28.9 | 14.9 | 21.9 | +0.3 | 0.53 | -0.83 | 4.4 |
| TOTALS: | 59.7 | 41.2 | 50.4 | +3.0 | 39.60 | +6.54 | *** |
Records
Temperature...
Highs:
Lows:
Highest Lows:
Lowest Highs:
Monthly:
Seasonal:
Yearly:
Precipitation...
One-day pcpn:
One-day snowfall:
Monthly pcpn:
Monthly snowfall:
Seasonal precipitation:
Yearly precipitation:
|
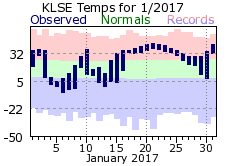
Mild air greeted La Crosse for the first few days of the new year, with a quick dip into the single digits above and below zero for the 4th through the 6th. After that, it would warm and stay unseasonably mild for the rest of the month – finishing around 6 ½ degrees above normal, placing it in the top 20 warmest January’s on record (17th). Of note, low temperatures from the 17th through the 25th were warmer than the average highs! It was also a wet month with the 2.69 inch total coming in as the 6th wettest on record for La Crosse. There were 8 days with 1/10 of an inch or more of precipitation (well above the normal of 4), with 3 of those coming in around ½ inch or greater. Thanks to the mild conditions, some of that came as rain, but January also managed to drop some snow on the area, although the 9.5 inch total was below normal. When snow did fall, daily amounts were never above 3 inches. |
 |
|
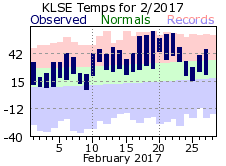
The relatively mild winter conditions persisted for February, finishing nearly 11 degrees above its normal and making it the 5th warmest on record. The average of 33.3 degrees was only a degree off what a normal March can expect. The first 60 degree day of the young year occurred on the 17th, fifth earliest occurrence of 60 degrees in a year in La Crosse. It would reach 60 or warmer 5 times for the month, most for a February. In addition, there were no below zero temperatures – a rare occurrence for February, which is accustom to around 6 such days. While total precipitation for the month was right around its normal, it was a dry month on the whole. Nearly all the precipitation came as rain on the 20th (0.55” – half the monthly total), and then snowfall on the 24th (3.4” – 87% of the snow that fell in February). Only a trace of precipitation fell from the 2nd through the 19th. The winter months of December through February averaged 26.9 degrees, making it the 7th warmest winter on record in La Crosse. Meanwhile, the 6.05” of liquid equivalent precipitation marked it as the 6th wettest. |
 |
|
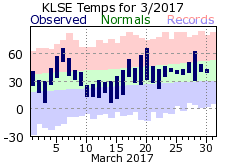
Temperatures and precipitation were more in line with what is expected for a typical March – just a degree above normal for temps and a1/4” below normal for precipitation. The bulk of March’s snowfall came on two days, with the 1st and 12th both recording 3 ½ inches. The last measurable snowfall of the 2016-17 winter season would fall a day later, on the 13th (1/2 inch). That is the 10th earlier last occurrence of measurable snow in La Crosse, and well ahead of the average which is the first week of April. |
 |
|
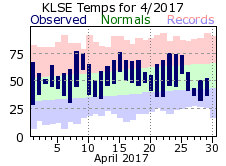
April experienced the usual swings in temperature that are typical for this spring month with highs in the 70s one day, dropping into the 40s two days later. On the whole, it was a mild April finishing almost 4 degrees above normal. The first 70 degree day for 2017 occurred on the 8th (77) which is right on the average. The last freezing day for the winter season came on the morning of the 28th, also right on the average. It was a wet month with 11 days recording over 1/10 of an inch – second most in any April and well above the average of 6. |
 |
|
Temperatures ran the gamut in May with a high as low as 43 on the 1st, to as warm as 86 on the 16th. On the whole, temperatures finished just a bit below the monthly normal. It was a wet month, mostly thanks to the 4 ½ inches that fell over the 15th through 17th. The total for the entire month was 7.20”, making it the 7th wettest May on record for La Crosse. Measurable rain fell on 17 days, 9th most for May and well above the average of 12. The latter half of the month was especially soggy – starting from the 15th there were only 2 days without any rainfall (30th and 31st). The last snowfall for the 2016-17 season came in the form of flurries on the 1st. Precipitation for the months of March, April and May came to 13.83 inches, making it the 6th wettest spring on record for La Crosse. There were 44 days with measurable precipitation, also 6th most in any spring.
|
 |
|
Summer roared in with the flip of the calendar to June. Highs were in the 80s through the first 17 days, reaching 90 degrees or greater 7 times. It was the warmest start to a June, averaging over 75 degrees through the 17th. After the hot start, the month would finish on a relatively cool note. Aside from the 29th and 30th, temperatures were below normal from the 18th on, with highs in the 70s on 9 of those days. Overall, June would finish as the 13th warmest on record. The start of June gave the area a break from the wet May with only 0.03” of rain falling over the first 11 days. Rain would return in earnest of the rest of the month though with over 5 inches falling from the 12th through month’s end. The peak wind gust for 2017 came in June with 55 mph recorded on the 24th. |
 |
|
July was warm, and continued the wet trend that started in April. Temperatures were generally at or a few degrees above the monthly normals. There were 11 days with measurable rainfall – right around the usual number of 10 for July. That said, 5 of those recorded around ½” or greater, with a deluge of 5.15” falling on the 19th and 20th – tying it for the 9th wettest 2-day rainfall on record for La Crosse. The rain resulted in flooding across parts of the city. The 19th also set a record for daily rainfall (2.85”). The 4 month period of April through July brought 25.08 inches of precipitation, 2nd most on record for La Crosse for that stretch of months. It also accounted for 75% of the yearly normal for precipitation (33.06”). |
 |
|
August would round out the summer months on a much drier and cooler note. Temperatures were generally right about the normals without much fluctuation “up or down”. There were 10 days with measurable rainfall, right on the average. However, when it rained it wasn’t much. On 6 of those days the rainfall was under 1/10 of an inch, with the max for any day only 0.35”. The monthly total was only 1.06” – 9th driest August on record, and closer to normal precipitation for February rather than August. |
 |
|
September got the traditional fall months off to a very mild start – averaging over 6 degrees above its normal and tying for the 2nd warmest September on record (68.8 F). Highs reached or exceeded 80 degrees on 16 days – 4th most for September and well above its average of 7. There were also 5 days with 90 degrees or better (only averages 1 day). August’s drying persisted for September. There were only 8 days with measurable rainfall with the 0.53” total on the 25th accounting for over ½ of the month’s total. The total for the month of 0.95 inches made it the 9th driest September on record. The very dry August and September combined for only 2.01 inches of rain for La Crosse, the second driest Aug-Sep on record. |
 |
|
October stayed mild but was soggy. There were 16 days with measurable precipitation – tied for 5th most on record for October and well above its average of 9. Out of those days, 8 of them recorded ¼” or more (2nd most for an October) with around 1 ½” falling on 2 of those days. The 6.01” total made it the 4th wettest October on record. While mostly at or above the normal for the better part of the month, October would end on a chilly note. From the 27th through 31st highs were only in the 30s and 40s with the first sub freezing low of the fall season on the 29th (30 degrees). The first flurries of the season also came in late October – the 27th. |
 |
|
While November temperatures finished just a bit above normal, it was a tale of two halves. The start of the month was cool with average temperatures below normal on 12 out of the first 15 days. For the end of the month, it was above normal on 12 of the remaining 15. Highs even reached 60 degrees or greater twice (on the 24th and 27th). These were the last 60 degree days of the year and about 2 weeks later than the average last occurrence. It was a very dry November with measurable precipitation falling on 5 days for a monthly total of 0.35 inches (13th driest on record). Only a trace came in the form of snowfall - making it one of 15 Novembers where a trace to no snow fell (normal is 4.1 inches). Temperatures for September through November averaged 53.2 degrees, making it the 8th warmest fall on record for La Crosse. |
 |
|
Despite December’s average temperature finishing around its normal, it was anything but. The month started out very mild, with above normal temperatures on 18 of the first 22 days. It even reached 62 on the 4th, the last 60 degree day for 2017 and the 8th latest occurrence of a 60 degree on record for La Crosse. The end of the month would take a turn toward the frigid with single digit highs on 4 out of the last 6 days, only reaching 0 on the 31st. December was a dry month, almost an inch below normal. There was measurable precipitation on 9 days (right on the December average), but 6 of those recorded less than 0.05”. Snow was also lacking with just over 4 inches falling for the month. There were 9 days of measurable snow and 12 days with flurries. So, La Crosse saw at least a little snow on most days during the month, but it didn’t amount to much. |
 |
|
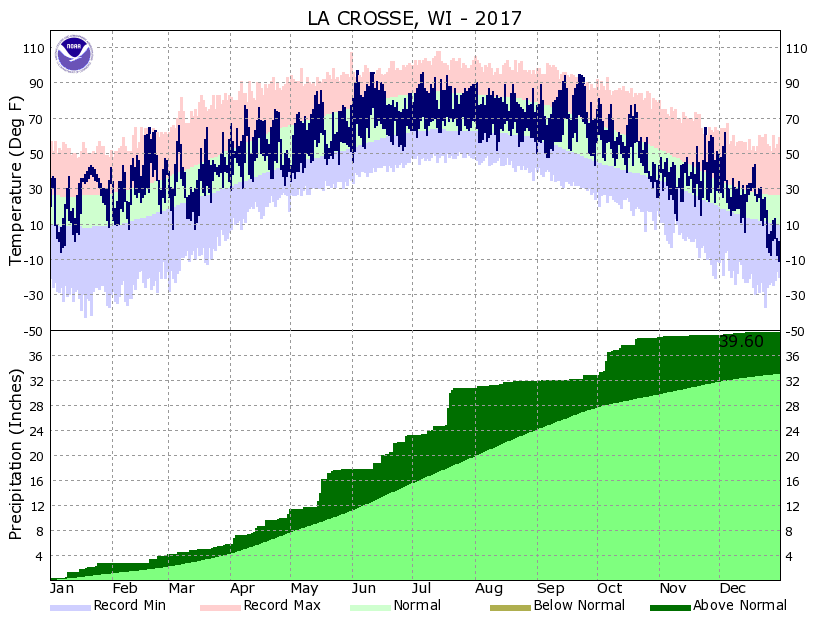
2017 will go down as one of the warmest on record for La Crosse, along with being one of the wettest. A mild winter and warm fall accounted for much of the warmth. The average temperature of 50.4 degrees tied it with 1987 as the 6th warmest on record and only the 7th time that La Crosse has averaged better than 50 degrees in a year. Temperatures held above freezing on 244 days, 5th most in any year in La Crosse. Also, there were only 10 days where temperatures chilled to zero of colder, tied for 10th least on record. There were 39.60 inches of precipitation in 2017, making it the 12th wettest on record. There were 134 days with measurable precipitation, tied for 8th most in a year for La Crosse, with 10 of those dropping 1” or greater (tied for 10th most). Meanwhile, there were no days with 4 inches or greater snowfall in La Crosse, only the 7th time on record this has occurred. |
 |
| Highest temperature for 2017 | 97 on June 3rd |
| Lowest temperature for 2017 | -11 on December 31st |
| Highest one-day precipitation | 2.85 inches on July 19th |
| Highest one-day snowfall | 3.5 inches on March 1st and 12th |
| Number of days with highs at or above 90 degrees | 18 |
| Number of days with highs at or below 32 degrees | 46 |
| Number of days with zero or below temperatures | 10 |
| Peak wind gust | 55 mph from the west on June 24th |
| Number of days with measurable precipitation | 134 |
| Percentage of days with measurable precipitation | 37% |
| Number of days with above normal temperatures | 229 |
| Percentage of days with above normal temperatures | 63% |


 Weather Story
 Weather Map
 Local Radar