Background
Heat is an underrated danger, with an average of 175 Americans losing their lives annually from heat-related causes.According to the Centers for Disease Control and Prevention, from 1979-2003 excessive heat exposure caused 8,015 deaths in the United States. During this period, more people died from extreme heat than from hurricanes, lightning, tornadoes, and floods combined.
Heat kills by taxing the human body beyond its ability to cool itself. Cooling is primarily accomplished by the evaporation of perspiration. How efficiently this process functions is directly related to the amount of water vapor in the air. High moisture content reduces the evaporative cooling rate of perspiration, making it difficult for the body to maintain a steady and safe internal temperature. One way to measure the combined effect of temperature and moisture on the human body is the heat index.
In 1979, R. G. Steadman constructed an apparent temperature table using temperature, relative humidity, and other factors, based on a number of published research papers over a 54-year span. The National Weather Service (NWS) developed a heat index equation based on Steadman’s work as guidance for heat-related advisories or warnings. Heat advisories or warnings are issued to the public when values approach dangerous levels.
Climatology
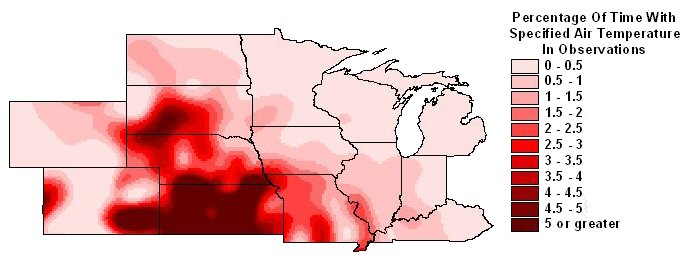
A study conducted by the NWS La Crosse investigated the frequency of high heat across the Plains into the Great Lake States, looking at the percentage of observations which recorded high heat. The study focused on the summer months (June, July, August) and the period from 1971-2000.
The "hottest" areas were located across the Central Plains into the mid-Mississippi River Valley. The geographic and climatic location, along with proximity to the Gulf of America, makes these areas prone to very warm temperatures, and in some cases, high humidity. This results in more frequent and higher heat indices.
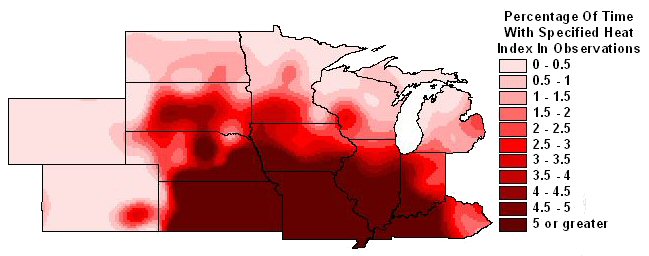
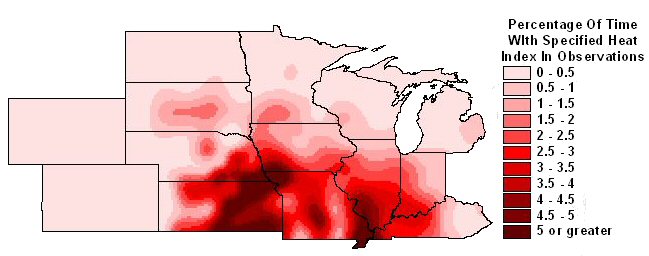
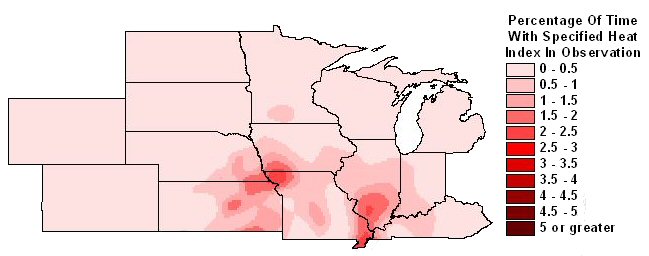
The maps below depict the percentage of observations which contained the indicated temperature or heat index during the summer months (click to enlarge).
|
|
|
|
Locally
The table below shows some of the percentages for high, dangerous heat, for various locations across the region.
Listed: total number of observations (OBS total), number of observations with an air temperature of 95°F or greater (95°F or greater), percentage with 95°F or greater air temperature (%95°F or greater), and percentage of certain heat indices (for example, HI 100°F % represents the percentage of observations that produced a 100°F or warmer heat index in the data set)
|
Name |
OBS total |
95°F or greater |
% 95°F or greater |
HI 95°F % |
HI 100°F % |
HI 105°F % |
HI 110°F % |
|
Brainerd |
39707 |
145 |
0.4 |
1.87 |
0.68 |
0.16 |
0.06 |
|
Chicago |
63606 |
317 |
0.5 |
3.05 |
1.2 |
0.38 |
0.11 |
|
Des Moines |
64240 |
731 |
1.1 |
4.2 |
1.7 |
0.61 |
0.09 |
|
Dubuque |
50051 |
117 |
0.2 |
2.35 |
0.88 |
0.25 |
0.05 |
|
Duluth |
65535 |
7 |
0 |
0.16 |
0.01 |
0 |
0 |
|
Eau Clairie |
63116 |
201 |
0.3 |
1.3 |
0.52 |
0.13 |
0.04 |
|
Fargo |
63958 |
290 |
0.5 |
1.25 |
0.35 |
0.09 |
0 |
|
Green Bay |
65130 |
110 |
0.2 |
0.88 |
0.4 |
0.12 |
0.04 |
|
La Crosse |
63263 |
391 |
0.6 |
2.89 |
1.24 |
0.56 |
0.21 |
|
Madison |
64734 |
162 |
0.3 |
1.63 |
0.62 |
0.17 |
0.05 |
|
Mankato |
34118 |
181 |
0.5 |
3.21 |
1.44 |
0.59 |
0.2 |
|
Marquette |
37993 |
21 |
0.1 |
0.2 |
0.01 |
0 |
0 |
|
Mason City |
63238 |
272 |
0.4 |
2.8 |
1.14 |
0.31 |
0.05 |
|
Milwaukee |
64386 |
189 |
0.3 |
1.73 |
0.66 |
0.16 |
0.06 |
|
Minneapolis |
63928 |
283 |
0.4 |
1.92 |
0.67 |
0.18 |
0.03 |
|
Moline |
64158 |
561 |
0.9 |
4.84 |
2.19 |
0.78 |
0.21 |
|
Peoria |
64978 |
436 |
0.7 |
4.82 |
2.17 |
0.74 |
0.19 |
|
Rochester |
64986 |
106 |
0.2 |
0.92 |
0.43 |
0.12 |
0.02 |
|
Sioux Falls |
64444 |
762 |
1.2 |
3.37 |
1.19 |
0.27 |
0.05 |
|
St Cloud |
46586 |
174 |
0.4 |
1.59 |
0.51 |
0.13 |
0.02 |
|
Waterloo |
63667 |
353 |
0.6 |
3.01 |
1.29 |
0.47 |
0.1 |


 Weather Story
 Weather Map
 Local Radar