Upper Mississippi River Weather Summary for July 2026:
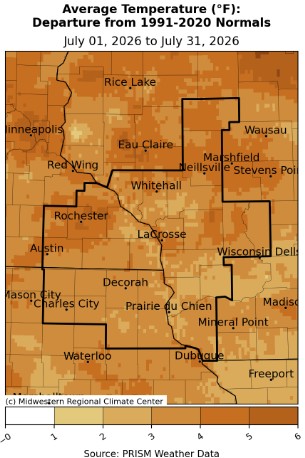
Temperatures - Warmer than Normal
- During July 2026, average temperatures across the Upper Mississippi River Valley ranged from 69.7°F at Medford Taylor County Airport (AWOS) to 77.1°F at Alma Dam 4, WI (COOP).
- Temperature anomalies ranged from 1°F to 6°F warmer than normal.
- The hottest temperature was 99°F at Boscobel Airport, WI (ASOS) on July 27. Meanwhile, the coldest temperature was 41°F at Black River Falls, WI (RAWS) on July 22.
|
 |
Precipitation - Highly Variable
- Rainfall across the Upper Mississippi River Valley was highly variable ranging from 1.59" near Medford, WI (CoCoRaHS) to 13.39" near Spring Valley, MN (CoCoRaHS).
- Rainfall anomalies ranged 5" drier than normal to 6" wetter than normal.
- The highest 24-hour rainfall occurred at Grand Meadow, MN when 7.30" of rain fell from July 1-2.
|
 |
|
Severe Weather - Tied for 9th Most Convective Warrnings (Tornado/Severe Thunderstorm/Flash Flood Warnings) for July
- During July 2026, there was 46 convective weather warnings. This tied 2003 for the 9th most in July. This was the most in a July since 2008 (78 warnings - most for July). The least was 1 in 1996. The long-term (1986-2026) average is 32.6 warnings.
- At least 1 convective warning was issued on 5 days in July. The greatest warnings on calendar day was 16 warnings on July 1. This was followed with 15 warnings on July 2, 11 warnings on July 8, 3 warnings on July 20, and 1 warning on July 18.
- The most July convective warnings in a county was Fillmore (MN) with 11 warnings (6 severe thunderstorm warnings, 1 tornado warning, and 4 flash flood warnings).
- The least convective warnings in a county were in Clark (WI), La Crosse (WI), and Taylor (WI) counties with no warnings.
|
 |
- There were 28 Severe Thunderstorm warnings. The greatest in July was 70 warnings in 2008 and the least was 1 warning 1990 and 1996. The long-term (1986-2026) average for July is 25 warnings.
- There was 9 Tornado warnings. The greatest in July was 16 warnings in 1997, and the least was none in 1988, 1989, 1990, 1996, 2001, 2006, 2008, 2012, 2014, and 2023. The long-term (1986-2026) average for July is 3.1 warnings.
- There were 9 Flash Flood warnings. This was the 7th most in a July. The greatest in July was 19 warnings in 1999, and the least was no warnings in 1986, 1988, 1989, 1992, 1994-96, 1998, 2001, 2012-15, 2018, 2021, and 2023. The long-term (1986-2026) average is 4.1 warnings for July.
|
Below are the July 2026 climate summaries for La Crosse, WI, and Rochester, MN.
La Crosse, WI
July 2026 was Warmer and Wetter than Normal at La Crosse, WI
...July 2026 Highlights...
Temperatures - 20th Warmest
- The average temperature was 76.4°F at La Crosse Regional Airport.
- This was 1.4°F warmer than the 1991-2020 normal of 75°F.
- This was the 20th warmest July.
- Warmest July since 2020 (77.1°F - Tied with 1987 and 2019 for the 12th warmest July).
- Tied with June 2021 for the 7th warmest month this century.
- Below are the 20 warmest Julys in La Crosse, WI.
20 Warmest Julys
in La Crosse WI
1873-2026
Rank Avg. Temp Year
---- --------- ----
1 79.6°F 2012
2 79.5°F 1936
3 79.2°F 1916
79.2°F 1901
5 78.5°F 1955
6 78.2°F 1980
7 78.0°F 2006
8 77.9°F 1935
9 77.6°F 2011
10 77.5°F 1921
11 77.2°F 1999
12 77.1°F 2020
77.1°F 2019
77.1°F 1987
15 76.7°F 2002
76.7°F 1983
17 76.6°F 1988
76.6°F 1931
19 76.5°F 1874
20 76.4°F 2026
- 7 out of the 20 warmest Julys have occurred this century.
- The average high temperature was 86°F. This was 0.6°F warmer than the 1991-2020 normal of 85.4°F.
- The average low temperature was 66.8°F. This was 2.3°F warmer than the 1991-2020 normal of 64.5°F. Tied for the 10th warmest with 1879.
- The hottest temperature was 97°F on July 27 and the coolest temperature was 52°F on July 22.
- There were 8 days in which the high temperature reached or exceeded 90°F. The 1991-2020 normal is 7 days.
Precipitation - 14th Wettest
- A total of 7.38" of rain fell at La Crosse Regional Airport.
- This was 3.15" wetter than the 1991-2020 normal of 4.23".
- This was the 14th wettest July.
- Below are the 20 wettest Julys in La Crosse, WI.
20 Wettest Julys
in La Crosse WI
1873-2026
Rank Rainfall Year
---- -------- ----
1 11.03 inches 1883
2 9.50 inches 1900
3 9.35 inches 1987
4 9.17 inches 1978
5 9.16 inches 1953
6 8.86 inches 1881
7 8.51 inches 1885
8.51 inches 1878
9 8.42 inches 1999
10 8.27 inches 1934
11 7.67 inches 1991
12 7.66 inches 1981
13 7.63 inches 2017
14 7.38 inches 2026
15 7.08 inches 1938
16 6.94 inches 1917
17 6.84 inches 2008
18 6.80 inches 1879
19 6.55 inches 2019
20 6.49 inches 1901
- During the first 5 days of July, 5.21" of rain fell. This was the second most. Only 1978 had more with 6.40".
- A total of 5.57" of rain fell during the 1st half (July 1-16) of July. This was the 7th wettest and the wettest since 2008 when 5.75" of rain fell. The wettest was 7.13" in 1978.
- Measurable rain fell on 9 days (29%).
- The wettest day was 2.29" on July 1.
Mississippi River - Below Average
- The average 7 AM stage for the Mississippi River at La Crosse was 5.25'.
- This was 1.03' lower than the 1937-2024 average of 6.28'.
- This was the lowest July average since 2023 (average 4.99').
- The highest 7 AM stage was 6.07' on July 3.
- The lowest 7 AM stage was 4.52' on July 22.
...July 2026 Records...
Daily Records...
...Looking ahead to August...
- The normal high temperature in La Crosse starts at 85°F on August 1st and falls to 81°F by the end of the month. The normal low temperature starts at 64°F on the 1st and falls to 60°F by the end of the month. The normal mean temperature for the month is 72.8°F. La Crosse’s hottest August occurred in 1947 with an average temperature of 78.3°F, and their coldest August happened in 1927 and 1915 with an average temperature of 64.8°F.
- For August, the hottest temperature recorded was 105°F on August 1, 1988, and the coldest temperature was 35°F on August 30, 1915. There are typically 4 days with temperatures at or above 90°F.
- The average precipitation for August is 3.90". The wettest August occurred in 2007 when 13.75" of rain fell, and the driest occurred in 1894 when 0.35" of rain fell. The wettest August day was 4.05" on August 18, 2007. Normally, there are 6 days with thunderstorms.
- Valley fog is quite prevalent in the area. On average, this fog reduces the visibility to a quarter-mile or less at the airport on 3 days.
Rochester, MN
July 2026 was Warmer and Wetter than Normal at Rochester MN
...July 2026 Highlights...
Temperatures - 11th Warmest July & 14th Warmest Month
- The average temperature was 74.1°F at Rochester International Airport.
- This was 3.6°F warmer than the 1991-2020 normal of 70.5°F.
- This was the 11th warmest July.
- Below are the 20 warmest Julys in Rochester MN.
20 Warmest Julys
in Rochester MN
1886-2026
Rank Avg. Temp Year
---- --------- ----
1 77.7°F 1936
2 77.3°F 1916
3 77.2°F 1955
4 77.1°F 2012
5 75.6°F 1935
6 75.2°F 1949
7 75.1°F 2011
8 75.0°F 1957
9 74.5°F 1974
10 74.3°F 2006
11 74.1°F 2026
12 74.0°F 1931
13 73.9°F 1983
14 73.8°F 1964
73.8°F 1914
16 73.7°F 1976
73.7°F 1943
73.7°F 1887
19 73.6°F 1988
73.6°F 1987
- This was the warmest month since July 2012 (77.1°F) and the 14th warmest month.
- 4 out of the top 11 warmest Julys have occurred this century.
- The average high temperature was 83.4°F. This was 3.1°F warmer than the 1991-2020 normal of 80.3°F.
- The average low temperature was 64.9°F. This was 4.1°F warmer than the 1991-2020 normal of 60.8°F. This was the 5th warmest and the warmest since 2012 (66.7°F - warmest)
- The hottest temperature was 94°F on July 27.
- The coolest temperature was 55°F on July 22 and July 23.
- There were 6 days in which the high temperature reached or exceeded 90°F. The 1991-2020 normal is 2 days.
Precipitation - 5th Wettest
- A total of 8.84" of rain fell at Rochester International Airport.
- This was 4.65" wetter than the 1991-2020 normal of 4.19".
- This was the 5th wettest July. Wettest July since 1997 (9" - 4th wettest)
- 18th wettest month. Wettest since June 2024 (9.89" - 9th wettest month)
- Below are the 10 wettest Julys in Rochester MN.
10 Wettest Julys
in Rochester MN
1886-2026
Rank Rainfall Year
---- -------- ----
1 12.33 inches 1978
2 10.46 inches 1981
3 9.66 inches 1938
4 9.00 inches 1997
5 8.84 inches 2026
6 8.74 inches 1999
7 8.29 inches 1990
8 8.14 inches 1951
9 7.38 inches 2019
10 7.24 inches 1987
- A total of 5.60" of rain fell during the 1st half (July 1-16) of July.
- This was the 2nd wettest first 10 days of July. Only 1978 was wetter with 7.81".
- Measurable rain fell on 9 days (29%) and trace amounts fell on another day (3.2%).
- The wettest day was 2.34" on July 31.
...July 2026 Records...
...Looking ahead to August...
- The normal high temperature in Rochester falls from 79°F on August 1st to 76°F by the end of the month. The normal low temperature falls from 60°F on the 1st to 56°F by the end of the month. The normal mean temperature for the month is 68.2°F. Rochester’s hottest August occurred in 1947 with an average temperature of 77°F, and their coldest August occurred in 1992 with an average of 63.1°F.
- For August, the hottest temperature recorded was 100°F on August 3, 1930, August 15, 1936, August 4, 1947, August 23, 1948, and August 24, 1948, and the coldest temperature was 32°F on August 30, 1915. Normally, there is only 1 day with temperatures at or above 90°F.
- The average precipitation for August is 4.12". The wettest August occurred in 2007 when 14.07" of rain fell and the driest occurred in 1941 when 0.31" of rain fell. The wettest August day was 5.16" on August 18, 2007. Normally, there are 6 days with thunderstorms.



 Weather Story
 Weather Map
 Local Radar
 Follow us on X
 Follow us on Facebook
 Follow us on YouTube
 ARX RSS Feed