Upper Mississippi River Climate Summary for Meteorological Spring 2026:
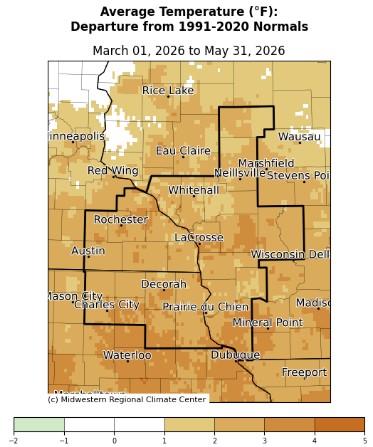
Temperatures - Above Normal
- During meteorological spring 2026, average temperatures ranged from 43°F near Owen, WI (COOP) to 52.4°F at Decorah, IA (COOP).
- Temperature anomalies ranged from 1°F to 4°F above normal.
- There was a 105°F difference between the warmest and coldest temperatures in the Upper Mississippi River Valley.
- The warmest temperature was 92°F at Black River Falls (RAWS) on May 26.
- The coldest temperature was -13°F at Theilman, MN on March 18.
|
 |
Precipitation - Highly Variable
- During meteorological spring 2026, precipitation totals varied from 6.23" near Hayfield, MN (CoCoRaHS) to 21.45" near Muscoda, WI (CoCoRaHS).
- Precipitation anomalies ranged from 4" drier than normal to 7" wetter than normal.
- The highest one-day precipitation was 4.46" near Decroah, IA (CoCoRaHS) from April 3 through April 4.
|
 |
Snowfall - Highly Variable
- During meteorological spring 2026, snowfall totals varied from 1.5" in Charles City, IA (COOP) to 19.3" near Theilman, MN (COOP).
- Snowfall anomalies ranged from 6" below normal to 9" above normal.
- The highest one-day snowfall was 18" near Colby, WI (CoCoRaHS) and Wabasha. MN (CoCoRaHS) from March 14 through March 15.
|
 |
Severe Weather - Near to Above Average
- Severe Thunderstorm Warnings - Above Normal
- During meteorological spring, 80 warnings on 12 days.
- This was above the 1986-2026 average of 33 warnings.
- The most on a calendar day was April 13 when 24 warnings were issued.
- During March, there were 3 warnings issued on 2 days. This was tied for the 7th most with 1988, 1990, 1991, 2012, and 2020. 1986-2026 average is 2.3 warnings.
- During April, there were 58 warnings issued on 6 days. This was the most in an April. The previous record was 50 warnings in 2002. 1986-2026 average is 9.7 warnings.
- During May, there were 19 warnings issued on 4 days. 1986-2026 average is 21 warnings.
|
.jpg) |
- Tornado Warnings - Most in Meteorological Spring
- During meteorological spring, 41 warnings on 6 days.
- This was above the 1986-2026 average of 4.7 warnings.
- The most on a calendar day was April 17 when 26 warnings were issued.
- During March, there were 0 warnings. 1986-2026 average is 0.3 warnings.
- During April, there were 36 warnings issued on 4 days. This was the most in an April. The previous record was 7 warnings in 2011 and 2022. 1986-2026 average is 1.7 warnings.
- During May, there were 5 warnings issued on 2 days. This was tied for 10th most in May with 1998 and 2008. 1986-2026 average is 2.8 warnings.
|
 |
- Daily Breakdown of Severe Weather in Meteorological Spring - 12 days
- April 17 - 35 warnings (9 Severe Thunderstorm Warnings & 26 Tornado Warnings)
- April 13 - 30 warnings (24 Severe Thunderstorm Warnings & 6 Tornado Warnings)
- April 14 - 21 warnings (18 Severe Thunderstorm Warnings & 3 Tornado Warnings)
- May 15 - 10 warnings (8 Severe Thunderstorm Warnings & 2 Tornado Warnings)
- May 17 - 10 warnings (7 Severe Thunderstorm Warnings & 3 Tornado Warnings)
- April 23 - 4 warnings (4 Severe Thunderstorm Warnings)
- May 27 - 3 warnings (3 Severe Thunderstorm Warnings)
- March 31 - 2 warnings (2 Severe Thunderstorm Warnings)
- April 15 - 2 warnings (2 Severe Thunderstorm Warnings)
- April 27 - 2 warnings (1 Severe Thunderstorm Warning & 1 Tornado Warning)
- March 10 - 1 warning (1 Severe Thunderstorm Warning)
- May 26 - 1 warning (1 Severe Thunderstorm Warning)
- April 17 was the 4th largest outbreak on a calendar day with 35 warnings - Greatest since May 17, 2017 (3rd most) - Most 48 warnings on April 18, 2002
- Most ever in April (94 warnings) - Previous record was 53 in 2002
- 2nd most ever in a month - Only June 1998 had more with 138 warnings.
|
 |
Below are the Meteorological Spring 2026 climate summaries for La Crosse, WI, and Rochester, MN.
La Crosse, WI
Meteorological Spring 2026 was Drier and Much Warmer than Normal in La Crosse WI
The 2026 meteorological spring (March 1 through May 31) was tied for the 10th warmest with 1921 and 2016. More details on these statistics can be found below.
Temperatures - Tied for 10th Warmest
- From March 1st through May 31st, La Crosse Regional Airport had an average temperature of 50.7°F.
- This was 2°F warmer than 1991-2020 normal of 48.6°F. This was tied with 1921 and 2016 for the 10th warmest spring.
- The table below lists the 20 warmest meteorological springs for La Crosse, WI.
Warmest Meteorological Springs
for La Crosse, WI
1873-2026
Rank Avg Temp Year
---- -------- ----
1 54.7°F 2012
2 53.9°F 1977
3 52.0°F 2010
52.0°F 1878
5 51.9°F 1987
6 51.4°F 1998
7 51.3°F 1946
8 51.1°F 2021
9 50.9°F 2000
10 50.7°F 2026
50.7°F 2016
50.7°F 1921
13 50.6°F 2024
50.6°F 1985
50.6°F 1910
15 50.5°F 1999
16 50.3°F 2007
50.3°F 1991
18 50.1°F 1986
19 50.0°F 1894
20 49.8°F 2015
49.8°F 2006
- 9 out of the 20 warmest springs have occurred since 2000. 8 out of the last 12 springs have been warmer than normal.
- The table below contains the monthly temperatures and their departures from normal for the spring of 2026.
Spring 2026 Temperatures
in La Crosse WI
Average Departure
Month Temperature from Normal
----- ----------- -----------
March 40.0°F +4.2°F
April 51.2°F +2.2°F
May 60.6°F -0.4°F
Spring 50.7°F +2.1°F - Tied with 1921 and 2016
for the 10th Warmest
- The average high temperature was 61.9°F. This was 2.8°F warmer than the 1991-2020 normal of 59.1°F. Tied with 2021 for the 7th warmest.
- The average low temperature was 39.4°F. This was +1.2°F warmer than the 1991-2020 normal of 38.2°F.
- The warmest high temperature was 90°F on May 26 and May 27.
- The coldest high temperature was 21°F on March 17.
- The warmest low temperature was 66°F on May 26.
- The coldest low temperature was 3°F on March 17.
- Maximum Temperature <= 32 on 4 Days
- Maximum Temperature >= 90 on 2 Days
- Minimum Temperature <= 32 on 28 Days
- Minimum Temperature <= 0 on 0 Days
Precipitation - Drier than Normal
- La Crosse Regional Airport received 8.59" of precipitation.
- This was 1.53" drier than the 1991-2020 spring normal of 10.12".
- The table below contains the monthly precipitation totals and their departures from normal for the spring of 2026.
Spring 2026 Precipitation
in La Crosse WI
Precipitation Departure
Month Total from Normal
----- ------------- -----------
March 2.09 inches +0.05 inches
April 5.32 inches +1.57 inches - 13th Wettest
May 1.18 inches -3.15 inches - 10th Driest
Spring 8.59 inches -1.53 inches
- The wettest day occurred on April 3 when 1.29" of precipitation fell.
- Since April 16 (second half of meteorological spring), only 2.34" of precipitation fell. This was the 11th driest. The driest occurred in 1934 when 0.98" of rain fell.
- Measurable precipitation fell on 32 days (34.8%) and trace amounts on another 15 days (16.3%).
Snowfall - Above Normal
- The snow observer near La Crosse Regional Airport recorded 12.1".
- This was 2.1" more than the 1991-2020 normal of 10.2".
- The table below contains the monthly snowfall totals and their departures from normal for the spring of 2026.
Spring 2026 Snowfall
in La Crosse WI
Snowfall Departure
Month Total from Normal
----- ------------- -----------
March 12.1 inches +4.8 inches
April Trace -2.9 inches
May 0.0 inches 0.0 inches
Spring 12.1 inches +2.1 inches
- The snowiest day occurred on March 15 when 7.2" of snow fell.
- Measurable snow fell on 6 days (6.5%) and trace amounts on another 3 days (3.3%).
- Greatest snow depth was 9" on March 16-18.
Mississippi River at La Crosse, WI - Below Average
- Average 7 am stage for meteorological spring was 6.47 feet.
- This was 0.85 feet below the 1937-2026 average of 7.32 feet.
- The lowest 7 am stage was 4.82 feet on March 3. The lowest meteorological spring 7 am stage was 3.52 feet on March 9, 1938.
- The highest 7 am stage was 9.02 feet on April 18. The highest meteorological spring am stage was 17.68 feet on April 22, 1965.
|
 |
Rochester, MN
Meteorological Spring 2026 was Drier and Much Warmer than Normal in Rochester, MN
The 2026 meteorological spring (March 1 through May 31) was unusually warm (tied with 2000 and 2024 for 9th warmest) and drier than normal for Rochester, MN. More details on these statistics can be found below.
Temperatures - Tied with 2000 and 2024 for the 9th Warmest
- From March 1st through May 31st, Rochester International Airport had an average temperature of 47.9°F.
- This was 3.1°F warmer than the 1991-2020 normal of 44.8°F. This was tied with 2000 and 2024 for the 9th warmest spring.
- The table below lists the 10 warmest meteorological springs for Rochester, MN.
Warmest Meteorological Springs
in Rochester, MN
1886-2026
Average
Rank Temperature Year
---- ----------- ----
1 53.8°F 2012
2 52.1°F 1977
3 50.1°F 2010
4 49.3°F 1987
5 48.8°F 1985
48.8°F 1946
7 48.1°F 2016
8 48.0°F 2025
9 47.9°F 2026
47.9°F 2024
47.9°F 2000
- The last 3 springs have been among the 10 warmest (2025 - 8th warmest, and 2024 and 2026 tied for the 10th warmest).
- 11 out of the 20 warmest meteorological springs have occurred since 2000.
- The table below contains the monthly temperatures and their departures from normal for the spring of 2026.
Spring 2026 Temperatures
in Rochester MN
Average Departure
Month Temperature from Normal
----- ----------- -----------
March 37.4°F +5.7°F - 12th Warmest
April 47.9°F +2.7°F
May 58.6°F +1.0°F
Spring 47.9°F +3.1°F - Tied for 10th Warmest
with 2000 and 2024
- The average high temperature was 58.6°F. This was 4.2°F warmer than the 1991-2020 normal of 54.4°F. This was the 11th warmest.
- The average low temperature was 37.3°F. This was 2.1°F warmer than the 1991-2020 normal of 35.2°F. This was the 11th warmest.
- The warmest high temperature was 88°F on May 26.
- The coldest high temperature was 18°F on March 16.
- The warmest low temperature was 65°F on May 26.
- The coldest low temperature was -3°F on March 17.
- Maximum Temperature <= 32 on 5 Days
- Maximum Temperature >= 90 on 0 Days
- Minimum Temperature <= 32 on 34 Days
- Minimum Temperature <= 0 on 1 Days
Precipitation - Drier than Normal
- Rochester International Airport received 7.39" of precipitation.
- This was 2.50" drier than the 1991-2020 normal of 9.89".
- The table below contains the monthly precipitation totals and their departures from normal for the spring of 2026.
Spring 2026 Precipitation
in Rochester MN
Precipitation Departure
Month Total from Normal
----- ------------- -----------
March 2.09 inches +0.07 inches
April 4.44 inches +0.92 inches
May 0.86 inches -3.49 inches - 2nd Driest
Spring 7.39 inches -2.50 inches
- Since April 16 (second half of meteorological spring), only 1.79" of precipitation fell. Only 1934 was drier with 0.40".
- The wettest day occurred on April 3 when 1.24" of rain fell.
- Measurable precipitation fell on 29 days (31.5%) and trace amounts fell on another 14 days (15.2%).
Snowfall - Near Normal
- The snow observer near Rochester International Airport recorded 12.6" of snow.
- This was 0.2" more than the 1991-2020 normal of 12.4".
- The table below contains the monthly snowfall totals and their departures from normal for the spring of 2026.
Spring 2026 Snowfall
in Rochester MN
Snowfall Departure
Month Total from Normal
----- ------------- -----------
March 12.6 inches +4.0 inches
April Trace -3.3 inches
May 0.0 inches -0.5 inches
Spring 12.6 inches +0.2 inches
- The snowiest day occurred on March 15 when 12.4" of snow fell.
- Measurable snow fell on 2 days (2.2%) and trace amounts fell on another 9 days (9.8%).
- Greatest snow depth was 12" on March 16.


 Weather Story
 Weather Map
 Local Radar