Upper Mississippi River Climate Summary for October 2025:
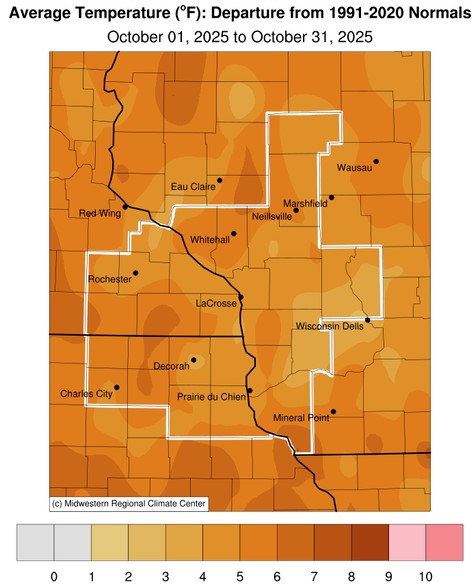
Temperatures - Above Normal
- During October 2025, average temperatures ranged from 49.5°F near Hillsboro, WI (COOP) and at Medford Taylor County Airport (AWOS) to 56.5°F at Guttenberg Lock & Dam 10, IA (COOP).
- Temperature anomalies ranged from 2°F to 6°F warmer than normal.
- The warmest temperature was 90°F on October 3 in Austin, MN (AWOS); Charles City, IA (AWOS); La Crosse, WI (ASOS); and Winona, MN (AWOS); and near Elkader, IA (COOP); and Theilman, MN (COOP).
- The coldest temperature was 20°F at Sparta Fort McCoy, WI (ASOS) on October 24 and near Hillsboro, WI on October 25.
|
 |
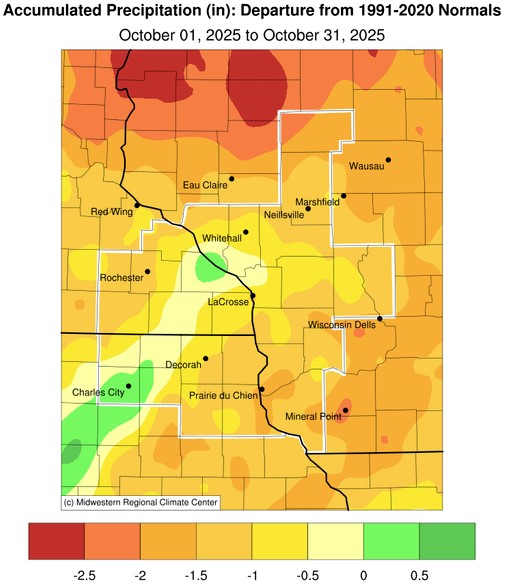
Rainfall - Mainly Below Normal
- Rainfall ranged from 0.87" near Rochester, MN (CoCoRaHS) to 3.41" near Nashua, IA (COOP).
- Rainfall anomalies ranged from 2" drier than normal to 1" wetter than normal.
- The wettest day was at Elma, IA (COOP) when 1.94" of rain fell from October 5 to October 6.
|
 |
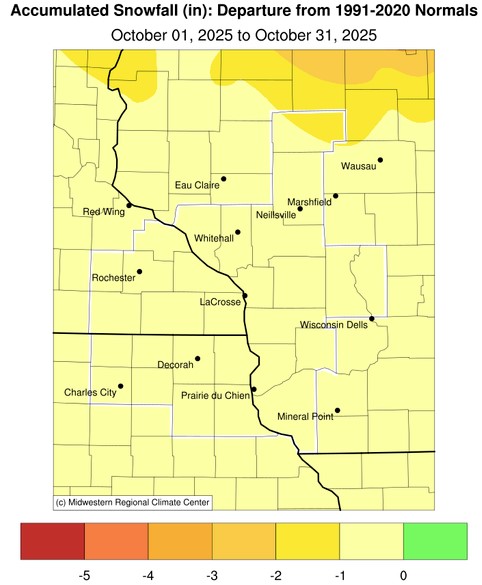
| Snowfall - Below Normal |
|
- No snow fell during the month.
- Typically a trace to 2" of snow falls during the month.
- The highest totals are typically north of Wisconsin Highway 29.
|
 |
Below are the October 2025 climate summaries for La Crosse, WI, and Rochester, MN.
La Crosse, WI
October 2025 was Warmer and Drier than Normal for La Crosse, WI
...October 2025 Highlights...
Temperatures - 24th Warmest
- The average temperature was 54.9°F at La Crosse Regional Airport.
- This was 3.2°F warmer than the 1991-2020 normal of 51.7°F.
- This was the 24th warmest October.
- 4 out of the 20 warmest Octobers have occurred since 2007. This includes the 5th warmest (2021), 11th warmest (2007), 13th warmest (2024) and 16th warmest (2016).
- The average high temperature was 64.8°F. This was 3.2°F warmer than the 1991-2020 normal of 61.6°F. This was the 25th warmest.
- The average low temperature was 45°F. This was 3.1°F warmer than the 1991-2020 normal of 41.9°F. This was the 23rd warmest.
- The warmest temperature was 90°F on October 3. This was only the 5th October day to reach or exceed 90°F. Other dates include October 6, 1963 (93°F); October 1, 1976 (92°F); October 3, 1997 (91°F); and October 1, 2023 (91°F).
- The coldest high temperature was 48°F on October 21.
- The warmest low temperature was 67°F on October 4.
- The coldest low temperature was 28°F on October 23.
- The low temperature fell below freezing on 3 days. The long-term average is 5.5 days.
Rainfall - Below Normal
- During October, 1.60" of rain fell at La Crosse Regional Airport.
- This was 0.89" below the 1991-2020 normal of 2.49".
- The wettest day was October 14 when 0.49" of rain fell.
- Measurable rain fell on 12 days (38.7%) and 6 other days (19.4%) had a trace of rain.
Snowfall - Tied for Least
- During October, 0" of snow was measured by the official NWS snow observer near La Crosse Regional Airport.
- This was 0.3" below the 1991-2020 normal of 0.3".
- This was tied for the least with 53 other Octobers.
- The last time measurable snow fell in an October was 2023 when 1.1" of snow fell.
Mississippi River - Below Average
- Average 7 AM stage was 4.98 feet. This was the lowest October average since 2012 (4.90 feet).
- This was 0.59 feet below the long-term average (1937-2025) of 5.57 feet.
- The highest 7 AM stage was 5.13 feet on October 8 & October 9. The highest 7 AM October stage was 13.06 feet on October 1, 1986.
- The lowest 7 AM stage was 4.86 feet on October 22. The lowest 7 AM October stage was 3 feet on October 4 & 5, 1947.
...October 2025 Records...
Daily...
- October 4 - New Record High - 89°F - Previous Record 88°F in 2005.
...Looking Ahead to November...
-
The normal high temperature in La Crosse starts off at 53°F on November 1st and falls to 38°F by the end of the month. The normal low temperature starts off at 35°F on the 1st and falls to 23°F by the end of the month. The warmest November temperature on record is 80°F on November 1, 1933, and the coldest is -21°F on November 29, 1875.
-
The normal mean temperature for November is 37.6°F. La Crosse’s warmest November occurred in 2001 with an average temperature of 47.5°F, and their coldest November occurred in 1880 with an average temperature of 25°F.
-
The normal November precipitation is 1.85". The wettest November occurred in 1934 with 7.01" of precipitation and the driest November occurred in 1976 with just a trace of precipitation (driest month ever in La Crosse). The wettest November day occurred on November 1, 1990, when 2.80" of precipitation fell. Normally, there is 1 day with thunderstorms.
-
The normal November snowfall is 3.4". The snowiest November occurred in 1991 with 30.3" of snow and the least snow was none in 1949 and 1999. The snowiest November day occurred on November 23, 1991, when 13" of snow fell.
.
Rochester, MN
October 2025 was Warmer and Drier than Normal at Rochester MN
...October 2025 Highlights...
Temperatures - 14th Warmest
- The average temperature was 52.8°F at Rochester International Airport.
- This was 4.9°F warmer than the 1991-2020 normal of 47.9°F.
- This was the 14th warmest October.
- 6 out of the 15 warmest Octobers have occurred since 2007. This includes 5th warmest (54.5°F - 2024), 6th warmest (54.4°F - 2007), 12th warmest (53.4°F - 2021), 13th warmest (53°F - 2011), 14th warmest (52.8°F - 2025) and 15th warmest (52.6°F - 2010). The table below lists the 20 warmest Octobers in Rochester.
- The table below contains the 20 warmest Octobers for Rochester, MN.
Warmest Octobers
for Rochester, MN
1886-2025
Average
Rank Temperature Year
---- ----------- ----
1 58.1°F 1963
2 57.8°F 1947
3 55.5°F 1956
4 54.6°F 1914
5 54.5°F 2024
6 54.4°F 2007
7 54.3°F 1953
8 53.9°F 1973
53.9°F 1950
10 53.5°F 1971
53.5°F 1931
12 53.4°F 2021
13 53.0°F 2011
14 52.8°F 2025
15 52.6°F 2010
16 52.5°F 1975
52.5°F 1949
52.5°F 1938
19 52.4°F 1934
20 52.2°F 1958
- The average high temperature was 62°F. This was 4.1°F warmer than the 1991-2020 normal of 57.9°F. This was the 25th warmest.
- The average low temperature was 43.6°F. This was 5.6°F warmer than the 1991-2020 normal of 38°F. This was the 8th warmest.
- The warmest temperature was 88°F on October 3.
- The coldest high temperature was 44°F on October 21.
- The warmest low temperature was 65°F on October 4.
- The coldest low temperature was 26°F on October 24.
- The low temperature fell below freezing on 3 days. The long-term average is 9.7 days.
Rainfall - Below Normal
- During October, 1.15" of rain fell at Rochester International Airport.
- This was 1.28" below the 1991-2020 normal of 2.43".
- The wettest day was October 14 when 0.43" of rain fell.
- Measurable rain fell on 9 days (29%) and 3 other days (9.7%) had a trace of rain.
Snowfall - Tied for Least
- During October, 0" of snow was measured by the official NWS snow observer near Rochester International Airport.
- This was 0.3" below the 1991-2020 normal of 0.9".
- This was tied for the least with 28 other Octobers.
- The last time measurable snow fell in an October was 2023 when 1.6" of snow fell.
...October 2025 Records...
Daily...
- October 4 - New Record High - 86°F - Previous Record 84°F in 2005
...Looking Ahead to November...
- The normal high temperature in Rochester starts off at 49°F on November 1st and falls to 34°F by the end of the month. The normal low temperature starts off at 32°F on the 1st and falls to 19°F by the end of the month. The warmest November temperature on record is 77°F on November 1, 1893, and the coldest is -24°F on November 28, 1887.
- The normal mean temperature for November is 33.6°F. Rochester’s warmest November occurred in 2001 with an average temperature of 45.4°F, and its coldest November occurred in 1985 with an average temperature of 22.9°F.
- The normal November precipitation is 1.80". The wettest November occurred in 1909 with 5.91" of precipitation and the driest November occurred in 1917 with only 0.01". The wettest November day occurred on November 1, 1991, when 2.30" of precipitation fell. Normally, there is 1 day with thunderstorms.
- The normal November snowfall is 4.5". The snowiest November occurred in 1985 with 22.5" of snow and the least snow was none in 1913 and 1939. The snowiest November day occurred on November 30, 1934, when 12" of snow fell.


 Weather Story
 Weather Map
 Local Radar