Upper Mississippi River Climate Summary for September 2026:
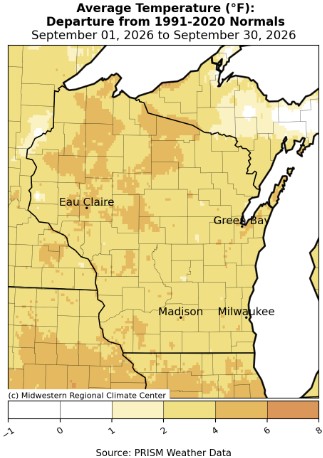
Temperatures - Above Normal
- During September 2026, average temperatures ranged from 61°F at Medford Taylor County Airport (AWOS) to 68.1°F at Guttenberg Lock & Dam 10, IA (COOP).
- Temperature anomalies ranged from 1°F to 6°F warmer-than-normal.
- There was a 60°F difference between the warmest and coldest temperatures in the Upper Mississippi River Valley.
- The warmest temperature was 94°F near Neillsville, WI on September 1 and near Theilman on September 4. Meanwhile, the coldest temperature was 34°F at Black River Falls, WI (ASOS) on September 14.
|
 |
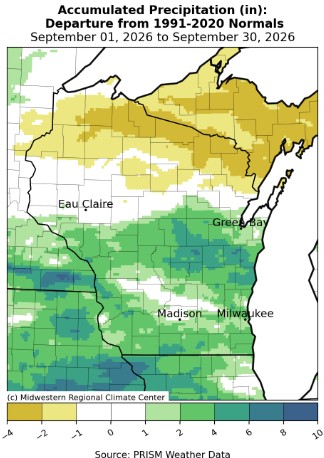
Rainfall - Highly Variable
- Rainfall totals varied from 2.61" near Owen, WI (COOP) to 12.38" at Spring Valley, MN (COOP).
- Rainfall anomalies ranged from 2" drier than normal to 10" wetter than normal.
- The highest one-day precipitation was 8.29" near Houston, MN from September 18 to September 19.
|
 |
| Severe Weather - Above Normal |
|
- Convective Warnings - Above Average
- There were 19 convective (severe thunderstorm, tornado, and flash flood) warnings.
- This was 7 warnings above the 1986-2026 longterm average of 12 warnings.
- This was the 8th most in a September and the most since 2019 (43 warnings - 2nd most).
- The greatest number of convective warnings in a September was 57 warnings in 2016.
- Severe Thunderstorm Warnings - Above Average
- There were 13 severe thunderstorm warnings.
- This was 4 warnings above the 1986-2026 longterm average of 9 warnings.
- The greatest number of severe thunderstorms warnings in a September was 48 warnings in 2006.
|
 |
- Tornado Warnings - Average
- There was 1 tornado warning.
- This was the same as the 1986-2026 longterm average.
- This was tied for 8th most in a September with 1986, 1988, 1991, 1994, 1998, 2000, 2005, and 2012.
- The greatest number of tornado warnings in a September was 7 warnings in 2019.
- Flash Flood Warnings - Above Average
- There were 5 flash flood warnings.
- This was 3 warnings above the 1986-2026 longterm average of 2 warnings.
- This was the 6th most in a September.
- The greatest number of flash flood warnings in a September was 34 warnings in 2016.
|
Below are the September 2026 climate summaries for La Crosse, WI, and Rochester, MN.
La Crosse, WI
September 2026 was Warmer (20th Warmest) and Wetter (Tied for 15th Wettest) than Normal for La Crosse, WI
...September 2026 Highlights...
Temperatures - 20th Warmest
- During September 2026, the average temperature at La Crosse Regional Airport was 66.7°F.
- This was 1.9°F warmer than the 1991-2020 average of 64.8°F.
- This September was the 20th warmest September.
- During the past 12 years, 6 out of the 10 warmest Septembers have occurred.
- 12 out of 20 warmest Septembers have occurred since 2004. This includes the warmest (2015 - 69.3°F), 2nd warmest (2019 - 69.1°F), 3rd warmest (2017 - 68.8°F), 5th warmest (2023 - 68.6°F), 8th warmest (2024 - 68°F), 11th warmest (2016 - 67.7°F), 14th warmest (2004 & 2021 - 67.2°F), 16th warmest (2005 - 67.1°F), 17th warmest (2013 - 67°F), 19th warmest (2025 - 66.8°F), and 20th warmest (2026 - 66.7°F).
- Below are the 20 warmest Septembers in La Crosse, WI.
20 Warmest Septembers
in La Crosse, WI
1873-2026
Average
Rank Temperature Year
---- ----------- ----
1 69.3°F 2015
2 69.1°F 2019
3 68.8°F 2017
68.8°F 1998
5 68.6°F 2023
6 68.5°F 1931
7 68.3°F 1978
8 68.0°F 2024
9 67.9°F 1908
10 67.8°F 1897
11 67.7°F 2016
12 67.6°F 1895
13 67.4°F 1891
14 67.2°F 2021
67.2°F 2004
16 67.1°F 2005
17 67.0°F 2013
67.0°F 1884
19 66.8°F 2025
20 66.7°F 2026
- The average high temperature was 74.9°F. This was 0.6°F cooler than the 1991-2020 normal of 75.5°F.
- The average low temperature was 58.4°F. This was 4.3°F warmer than the 1991-2020 normal of 54.1°F. This was the 6th warmest.
- The warmest high temperature was 90°F on September 1.
- The coldest high temperature was 63°F on September 21 and September 27.
- The warmest low temperature was 74°F on September 4.
- The coldest low temperature was 44°F on September 23.
Rainfall - Tied for the 15th Wettest with 1992
- A total of 7.01" of rain fell.
- This was 3.38" wetter than the 1991-2020 average of 3.63".
- This was tied with 1992 the 15th wettest September.
- Below are the 20 wettest Septembers in La Crosse, WI.
20 Wettest Septembers
in La Crosse, WI
1873-2026
Rank Rainfall Year
---- -------- ----
1 10.87 inches 2015
2 10.52 inches 1965
3 10.46 inches 2016
4 10.01 inches 1884
5 9.84 inches 1901
6 9.04 inches 1934
7 8.51 inches 1980
8 8.10 inches 1986
9 7.60 inches 1908
10 7.40 inches 1946
11 7.34 inches 1941
12 7.15 inches 1925
13 7.11 inches 1906
14 7.03 inches 2010
15 7.01 inches 2026
7.01 inches 1992
17 6.92 inches 2005
18 6.86 inches 1942
19 6.77 inches 2019
20 6.72 inches 1972
- The wettest day occurred on September 18 when 2.20" of rain fell.
- Measurable rain fell on 14 days (46.7%) and trace amounts fell on another 4 days (13.3%).
Mississippi River at La Crosse, WI - Below Average
- During September, the Mississippi River at La Crosse had an average 7 AM stage of 5.15 feet.
- This 0.3 feet below the 1937-2026 average of 5.45 feet.
- The lowest 7 AM stage was 4.85 feet on September 8.
- The highest 7 AM stage was 6.07 feet on September 22.
...September 2026 Records...
- September 4 - Record Warm Low - 74°F - previous record was 73°F in 1960 and 2014
- September 18 - Rainfall - 2.20" - previous record was 1.60" in 1942
...Looking Ahead to October...
- The normal high temperature in La Crosse starts off at 69°F on October 1st and falls to 54°F by the end of the month. The normal low temperature starts off at 47°F on the 1st and falls to 36°F by the end of the month. The warmest October temperature on record is 93°F on October 6, 1963, and the coldest is 6°F on October 25, 1887.
- The normal mean temperature for October is 51.7°F. La Crosse’s warmest October occurred in 1963 with an average temperature of 61.2°F, and its coldest October occurred in 1917 with an average temperature of 39.4°F.
- The normal October precipitation is 2.49". The wettest October occurred in 1881 with 12.09" of precipitation (second wettest month - only August 2007 was wetter with 13.75") and the driest October occurred in 1952 with only 0.02" of precipitation (third driest month - only November 1976 with a trace and December 1943 with 0.01" were drier). The wettest October day occurred on October 28, 1900, when 4.89" of rain fell (4th wettest calendar day). Normally, there are 2 days with thunderstorms.
- The normal October snowfall is 0.3". The snowiest October occurred in 1917 with 7" of snow. The snowiest October day occurred on October 28, 1917, when 4.7" of snow fell.
Rochester, MN
September 2026 was Warmer (14th Warmest) and Wetter (16th Wettest) than Normal for Rochester, MN
...September 2026 Highlights...
Temperatures - 14th Warmest
- During September 2026, the average temperature at Rochester International Airport was 64.2°F.
- This was 3.1°F warmer than the 1991-2020 average of 61.1°F.
- This was tied for the 14th warmest September with 2017.
- During the past 12 Septembers, 5 out of the 10 warmest Septembers have occurred.
- 16 out of 26 warmest Septembers have occurred since 2004. This includes the 3rd warmest (2023 - 66.3°F), 4th warmest (2015 - 66.2°F), 5th warmest (2024 - 65.4°F), 8th warmest (2019 - 65.1°F), 9th warmest (2005 - 64.7°F), 10th warmest (tied with 2004, 2016, and 2025 - 64.4°F), 14th warmest (2026 - 64.2°F), 15th warmest (2017 - 64.1°F), 16th warmest (2013 - 64°F), 19th warmest (2007 - 63.9°F), 23rd warmest (2018 and 2021 - 63.1°F), and 25th warmest (2008 and 2009 - 62.6°F).
- The table below contains the 20 warmest Septembers for Rochester, MN.
20 Warmest Septembers
in Rochester MN
1886-2025
Average
Rank Temperature Year
---- ----------- ----
1 69.6°F 1908
2 66.9°F 1931
3 66.3°F 2023
4 66.2°F 2015
5 65.4°F 2024
6 65.3°F 1948
7 65.2°F 1933
8 65.1°F 2019
9 64.7°F 2005
10 64.4°F 2025
64.4°F 2016
64.4°F 2004
64.4°F 1998
14 64.1°F 2026
64.1°F 2017
16 64.0°F 2013
64.0°F 1939
64.0°F 1919
19 63.9°F 2007
20 63.7°F 1978
- The average high temperature was 71.8°F. This was the same as the 1991-2020 normal of 71.8°F.
- The average low temperature was 56.6°F. This was 6.2°F warmer than the 1991-2020 normal of 50.4°F. This was the 2nd warmest. Only 1908 was warmer with an average of 57.3°F
- The warmest high temperature was 89°F on September 4.
- The coldest high temperature was 59°F on September 21.
- The warmest low temperature was 71°F on September 4.
- The coldest low temperature was 45°F on September 14 and September 23.
Rainfall - 16th Wettest
- A total of 6.22" of rain fell.
- This was 2.62" wetter than the 1991-2020 average of 3.60"
- This was the 16th wettest September.
- Below are the 20 wettest Septembers in Rochester, MN.
20 Wettest Septembers
in Rochester MN
1886-2026
Rank Rainfall Year
---- -------- ----
1 10.50 inches 1986
2 9.95 inches 2010
3 9.10 inches 2016
4 8.35 inches 2019
5 8.08 inches 1978
6 7.95 inches 1938
7 7.58 inches 2018
8 7.50 inches 1942
9 7.40 inches 2007
10 7.13 inches 2005
11 7.06 inches 1972
12 6.47 inches 1946
13 6.41 inches 1985
14 6.32 inches 2041
15 6.26 inches 1965
16 6.22 inches 2026
17 5.99 inches 1964
18 5.88 inches 1934
19 5.84 inches 1973
20 5.80 inches 2004
- The wettest day occurred on September 18 when 2.35" of rain fell.
- Measurable rain fell on 12 days (40%) and trace amounts fell on another 5 days (16.7%).
...September 2026 Records...
- September 4 - Record Warm Low - 71°F - Previous Record was 70°F in 2015
- September 18 - Record Rain - 2.35" - Previous Record was 1.26" in 2003
...Looking Ahead to October...
- The normal high temperature in Rochester starts off at 66°F on October 1st and falls to 50°F by the end of the month. The normal low temperature starts off at 44°F on the 1st and falls to 32°F by the end of the month. The warmest October temperature on record was 93°F on October 3, 1997, and the coldest was -6°F on October 25, 1887.
- The normal mean temperature for October is 47.9°F. Rochester’s warmest October occurred in 1963 with an average temperature of 58.1°F, and its coldest October occurred in 1917 with an average temperature of 37.6°F.
- The normal October precipitation is 2.43". The wettest October occurred in 1911 with 9.11" of precipitation and the driest October occurred in 1952 with only 0.01" of precipitation. The wettest October day occurred on October 6, 1911, when 2.85" of precipitation fell. Normally, there are 2 days with thunderstorms.
- The normal October snowfall is 0.9". The snowiest October occurred in 2009 with 7.9" of snow. The snowiest October day occurred on October 22, 1979, when 5" of snow fell.



 Weather Story
 Weather Map
 Local Radar
 Follow us on X
 Follow us on Facebook
 Follow us on YouTube
 ARX RSS Feed