Severe Weather Climatology
for the La Crosse Forecast Area
 |
 |
 |
 |
 |
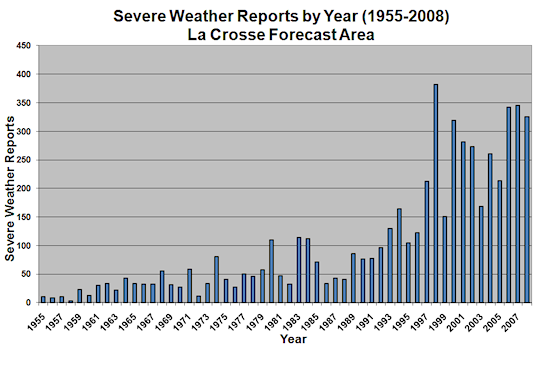
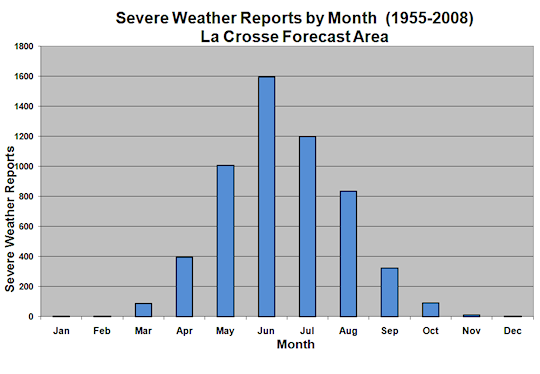
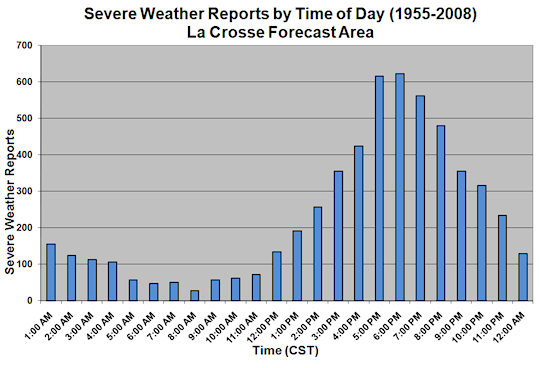
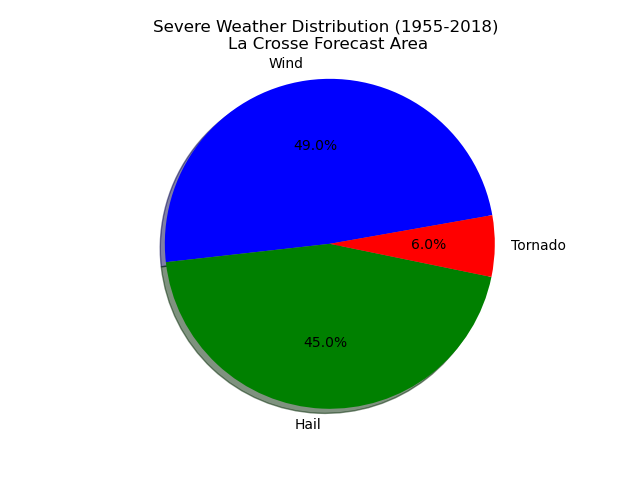
| Total severe weather reports recorded by year from 1955 to 2018. The amount of severe weather reports has increased during the period, mainly because the reporting of hail and severe wind has greatly increased. Factors that play a role in the increased reporting are population growth, expansion of cities and overall better communication with people in the areas where severe weather occurred. | Severe weather reports from 1955 to 2018 displayed by the month in which they occurred. Most severe weather occurs during the late spring and summer months. | Severe weather reports displayed by the time of day when they occurred. The primary peak of severe weather is during the late afternoon and evening hours. A second peak can also be seen around midnight. | Percentage of severe weather reports from 1955 to 2018 by type. Large hail and wind gusts of 58mph+ are fairly even. | Recent percentage of severe weather reports from 2009 to 2018 by type. Large hail and wind gusts of 58mph+ are fairly even. |
 |
 |
 |
 |
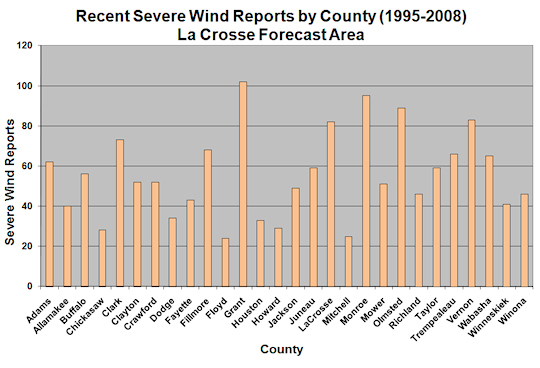 |
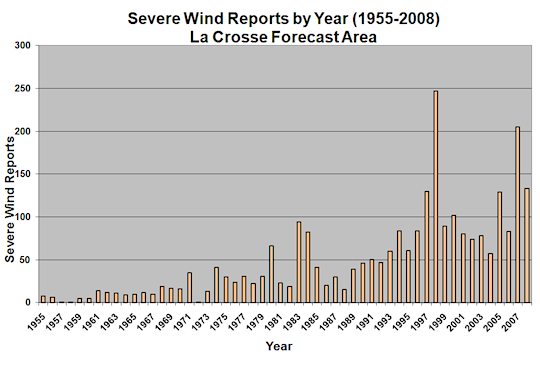
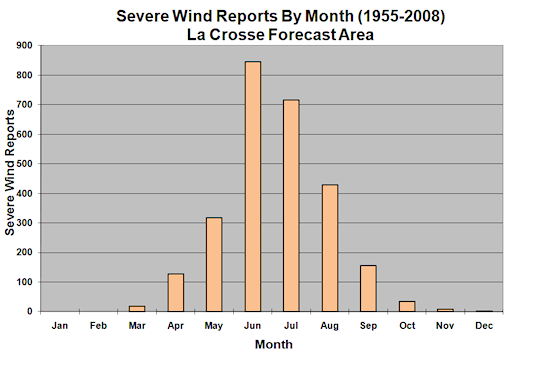
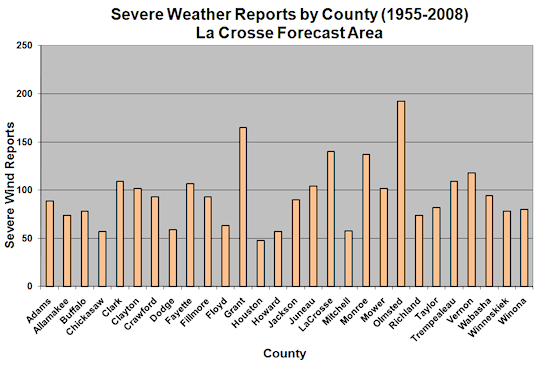
| Total severe wind reports recorded from 1955 to 2018 displayed by year. Recent years have more events because more severe wind has been reported. | Severe wind reports from 1955 to 2018 displayed by the month in which they occurred. Most severe wind occurs during the late spring and summer months. The peak month for severe wind is June. | Severe wind reports displayed by the time of day when they occurred. The primary peak of severe wind is during the late afternoon and evening hours. A second peak can also be seen around midnight. | Severe wind reports from 1955 to 2018 displayed by the county in which they occurred. More severe wind is reported in the counties of Olmsted and Grant than any other counties in the La Crosse forecast area. | Severe wind reports from 2009 to 2018 displayed by the county in which they occurred. Recently Monroe county as well as Olmsted and Grant have had the highest amounts of severe wind reports. |
 |
 |
 |
 |
 |
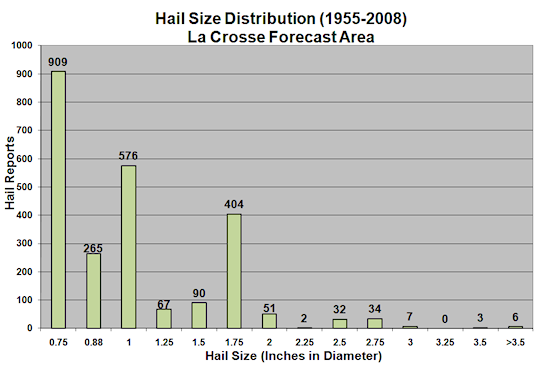 |
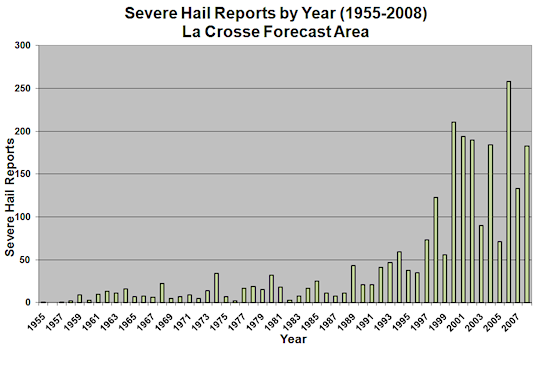
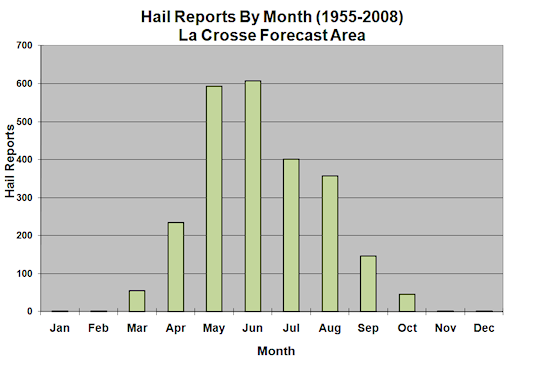
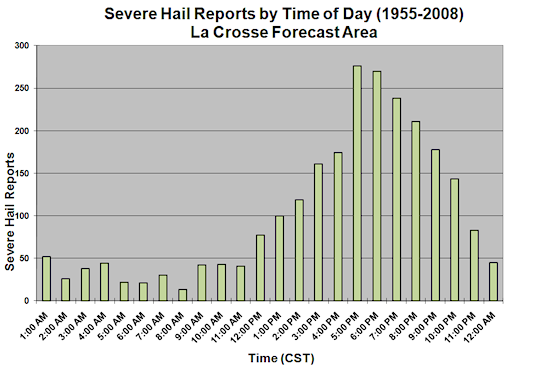
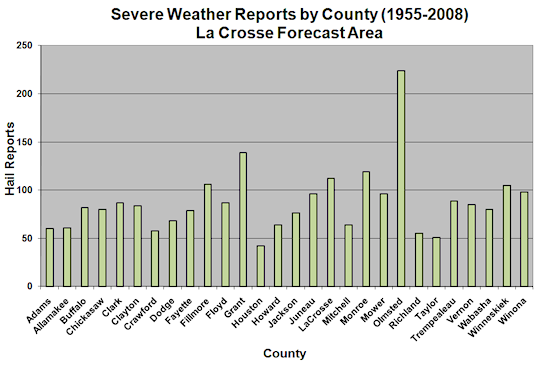
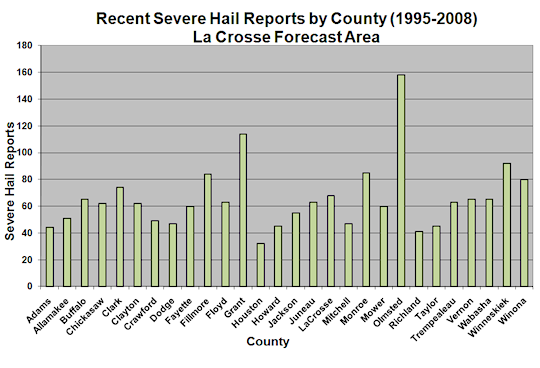
| Total hail reports recorded from 1955 to 2018 displayed by year. Recent years have more events because more hail has been reported (e.g., population increase, better spotter organization, efforts to solicit reports). | Hail reports from 1955 to 2018 displayed by the month in which they occurred. Most hail occurs during the late spring and summer months. The peak month for hail is May with June a very close second. | Hail reports displayed by the time of day when they occurred. The primary peak of hail is during the late afternoon and evening hours. | Hail reports from 1955 to 2018 displayed by the county in which they occurred. More hail is reported in the counties of Olmsted and Grant than any other counties in the La Crosse forecast area. | Hail reports from 2009 to 2018 displayed by the county in which they occurred. Recently more severe wind has reported in the counties of Olmsted and Grant than any other counties in the La Crosse forecast area. | Hail reports from 1955 to 2018 categorized by the diameter of the hail in inches. The most common size of hail is .75 inches in diameter. This is often referred to being close to the size of a penny. |
 |
 |
 |
 |
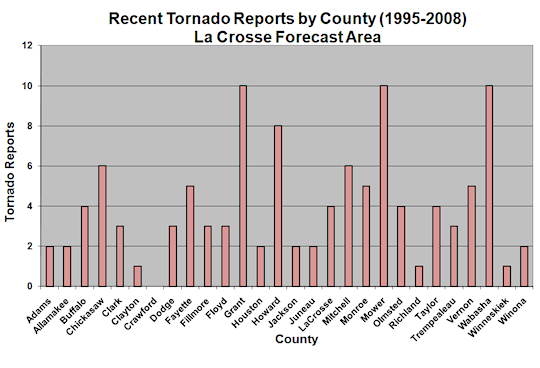 |
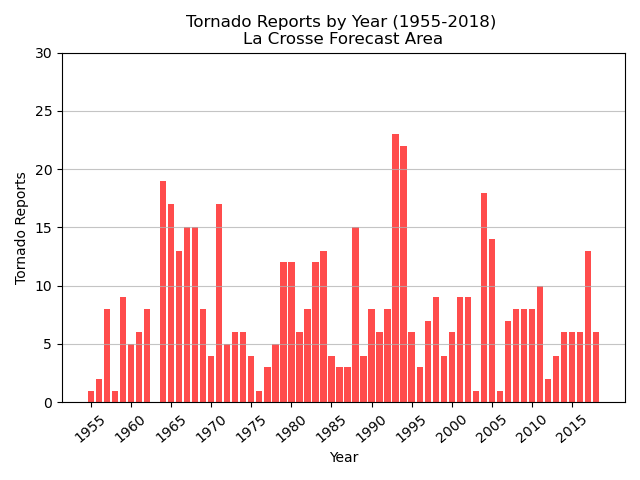
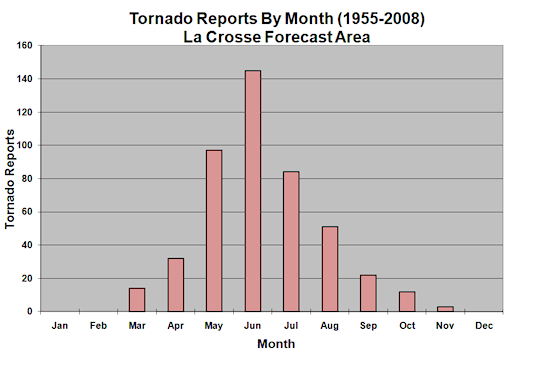
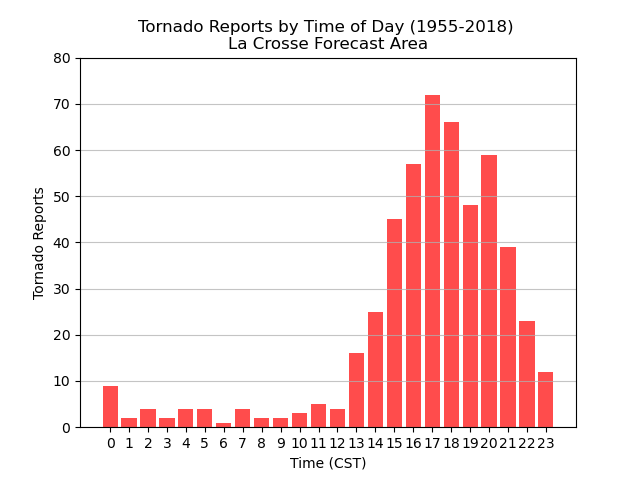
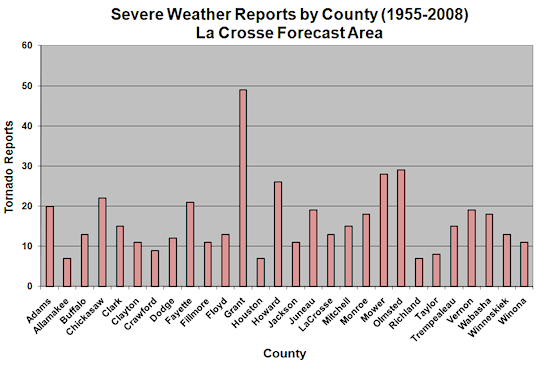
| Total tornado reports recorded from 1955 to 2018 displayed by year. 1993 has the highest number of tornado reports. On June 8th of that year 13 tornadoes total were recorded. This is ranked #1 in the top 10 largest outbreaks of the La Crosse forecast area. | Tornado reports from 1955 to 2018 displayed by the month in which they occurred. Most tornadoes occur during the late spring and summer months. The peak month for tornadoes is June. | Tornado reports displayed by the time of day when they occurred. The primary peak of tornadoes is during the late afternoon and evening hours. | Tornado reports from 1955 to 2018 displayed by the county in which they occurred. | Tornado reports from 2009 to 2018 displayed by the county in which they occurred. |
 |
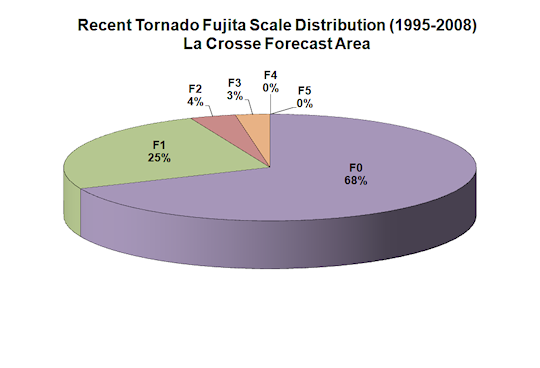 |
| Percentage of tornado reports from 1955 to 2018 categorized by their strength on the Fujita scale. F0 is the most common strength of tornado reported. | Recent tornado reports categorized by Fujita scale (2009-2018). |
 |
 |
 |
 |
 |
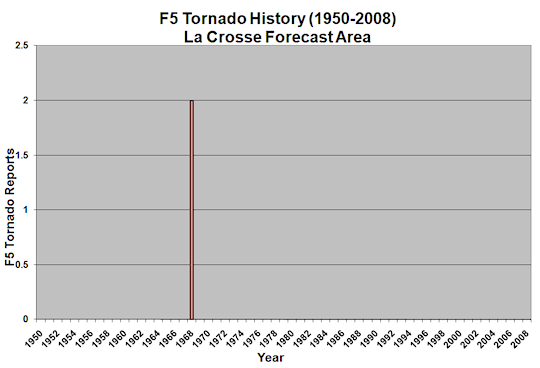 |
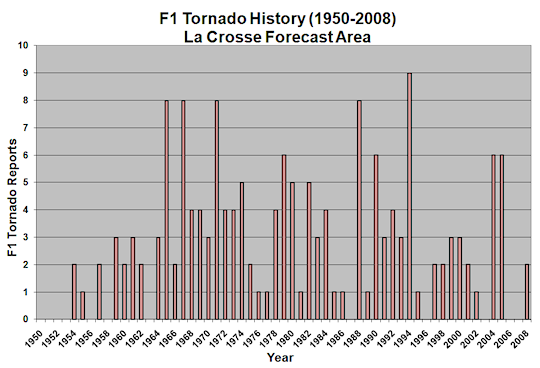
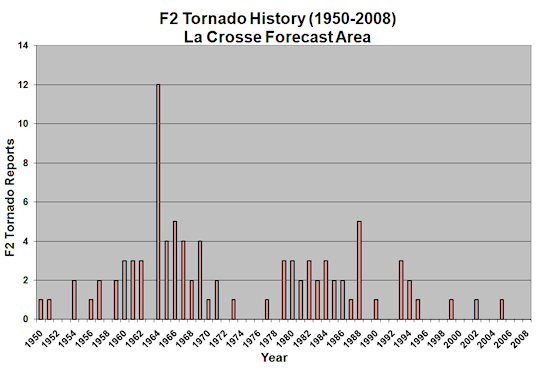
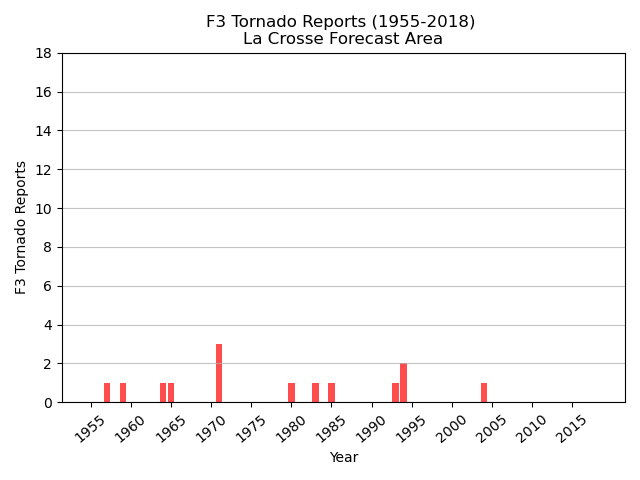
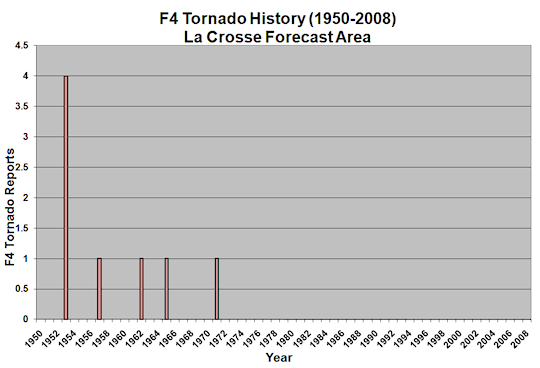
| F0 tornadoes recorded from 1955 to 2018. 1993 had the most F0 tornadoes with a total of 16 reported. | F1 tornadoes recorded from 1955 to 2018. 1994 had the most F1 tornadoes with a total of 10 reported. | F2 tornadoes recorded from 1955 to 2018. 1964 had the most F2 tornadoes with a total of 13 reported. | F3 tornadoes recorded from 1955 to 2018. The most F3 tornadoes reported as 3 in 1971. | F4 tornadoes recorded from 1955 to 2018. | F5 tornadoes recorded from 1955 to 2018. 1968 was the only year an F5 tornado was recorded. That year 2 of them were reported on May 15. |


 Weather Story
 Weather Map
 Local Radar