Binghamton, NY
Weather Forecast Office
A storm system moved across the northeast part of the country on November 16 and 17, 2006. This produced very heavy rainfall and damaging winds across parts of Central New York and Northeast Pennsylvania. The very heavy rainfall produced flash flooding in many locations across the area.
The graphic below is a Multisensor Precipitation Estimates map, otherwise known as MPE data. The data used to produce this graphic is a combination of radar and precipitation gages. Click on the image below for a larger view.
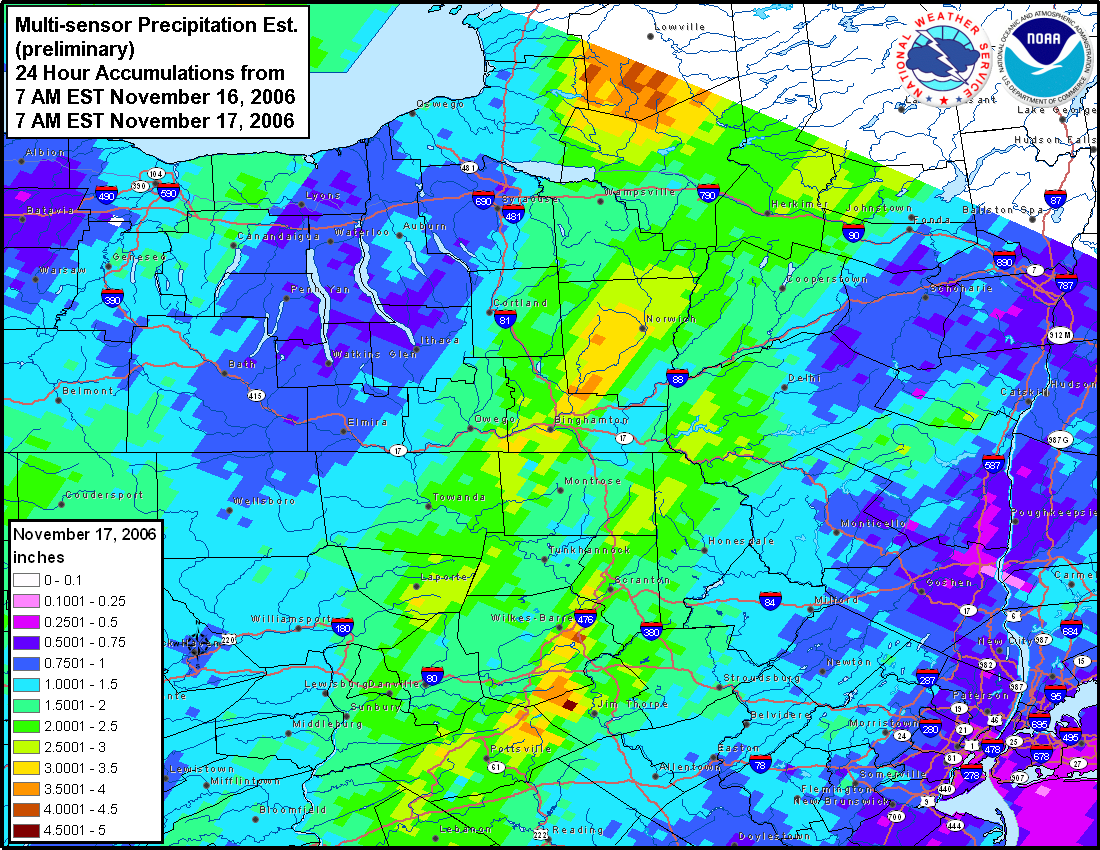
When using MPE data, it is important to remember it is vulnerable to the same inaccuracies that can be caused by either radar or precipitation gages. For radar, problems would be: freezing or frozen precipitation, low topped convection, bright banding, the reflectivity/rainfall relationship in use, calibration of the radar, radar location and elevation, range degradation, and the radar's effective coverage. For precipitation gages, problems come from freezing precipitation, windy conditions, gage siting, undermeasurement by tipping bucket gages in high intensity rainfall, and gage maintenance.
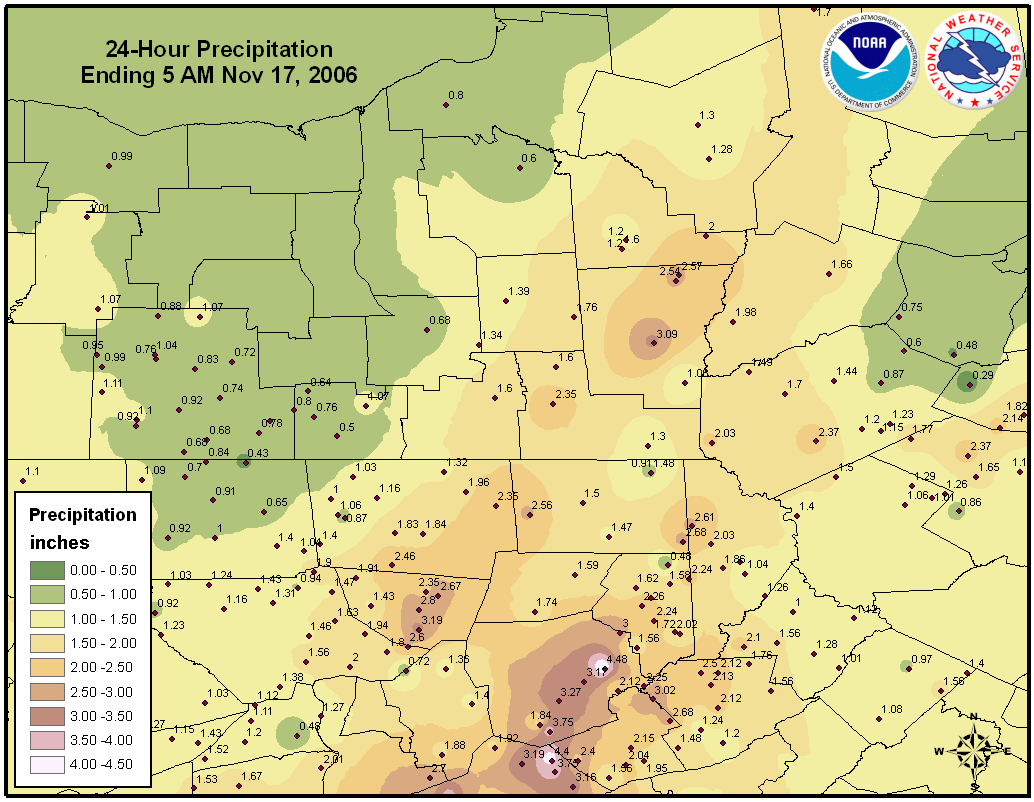
Below is a graphic of rainfall reports from highway departments, cooperative observers, SKYWARN spotters and media.
Current Hazards
Briefing
Drought
Fire Weather
Graphical Hazardous Weather Outlook
Hurricanes
Local Outlook
River Flooding
Space Weather
Thunderstorms
Winter
Current Conditions
Air Quality
Local Storm Reports
Observation (list)
Observations (Map)
More Surface Observations
Rainfall
Satellite
More Satellite
Upper Air
Radar
Local Enhanced Radar
Local Standard Radar (low bandwidth)
Regional/National Standard Radar (low bandwidth)
More Radar
Forecasts
Activity Planner
Aviation
Fire Weather
Forecaster's Discussion
HeatRisk
Hourly View
Map View
Model Data
NWS GIS Viewer
Space Weather
Text Products
Rivers and Lakes
River Observation/Forecasts (Map)
River Forecast Centers
County Flash Flood Guidance
Current Streamflow
Ensemble River Guidance
Flood Inundation Maps
US Dept of Commerce
National Oceanic and Atmospheric Administration
National Weather Service
Binghamton, NY
32 Dawes Drive
Johnson City, NY 13790
(607) 729-1597
Comments? Questions? Please Contact Us.

