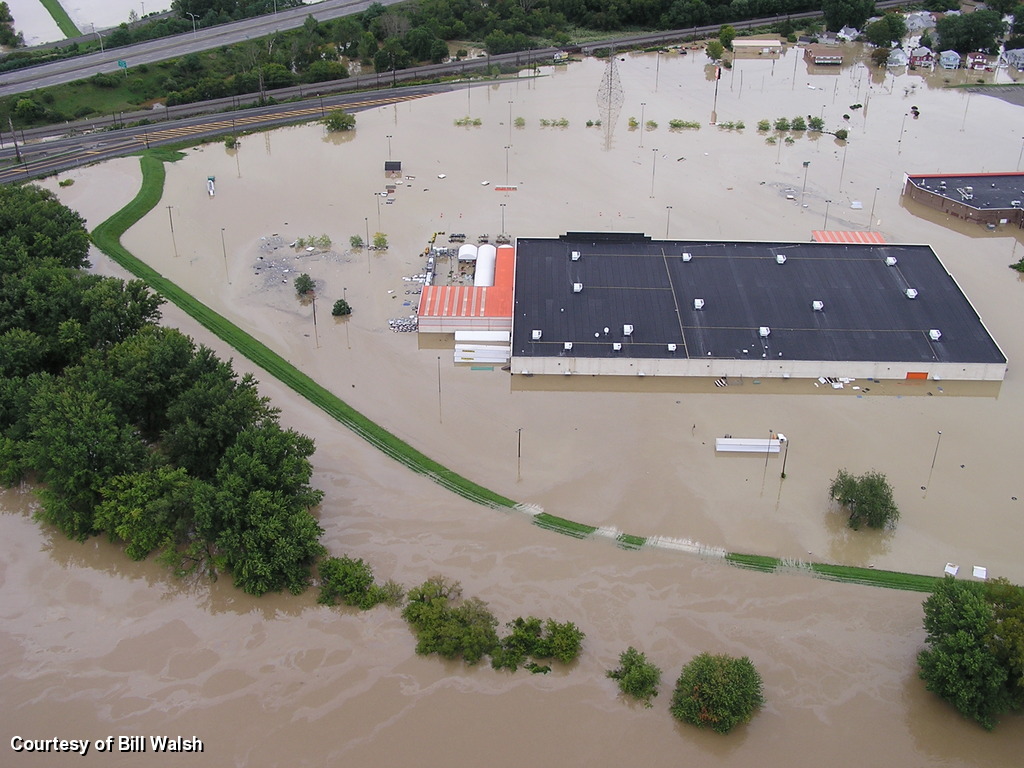
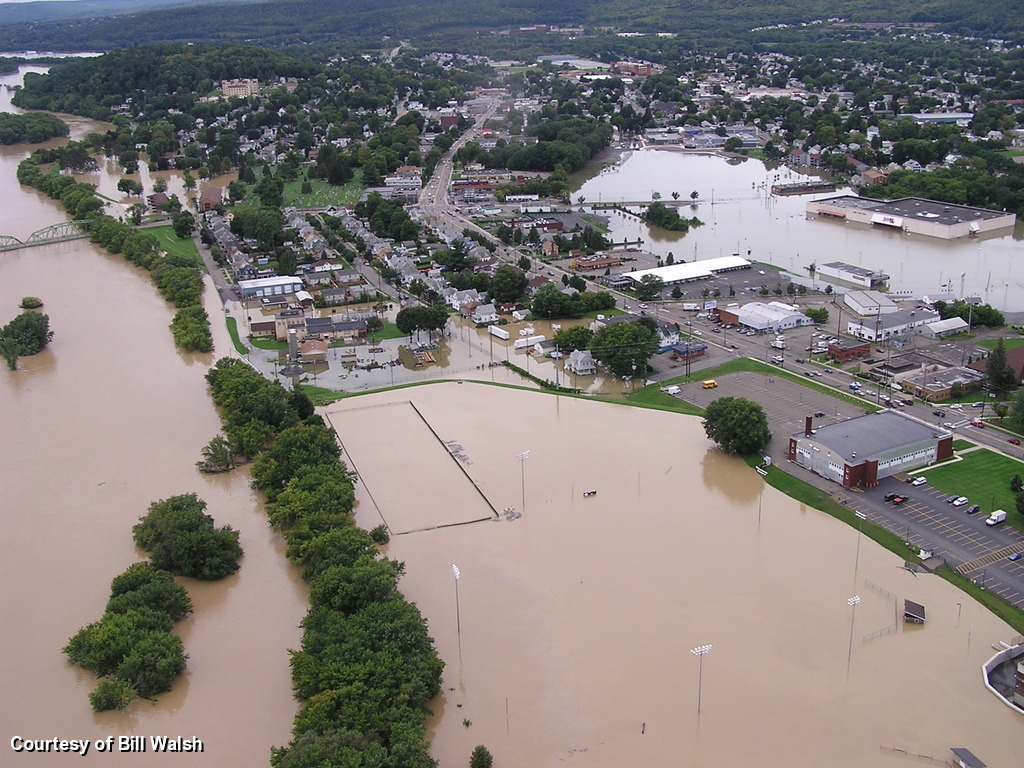
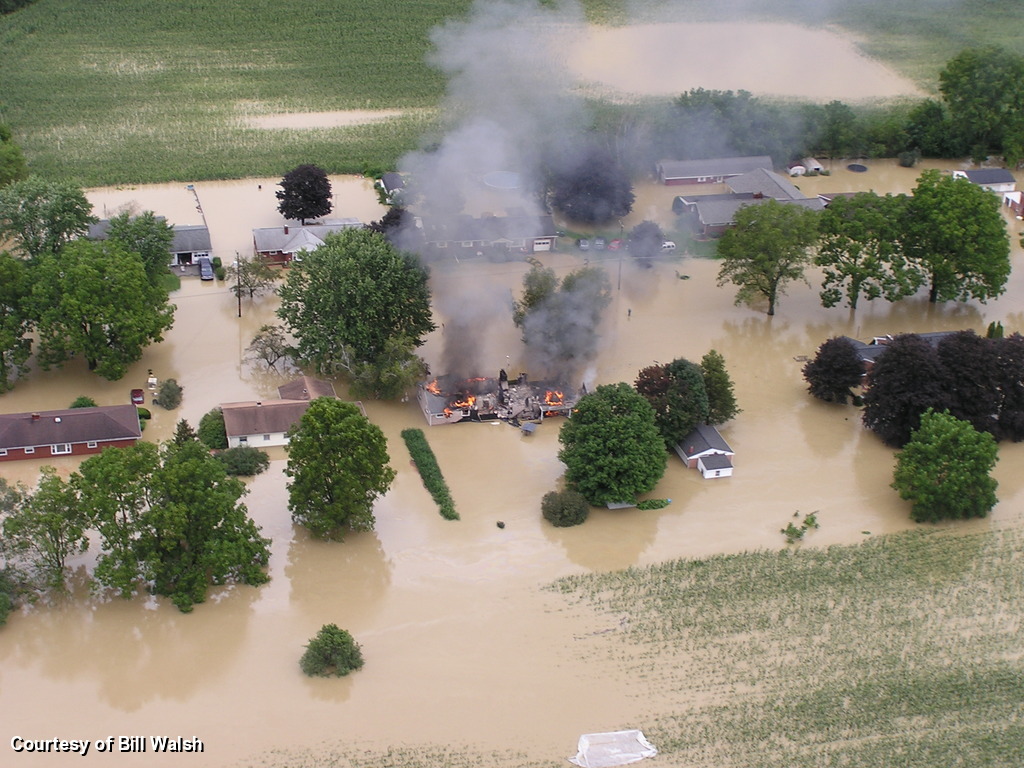
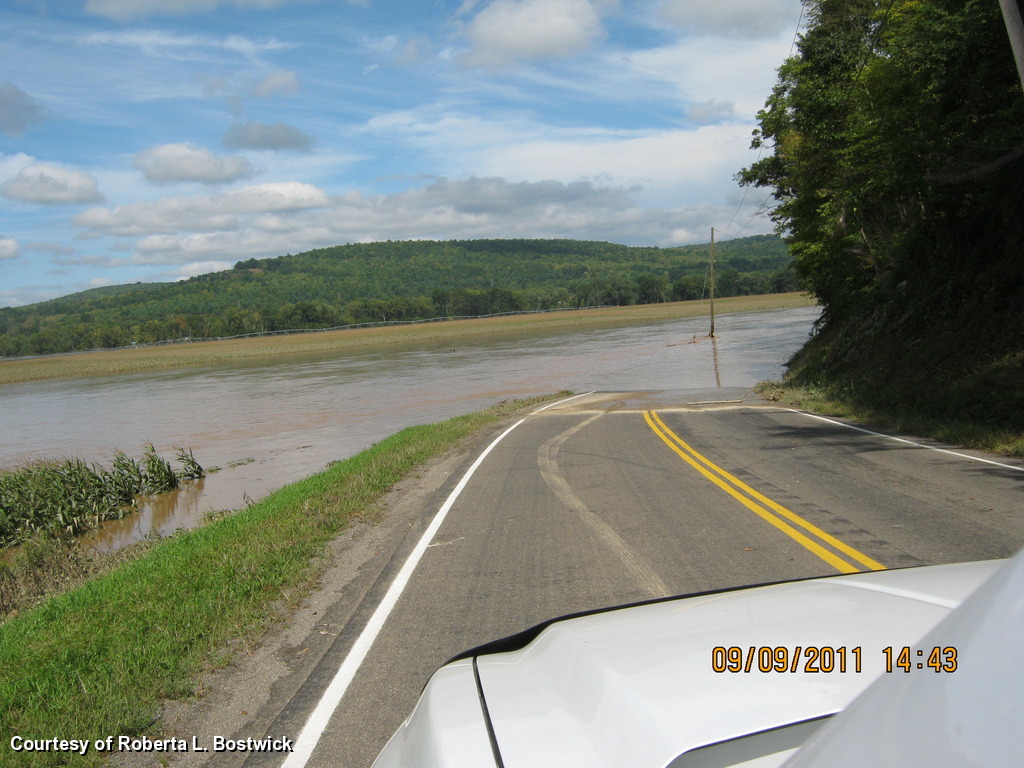
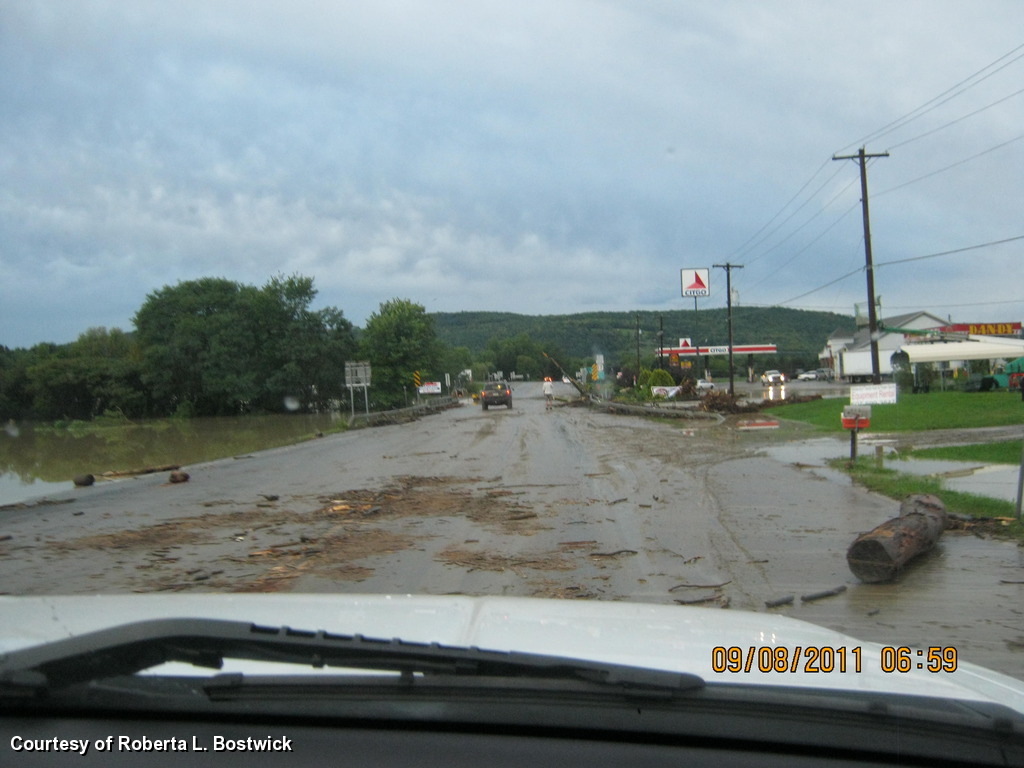
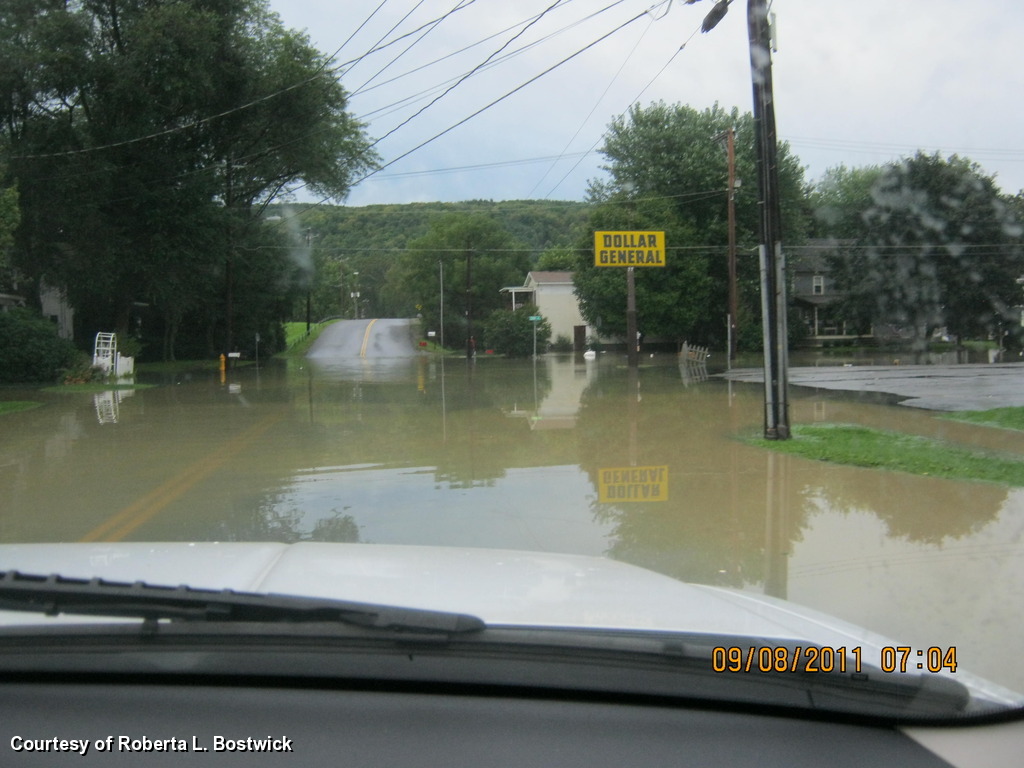
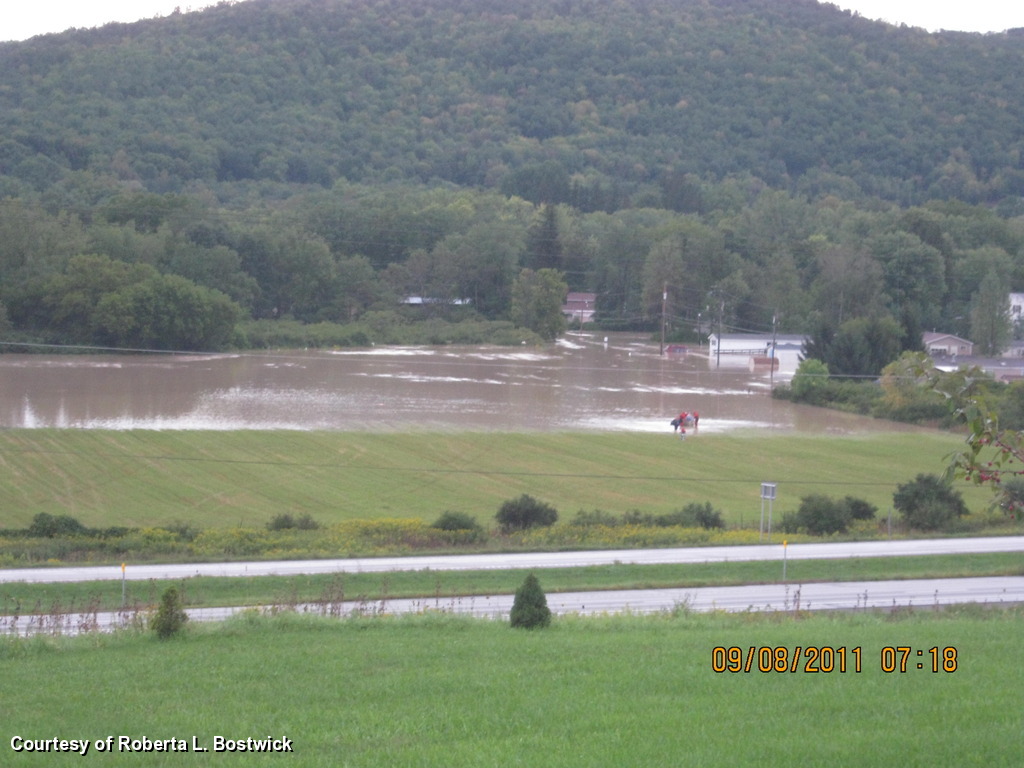
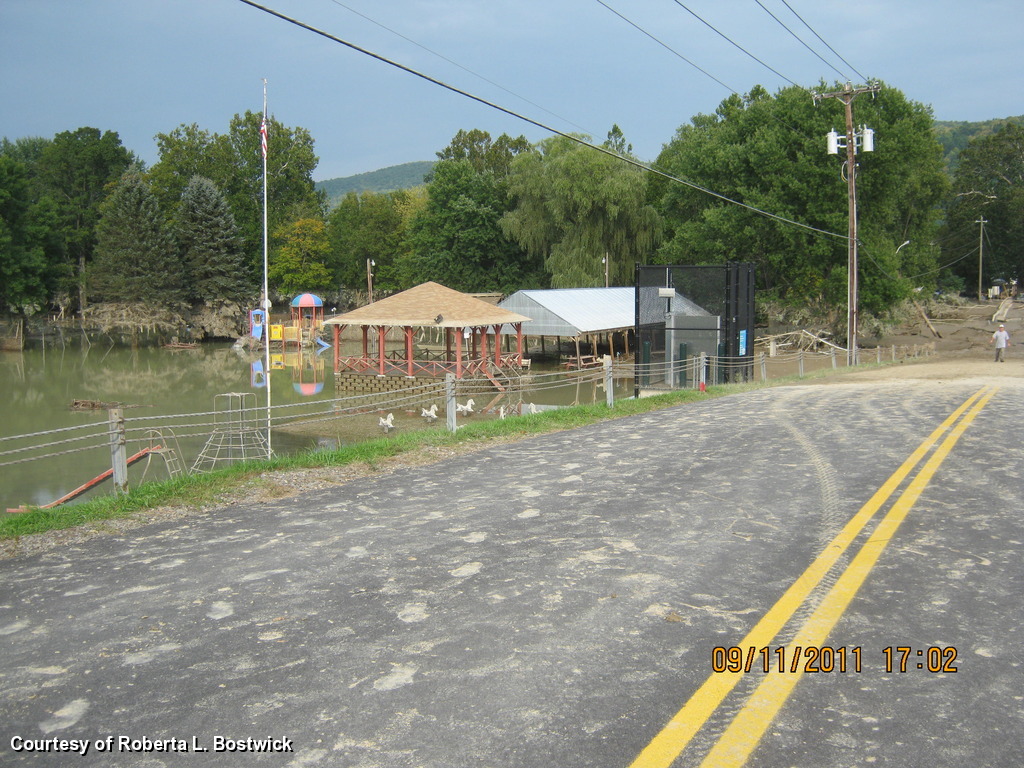
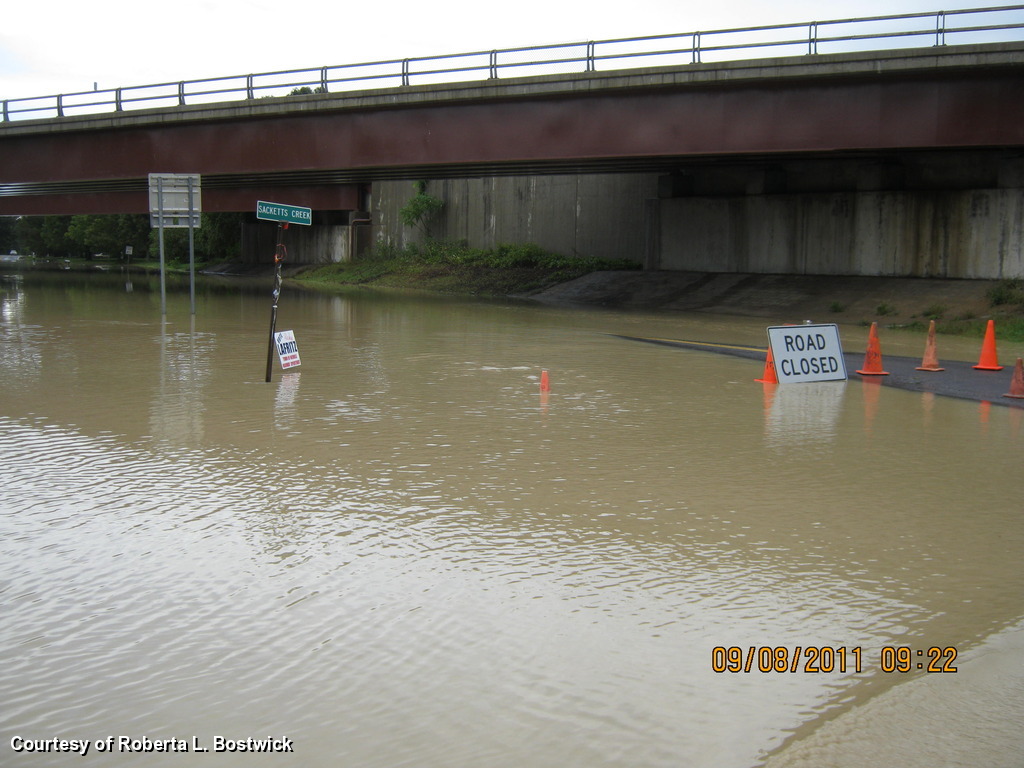
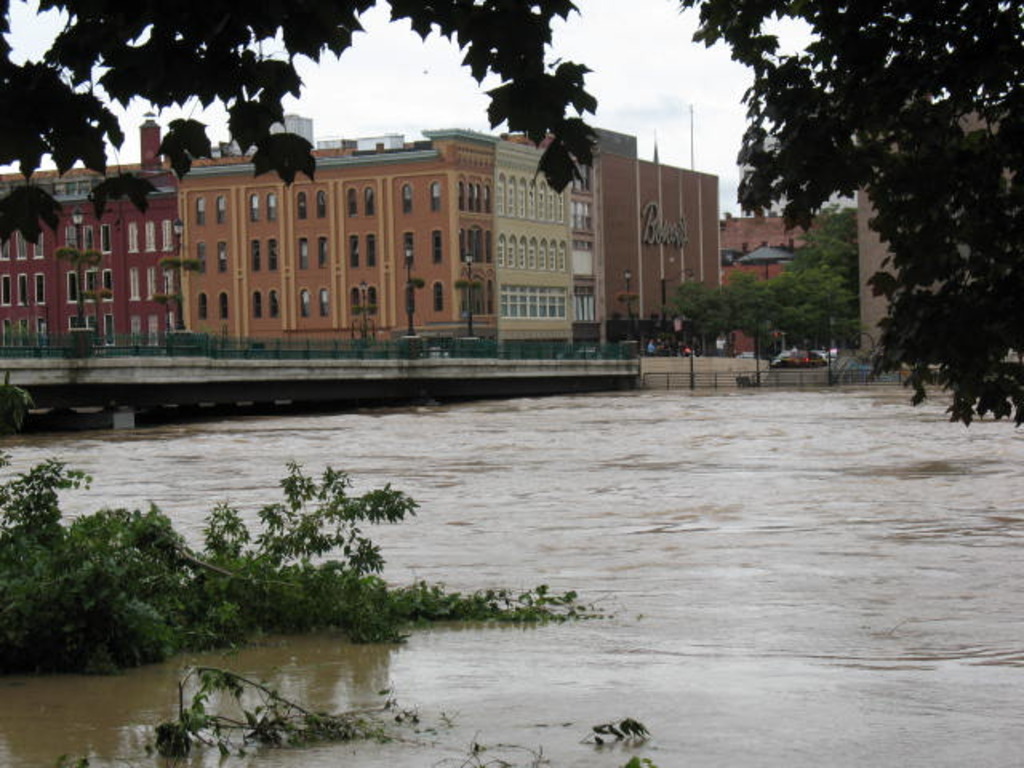
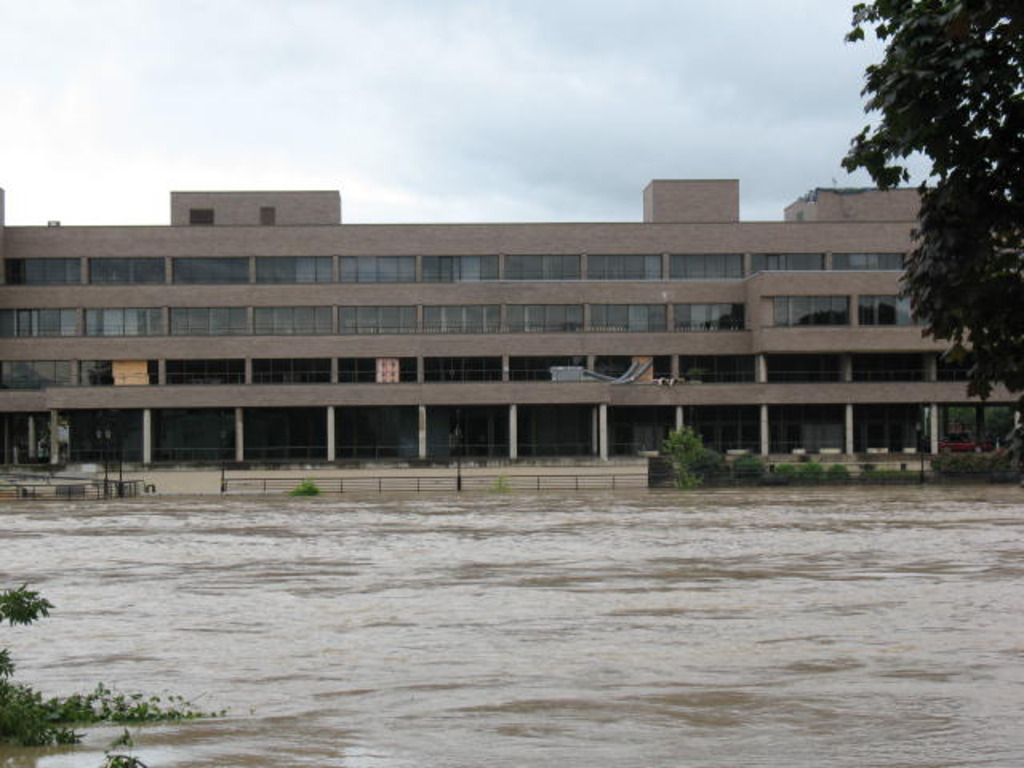
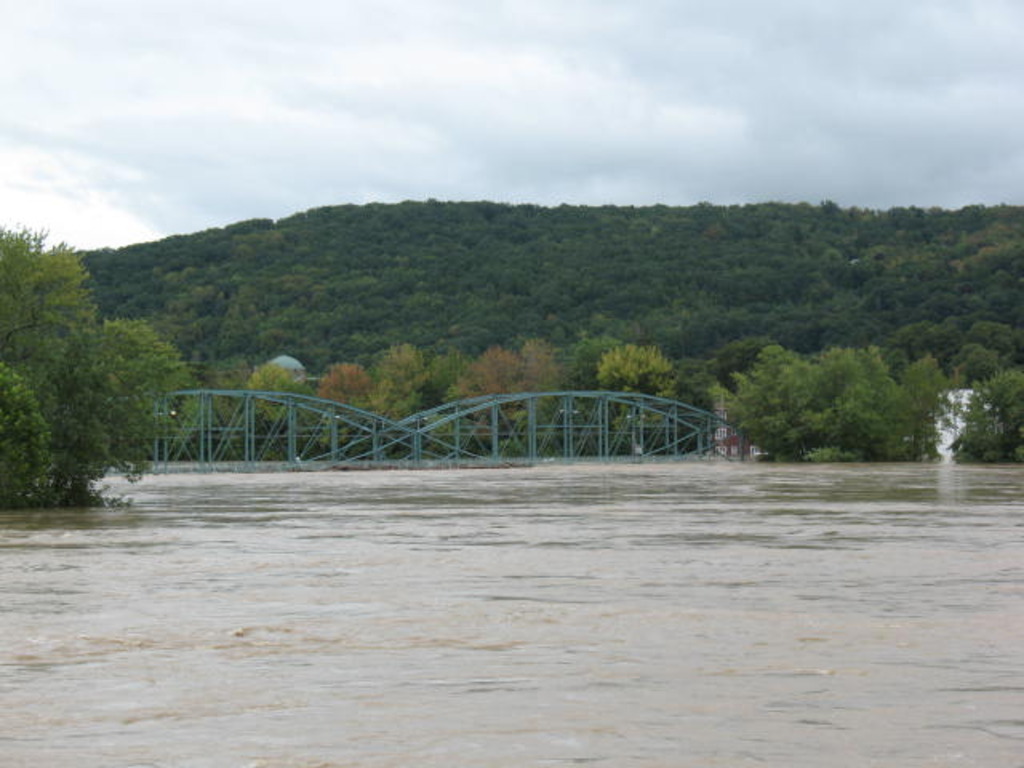
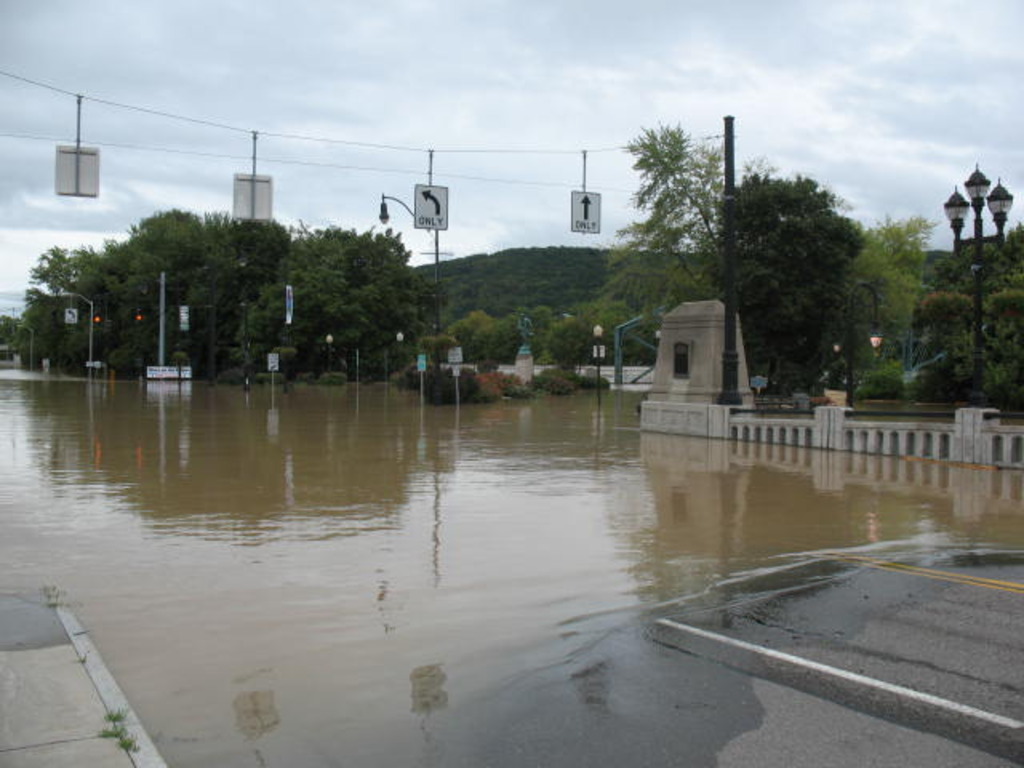
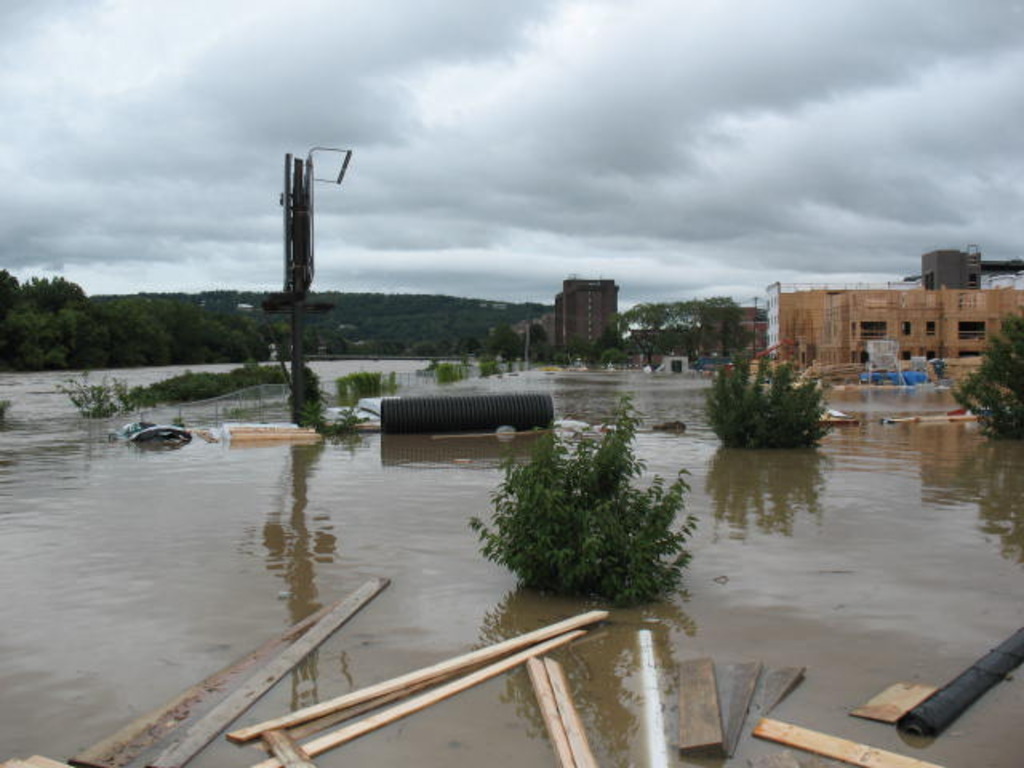
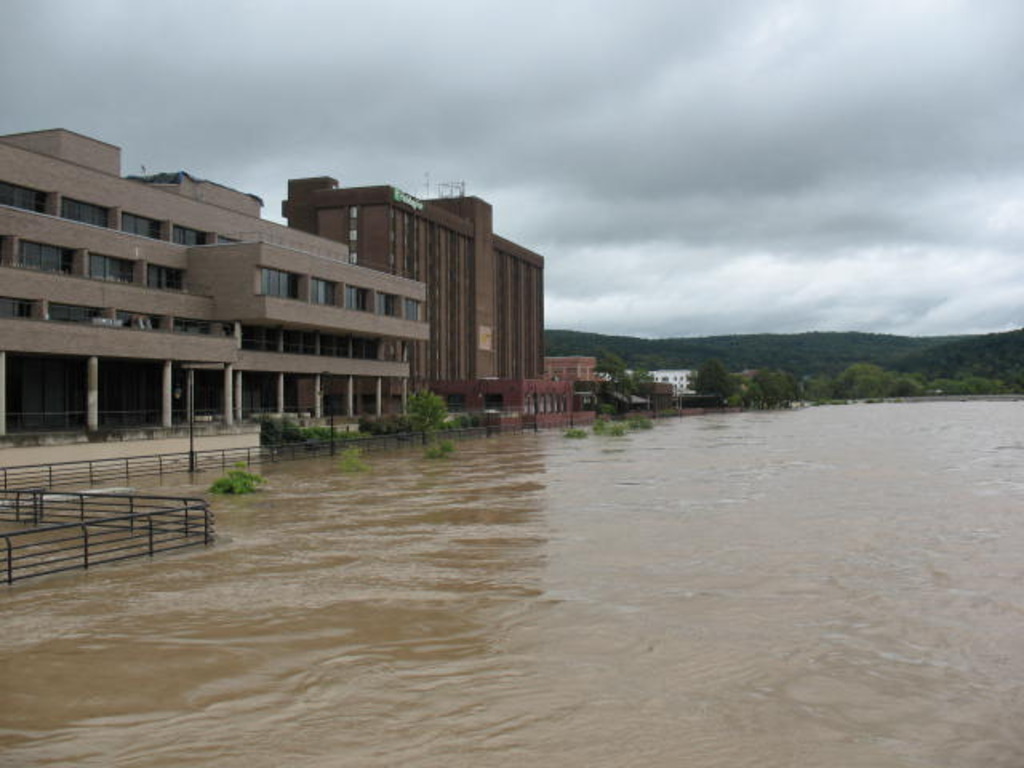
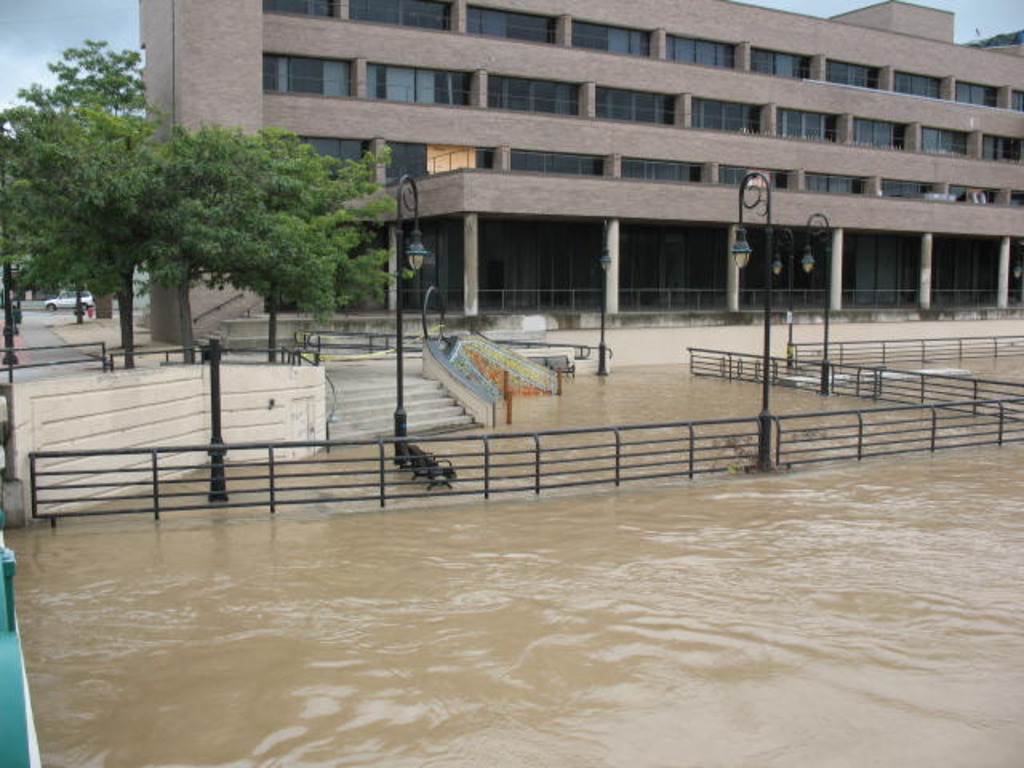
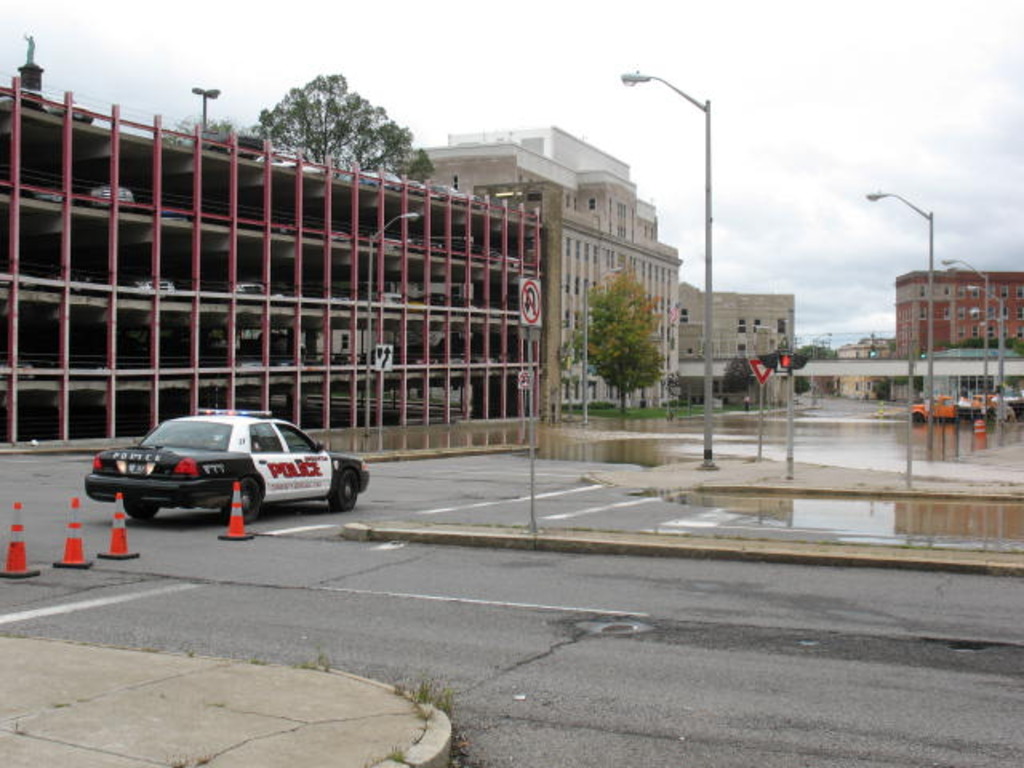
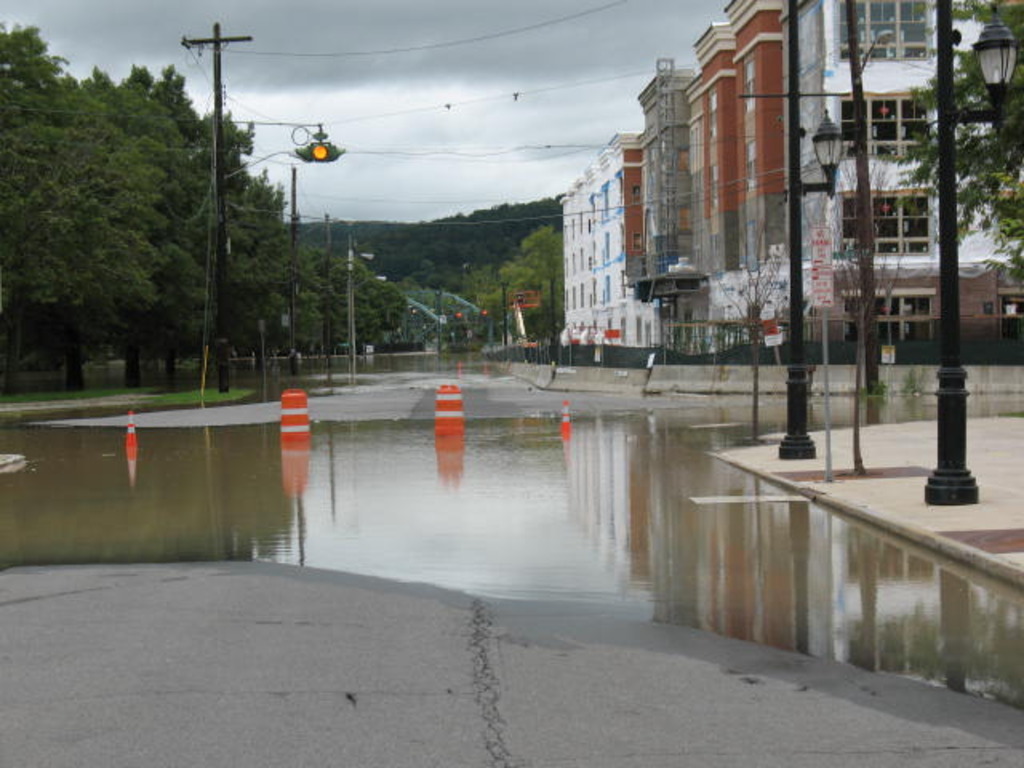
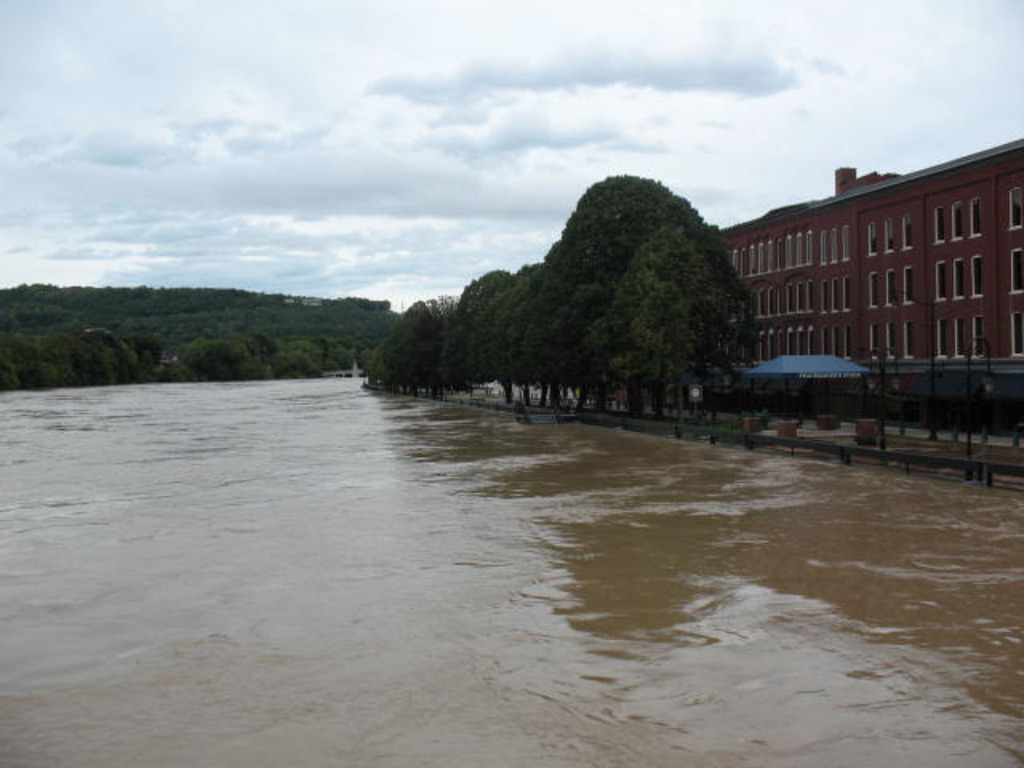
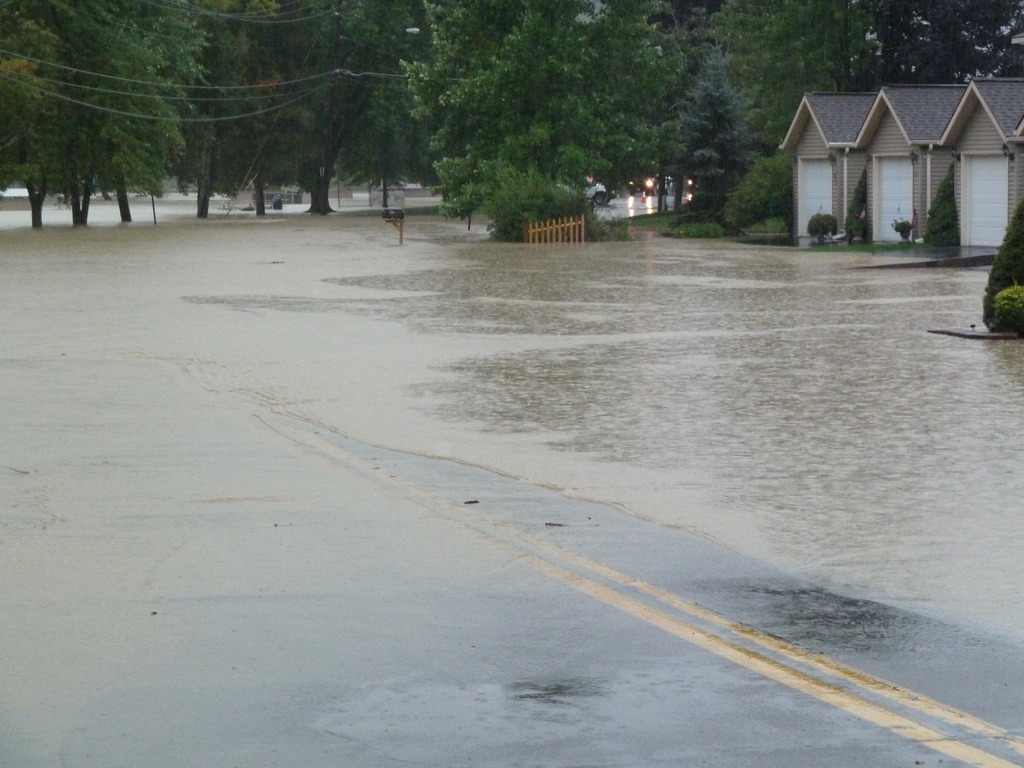
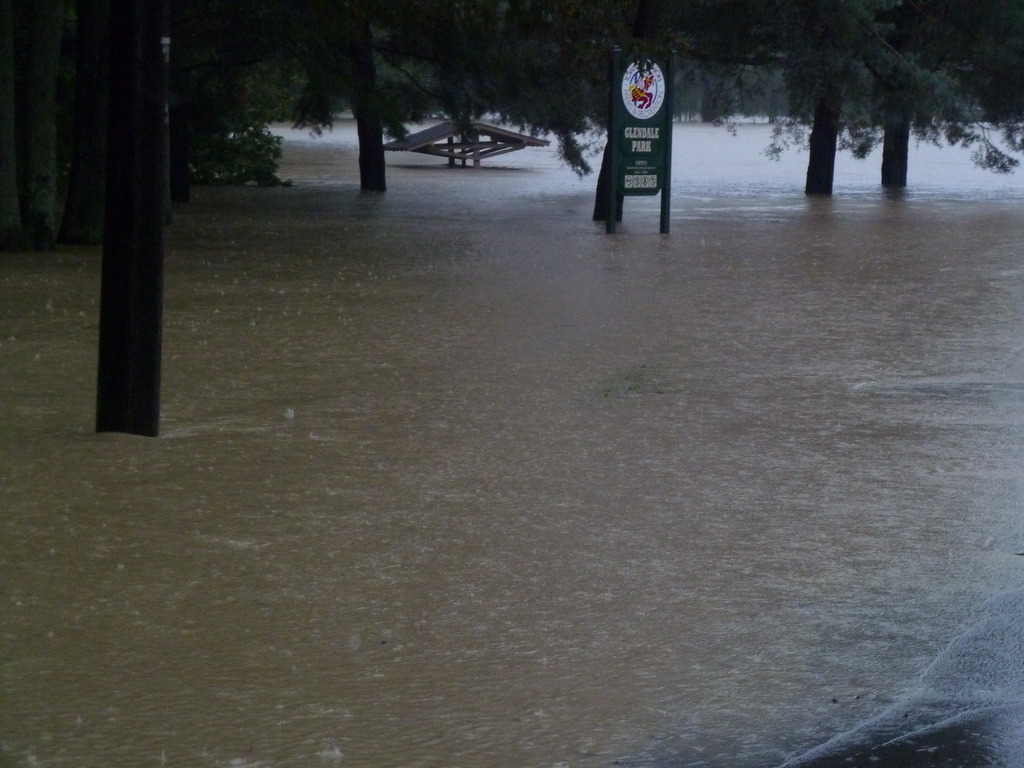
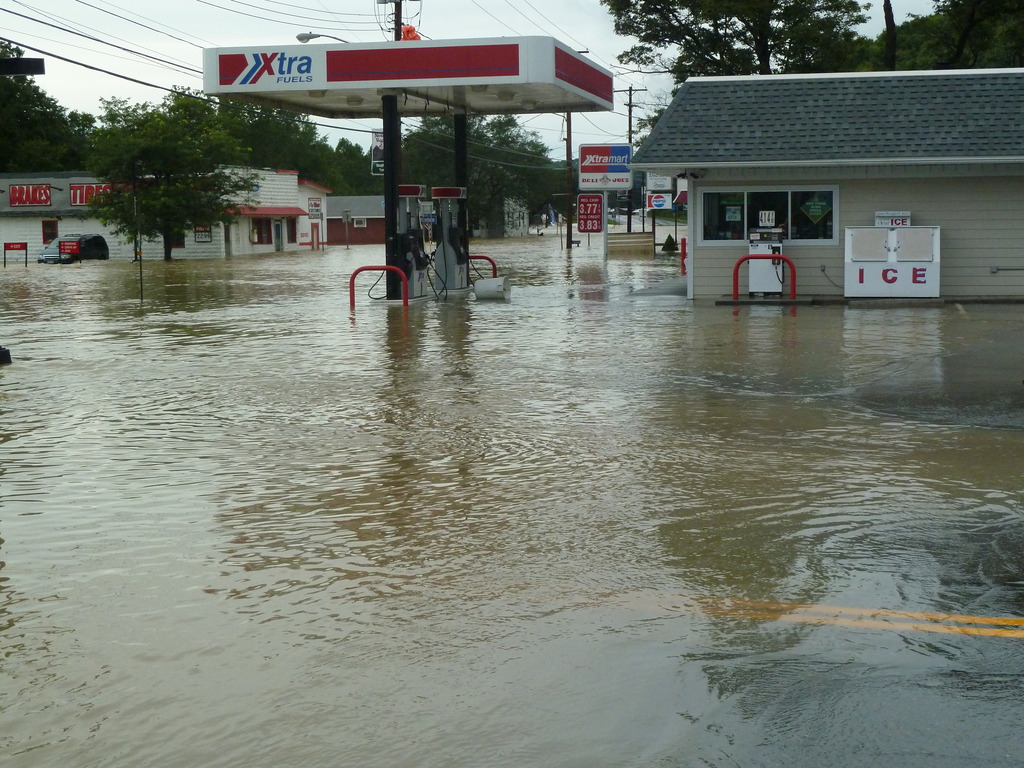
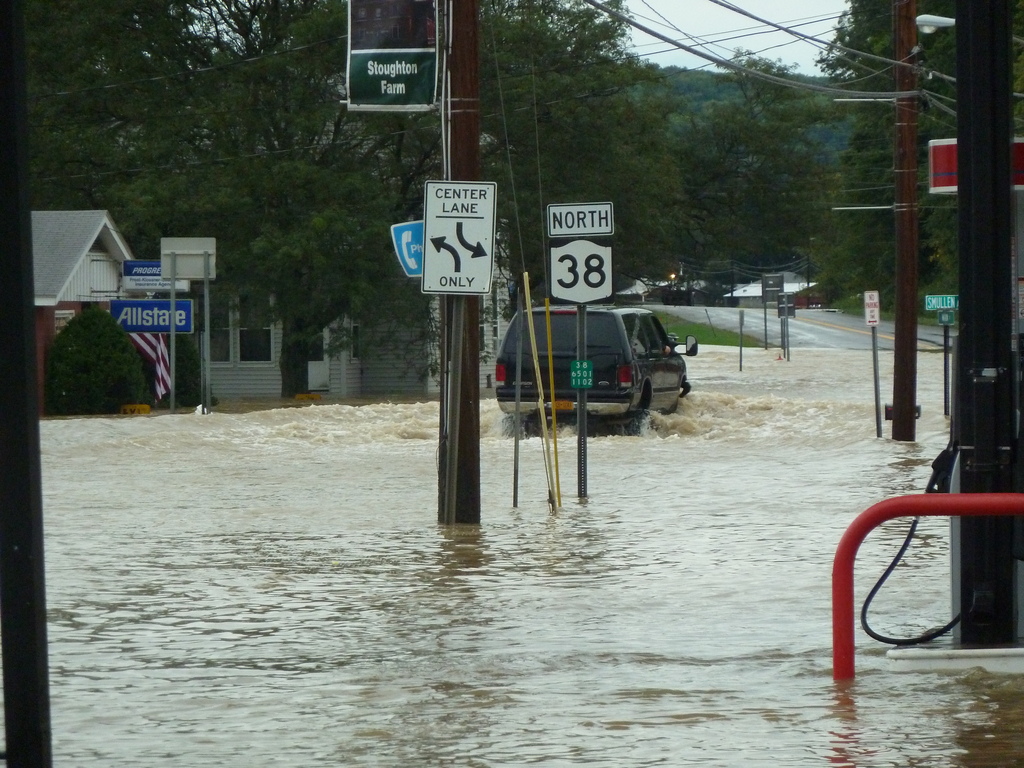
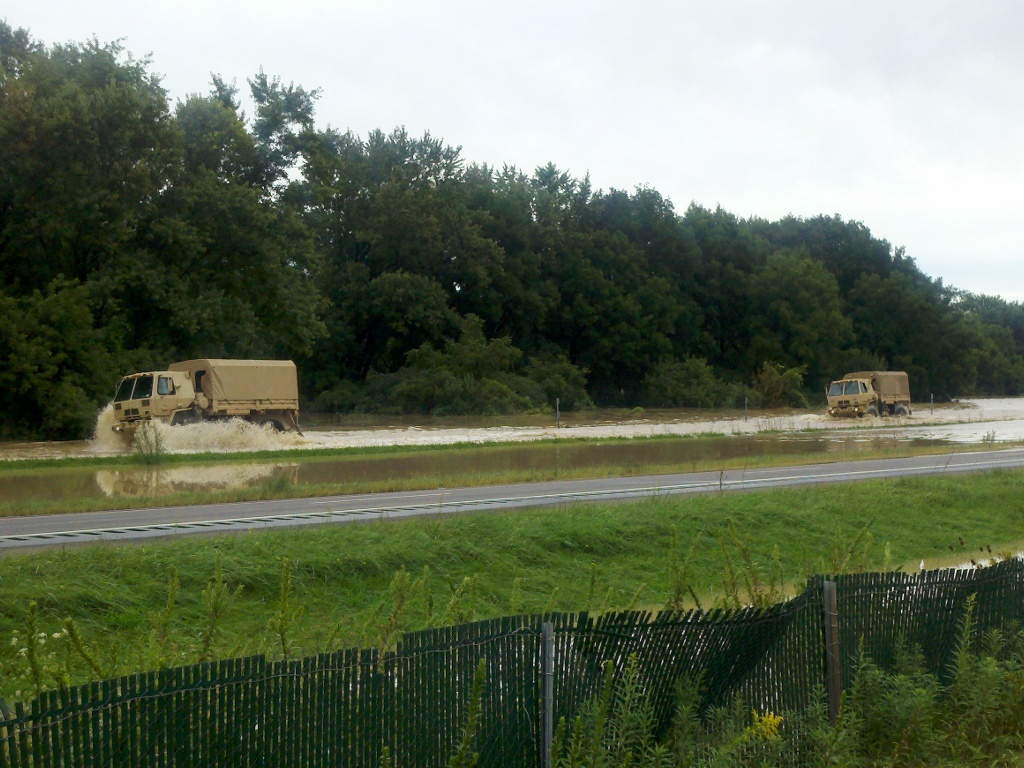
The remnants of Tropical Storm Lee moved northward from the southern Appalachians on the 6th to the middle Atlantic states on the 7th before stalling on the 8th. The moisture from Lee interacted with a frontal system to the west across the eastern Ohio Valley and eastern Great Lakes. In addition, moisture was drawn into New York and Pennsylvania from Hurricane Katia which was moving northward off the east coast in tandem with the remnants of Lee. This complicated scenario led to an extreme amount of rain for central New York and northeast Pennsylvania, most of which fell over a 48 hour period from the 6th to the 8th. Rainfall of 6 to 12 inches occurred over most of the upper Susquehanna river basin in New York and northeast Pennsylvania. The heavy rain caused massive, record breaking flooding on small streams, creeks and the Susquehanna River and its larger tributaries.
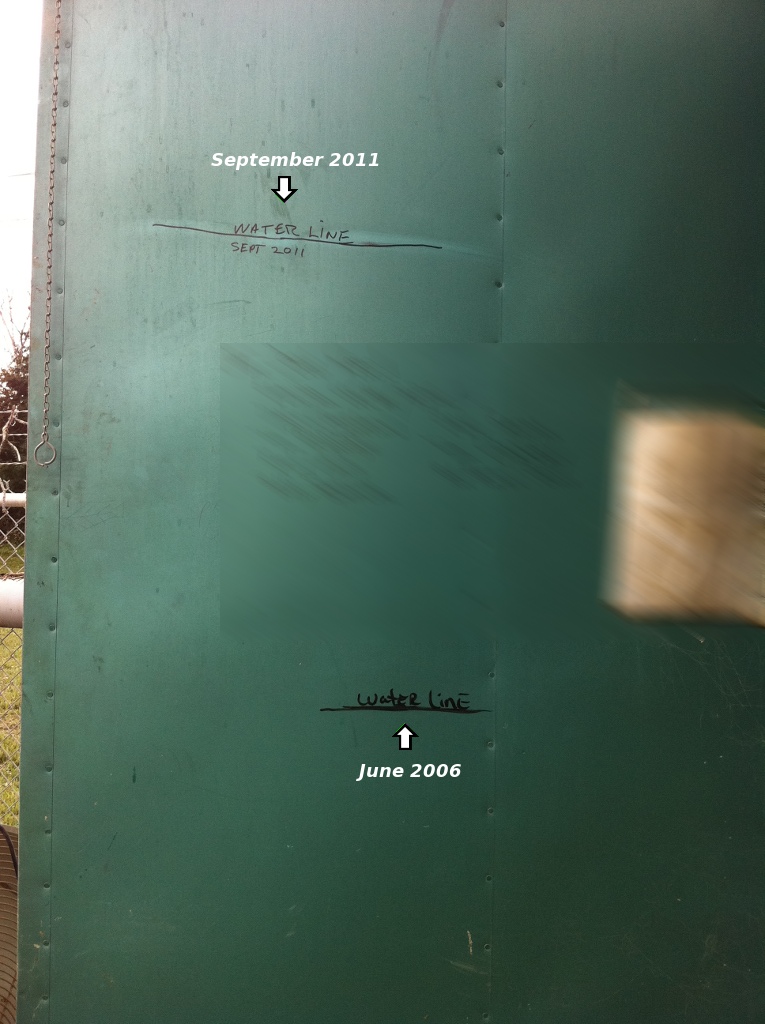
The main branch of the Susquehanna River in New York from Binghamton to Vestal, Owego and Waverly crested from 1 to 4 feet higher than the previous record crests set in June 2006. In Pennsylvania, record crests occurred along the Susquehanna River at Meshoppen and Wilkes Barre which exceeded the long-standing record crests by around 1 foot associated with Hurricane Agnes in 1972.
Damages in the upper Susquehanna River Basin in New York and Pennsylvania are close to 1 billion dollars. Unfortunately, the flooding claimed 1 life and injured 1 person in central New York and northeast Pennsylvania.
Multi-sensor Precipitation Estimates (MPE)
Preliminary data
Click on an image below for a larger view.
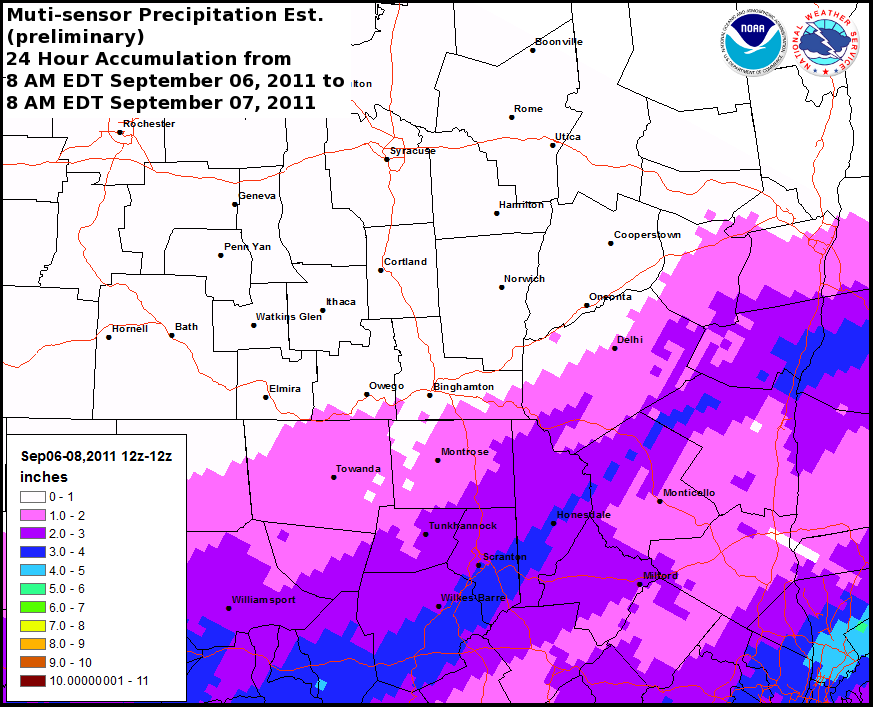
24 Hour Total September 06-07, 2011
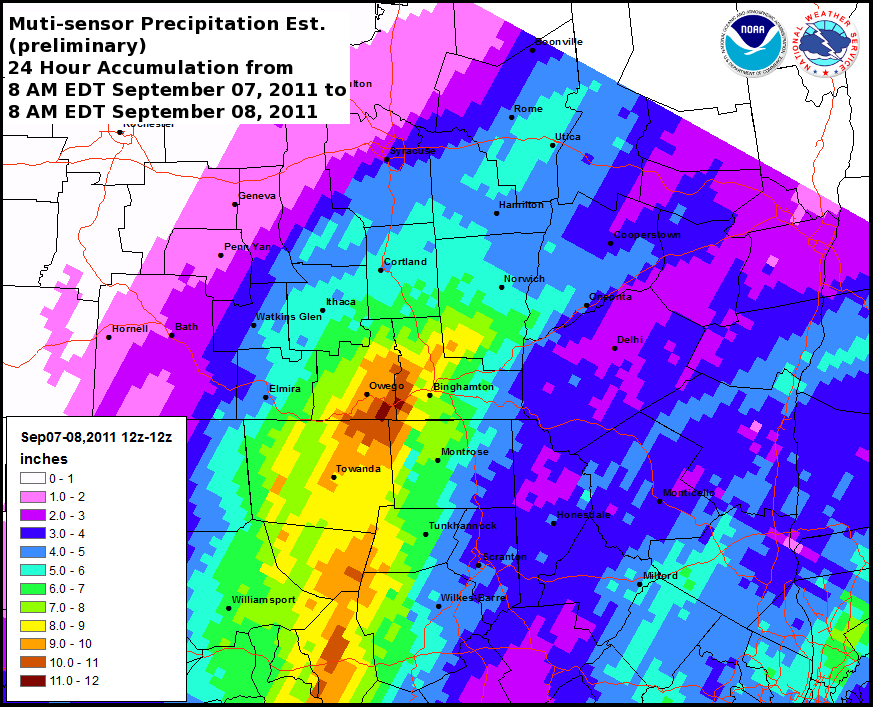
24 Hour Total September 07-08, 2011
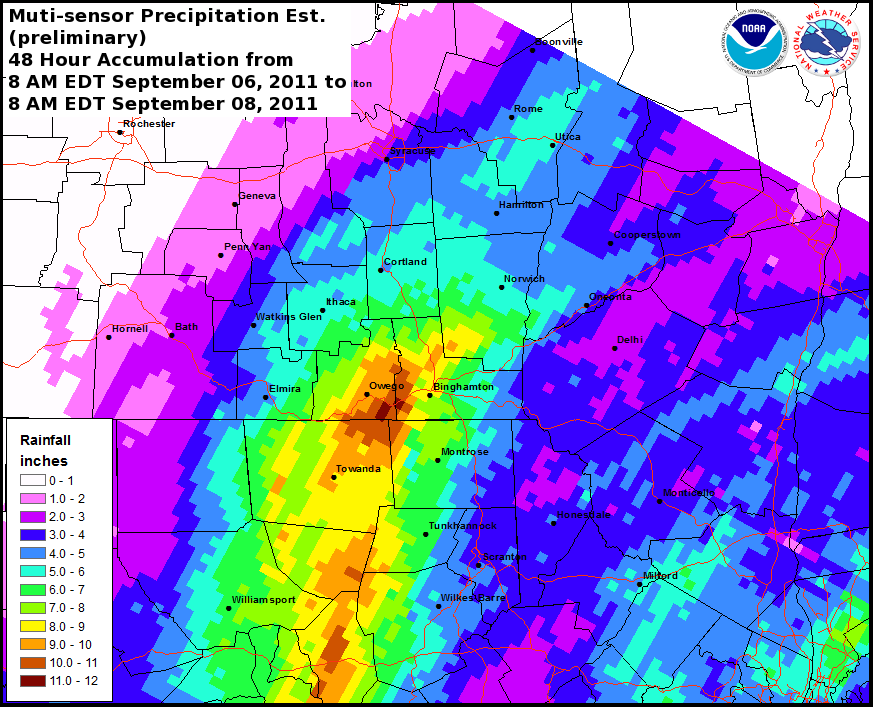
48 Hour Total September 06-08, 2011
Definitions
The MPE graphic shown in this section are Multisensor Precipitation Estimates, otherwise known as MPE data. The data used to produce this graphic is a combination of radar and precipitation gages. Source: Middle Atlantic River Forecast Center.
When using MPE data, it is important to remember it is vulnerable to the same inaccuracies that can be caused by either radar or precipitation gages. For radar, problems would be: freezing or frozen precipitation, low topped convection, bright banding, the reflectivity/rainfall relationship in use, calibration of the radar, radar location and elevation, range degradation, and the radar's effective coverage. For precipitation gages, problems come from freezing precipitation, windy conditions, gage siting, undermeasurement by tipping bucket gages in high intensity rainfall, and gage maintenance.
Past Flood Events
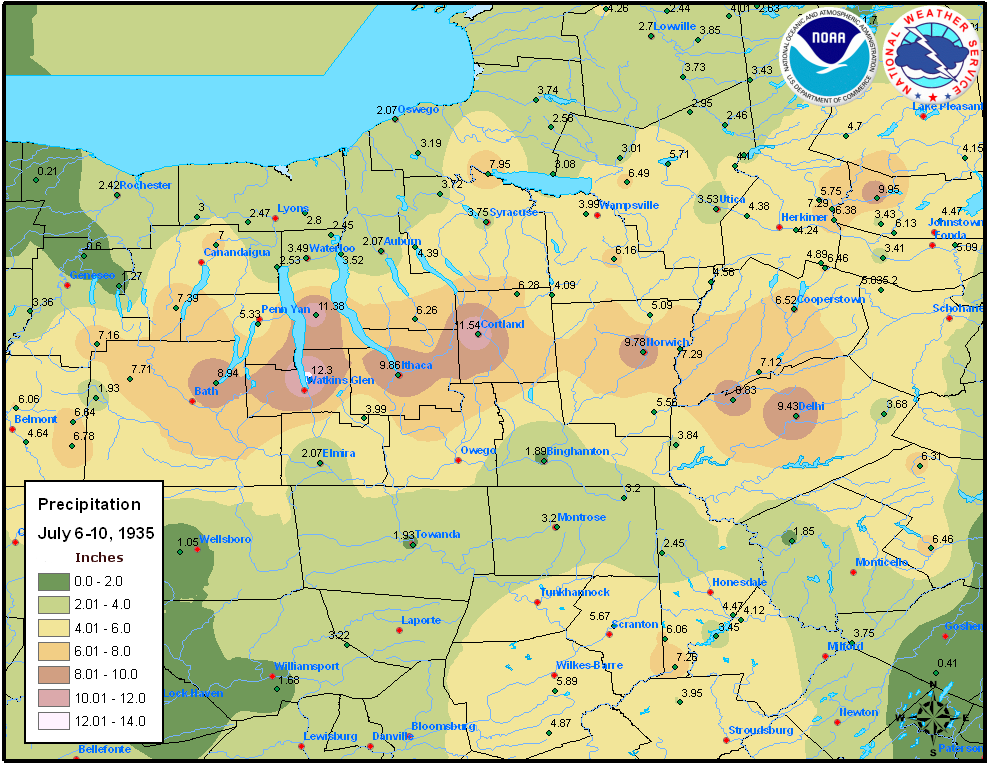
July 6-10, 1935 Observed Rainfall Map.
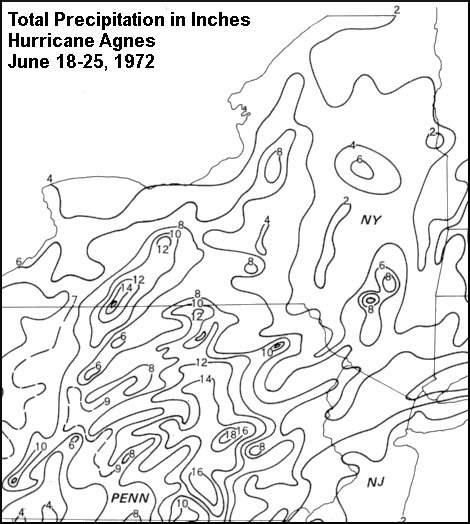
Hurricane Agnes Observed Rainfall Map June 18-25, 1972.
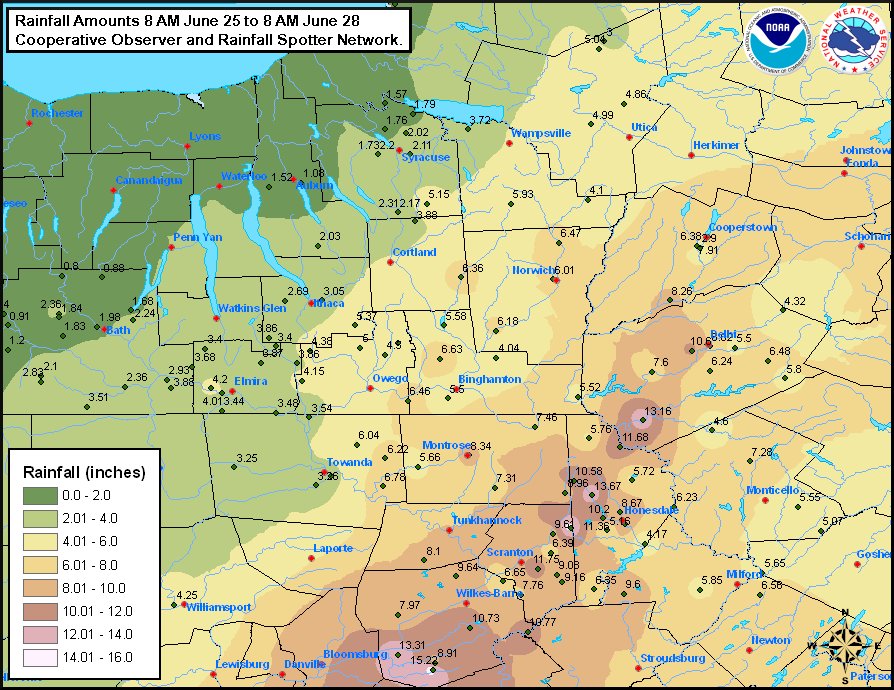
Total MPE accumulation from 8 AM EDT June 24th, 2006 8 AM EDT June 29th, 2006.
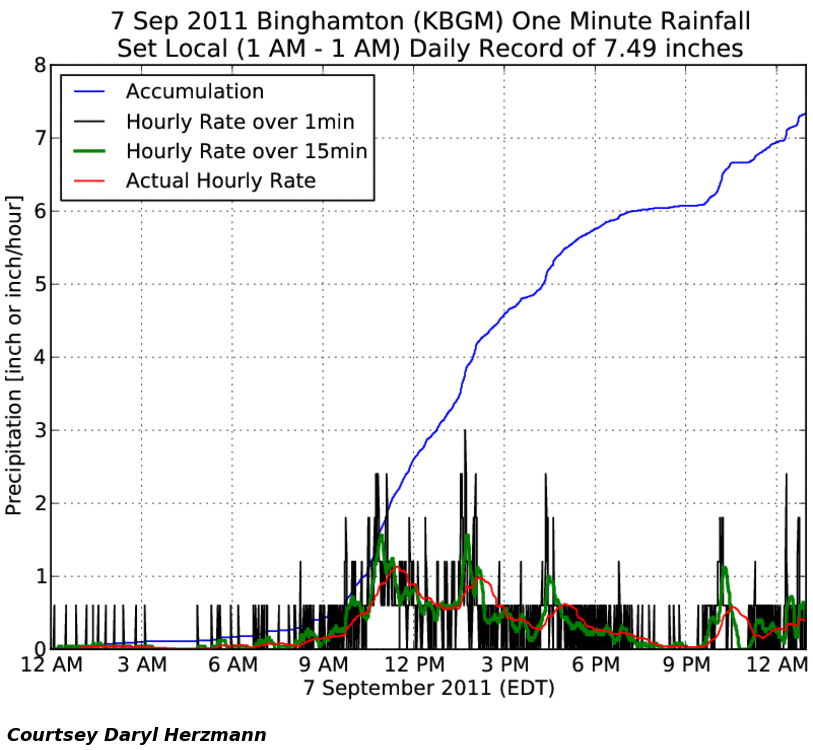
A graphic that shows various rainfall accumulation rates at the Greater Binghamton Airport.
Show text rainfall reports
THE FOLLOWING ARE 2 DAY RAINFALL REPORTS FOR THE PERIOD FROM TUESDAY
EVENING THROUGH THURSDAY MORNING 9/6-9/8. THESE TOTALS PRIMARILY
ENCOMPASS THE HEAVY RAINFALL EVENTS AND FLASH FLOODING ON WEDNESDAY
SEPTEMBER 7TH. THANK YOU TO ALL COOPERATIVE WEATHER OBSERVERS,
COCORAHS, AND OTHER RAINFALL SPOTTER NETWORKS.

********************STORM TOTAL RAINFALL********************

LOCATION          STORM TOTAL     TIME/DATE   COMMENTS
                     RAINFALL           OF
                     /INCHES/   MEASUREMENT

NEW YORK

...BROOME COUNTY...
   VESTAL CENTER         9.92   109 PM  9/10  9.92
   BINGHAMTON REG ARPT   9.19  1254 PM  9/10  9.19
   1 NNW VESTAL CENTER   8.93   110 PM  9/10  8.93
   VESTAL CENTER         8.90  1252 PM  9/10  8.90
   1 NW PARK TERRACE     8.47   111 PM  9/10  8.47
   1 SE KATTELLVILLE     7.74   109 PM  9/10  7.74
   1 NW MOUNTAIN VIEW T  7.61   113 PM  9/10  7.61
   1 SE MEADOWBROOKE ES  7.36   111 PM  9/10  7.36
   DORCHESTER ESTATES    7.06   246 PM  9/10  7.06
   DAMASCUS              5.60   108 PM  9/10  5.60
   DEPOSIT               4.55   225 PM  9/10  4.55
   1 SE GULF SUMMIT      4.42   112 PM  9/10  4.42

...CAYUGA COUNTY...
   PINE HOLLOW           4.39   229 PM  9/10  4.39
   2 ESE MONTVILLE       4.03   114 PM  9/10  4.03
   1 SE CONKLIN COVE     3.20   114 PM  9/10  3.20
   1 NE WILLETS          2.91   219 PM  9/10  2.91
   1 E AUBURN            1.68   218 PM  9/10  1.68
   1 WNW OAKWOOD         1.38   113 PM  9/10  1.38
   1 N SPRING LAKE       0.91   115 PM  9/10  .91

...CHEMUNG COUNTY...
   VAN ETTEN             5.79   117 PM  9/10  5.79
   1 SW ROSSTOWN         5.61   116 PM  9/10  5.61
   1 ESE ELMIRA          5.49   116 PM  9/10  5.49
   1 NNW EAST ELMIRA     5.26   117 PM  9/10  5.26
   1 NE WEST ELMIRA      5.03   225 PM  9/10  5.03
   1 W BIG FLATS         3.37   118 PM  9/10  3.37

...CHENANGO COUNTY...
   COVENTRY              8.46  1251 PM  9/10
   CHENANGO LAKE         5.77   118 PM  9/10  5.77
   2 W PRESTON           5.68   119 PM  9/10  5.68
   UPPERVILLE            4.91   120 PM  9/10  4.91
   1 W SHERBURNE         4.64   241 PM  9/10  4.65

...CORTLAND COUNTY...
   1 NW HUNTS CORNERS    6.40   105 PM  9/10  6.40
   MARATHON              6.04  1252 PM  9/10
   2 SSW WILLET          5.95   125 PM  9/10  5.95
   1 NW MARATHON         4.55   126 PM  9/10  4.55

...DELAWARE COUNTY...
   ARKVILLE              4.02   127 PM  9/10  4.02
   1 NW WALTON           3.87   244 PM  9/10  3.87
   3 SE DE LANCEY        3.46   128 PM  9/10  3.46
   SOUTH KORTRIGHT       3.16   128 PM  9/10  3.16

...MADISON COUNTY...
   2 NNW EARLVILLE       4.33   131 PM  9/10  4.33
   1 SSE ERIEVILLE       4.05   236 PM  9/10  4.05
   2 SW MUNNSVILLE       3.74   132 PM  9/10  3.74
   1 E ABELL CORNERS     3.67   131 PM  9/10  3.67
   1 S CANASTOTA         3.64   130 PM  9/10  3.64
   1 SSE ATWELL CORNERS  3.59   133 PM  9/10  3.59
   1 NNE ONEIDA          3.14   129 PM  9/10  3.14

...ONEIDA COUNTY...
   1 S NEW HARTFORD      3.71   135 PM  9/10  3.71
   VERNON                3.60   135 PM  9/10  3.60
   DIX                   3.54   246 PM  9/10  3.54
   2 E MARCY             3.46   135 PM  9/10  3.46
   1 NNE TRENTON FALLS   3.36   244 PM  9/10  3.36
   1 WNW DUMBARTON       2.92   136 PM  9/10  2.92
   1 NW CANTERBURY HILL  2.78   224 PM  9/10  2.78
   2 NW STACY BASIN      2.73   239 PM  9/10  2.73
   3 SSW WOODGATE        2.08   133 PM  9/10  2.08
   2 SSE REDMOND CORNER  1.98   222 PM  9/10  1.98
   1 SE POINT ROCK       1.92   134 PM  9/10  1.92
   BOONVILLE             1.75   134 PM  9/10  1.75

...ONONDAGA COUNTY...
   TULLY LAKE PARK       3.95   137 PM  9/10  3.95
   2 NNW POMPEY          3.62   139 PM  9/10  3.62
   DEWITT                3.19   138 PM  9/10  3.19
   2 E MARCELLUS         2.88   139 PM  9/10  2.88
   1 NNE SKYTOP          2.78   138 PM  9/10  2.78
   SYRACUSE HANCOCK ARP  2.65  1256 PM  9/10  2.65
   SKANEATELES           2.27   242 PM  9/10  2.27
   1 W CAMILLUS          1.92   137 PM  9/10  1.92
   1 E THREE RIVERS      1.16   138 PM  9/10  1.16
   BALDWINSVILLE         1.13   140 PM  9/10  1.13
   2 NNE OAK ORCHARD     1.08   222 PM  9/10  1.08

...OTSEGO COUNTY...
   2 N UNADILLA          6.06   244 PM  9/10  6.06
   1 NE ONEONTA          5.13   238 PM  9/10  5.13
   1 N COOPERSTOWN       3.70   223 PM  9/10  3.51

...SCHUYLER COUNTY...
   1 W ALPINE JUNCTION   4.84   141 PM  9/10  4.84
   2 NE CATHARINE        4.77   142 PM  9/10  4.77
   4 ESE CAYUTA          4.70   101 PM  9/10  4.7
   2 NNW SMITH VALLEY    4.66   231 PM  9/10  4.66
   1 W CAYUTAVILLE       4.48   141 PM  9/10  4.48
   BURDETT               4.43   144 PM  9/10  4.43
   1 SSW READING CENTER  3.73   143 PM  9/10  3.73
   HECTOR                3.62   145 PM  9/10  3.62
   1 W TYRONE            2.19   143 PM  9/10  2.19

...SENECA COUNTY...
   WATERLOO              1.27   245 PM  9/10  1.27

...STEUBEN COUNTY...
   1 WNW CATON           4.14   145 PM  9/10  4.14
   1 SSW CORNING         3.51   224 PM  9/10  3.51
   SONORA                3.17   147 PM  9/10  3.17
   COOPERS PLAINS        3.12  1251 PM  9/10  3.12
   ADDISON               2.33   218 PM  9/10  2.33
   BATH                  2.27   147 PM  9/10  2.27
   1 SW CAMPBELL         2.21   146 PM  9/10  2.21
   2 W HAVERLING HEIGHT  2.06   219 PM  9/10  2.06
   3 ENE WALLACE         1.14   146 PM  9/10  1.14
   1 SW WEBBS CROSSING   0.79   228 PM  9/10  .79

...SULLIVAN COUNTY...
   WURTSBORO             4.82   149 PM  9/10  4.82
   BLOOMINGBURG          4.34   221 PM  9/10  4.34
   2 NNE NARROWSBURG     4.08   206 PM  9/10  4.08
   3 E MELODY LAKE       3.71   241 PM  9/10  3.71
   2 SSW COCHECTON       3.64   236 PM  9/10  3.64
   2 NW MAMAKATING PARK  3.58   148 PM  9/10  3.58
   1 SSE CLARYVILLE      3.50   103 PM  9/10  3.5
   LONG EDDY             3.17   149 PM  9/10  3.17

...TIOGA COUNTY...
   TIOGA TERRACE 2      11.24   150 PM  9/10  11.24
   TIOGA TERRACE        10.39   150 PM  9/10  10.39
   1 ENE VALLEY MOBILE  10.31   151 PM  9/10  10.31
   1 NNW PRICE HOME      6.64   152 PM  9/10  6.64
   2 NW BERKSHIRE        6.62   151 PM  9/10
   2 N NEWARK VALLEY     6.30   107 PM  9/10  6.30
   1 WSW UPPER FAIRFIEL  5.86   150 PM  9/10  5.86

...TOMPKINS COUNTY...
   2 WNW CAROLINE CENTE  5.24   156 PM  9/10  5.24
   2 SSE SLATERVILLE SP  5.17   154 PM  9/10  5.17
   RED MILLS             4.81   153 PM  9/10  4.81
   1 WSW VARNA           4.75   229 PM  9/10  4.75
   1 SSE GROTTO          4.65   155 PM  9/10  4.65
   1 SW RED MILLS        4.62   227 PM  9/10  4.62
   1 NNE NORTH LANSING   3.98   153 PM  9/10  3.98
   GROTON                3.95   153 PM  9/10  3.95
   SOUTH HILL            3.45   154 PM  9/10  3.45

...YATES COUNTY...
   PENN YAN REG ARPT     1.34  1258 PM  9/10  1.34

PENNSYLVANIA

...BRADFORD COUNTY...
   ALBA                  9.02  1253 PM  9/10  9.02
   SOUTH TOWANDA         7.21   243 PM  9/10  7.21
   1 WNW COVERT          6.75   157 PM  9/10  6.75
   1 N CORYLAND          5.26   158 PM  9/10  5.26

...LACKAWANNA COUNTY...
   1 N RANSOM            3.68   238 PM  9/10  3.88
   1 ESE GLENBURN        3.24   158 PM  9/10  3.24
   1 SSW FREYTOWN        3.14   206 PM  9/10  3.14
   MONTDALE              2.88   159 PM  9/10  2.88

...LUZERNE COUNTY...
   1 NE KOONSVILLE       6.01   242 PM  9/10  6.01
   1 NNE CRANBERRY       5.55   201 PM  9/10  5.55
   YATESVILLE            4.90   201 PM  9/10  4.90
   HAZLETON              4.64  1254 PM  9/10  4.40
   WB-SCRANTON ARPT      4.52  1255 PM  9/10  4.52
   DURYEA                3.61   202 PM  9/10  3.61
   2 E PENN LAKE PARK    3.47   226 PM  9/10  3.47
   DRUMS                 2.97   200 PM  9/10  2.97
   SAINT JOHNS           2.62   200 PM  9/10  2.62

...PIKE COUNTY...
   WILD ACRES            5.12   217 PM  9/10  5.12
   1 SW GOLD KEY LAKE    5.05   216 PM  9/10  5.05
   2 NW MATAMORAS        4.26   230 PM  9/10  4.26
   1 N SKY VIEW LAKE     3.90   104 PM  9/10  3.9
   2 SW FOREST LAKE PAR  3.52   211 PM  9/10  3.52
   2 NNE WILSONVILLE     3.39   228 PM  9/10  3.39

...SUSQUEHANNA COUNTY...
   MONTROSE              7.97   205 PM  9/10  7.97
   2 ENE CHOCONUT        7.39   204 PM  9/10  7.39
   STANFORDVILLE         7.18   204 PM  9/10  7.18
   1 WNW HEART LAKE      6.28   237 PM  9/10  6.28
   1 NE MONTROSE         5.90   106 PM  9/10  5.90
   FOREST CITY           4.93   203 PM  9/10  4.93

...WAYNE COUNTY...
   1 NNW SEELYVILLE      5.71   210 PM  9/10  5.71
   BETHEL                4.79   210 PM  9/10  4.79
   1 SSW PROMPTON        4.51   208 PM  9/10  4.51
   STARRUCCA             4.46   207 PM  9/10  4.46
   PROMPTON              4.04   241 PM  9/10  4.04
   1 NNW AVOY            3.81   209 PM  9/10  3.81
   2 NNE WEST HAWLEY     3.57   207 PM  9/10  3.57
   1 ENE POCONO SPRINGS  3.31   240 PM  9/10  3.31
   DILLONTOWN            3.07   226 PM  9/10  3.07
   BELMONT CORNER        3.02   240 PM  9/10  3.02

...WYOMING COUNTY...
   1 S MEHOOPANY         9.14  1249 PM  9/10


**********************24 HOUR RAINFALL**********************

LOCATION              24 HOUR     TIME/DATE   COMMENTS
                     RAINFALL           OF
                     /INCHES/   MEASUREMENT

NEW YORK

...SCHUYLER COUNTY...
   4 SW MECKLENBURG      0.01   719 AM  9/11  CO-OP OBSERVER

...STEUBEN COUNTY...
   HORNELL ALMOND DAM    0.01   904 AM  9/11  CO-OP OBSERVER

PENNSYLVANIA

...BRADFORD COUNTY...
   6 ENE ROSEVILLE       0.01   700 AM  9/11  COCORAHS

...LACKAWANNA COUNTY...
   1 SE MONTDALE         0.02   800 AM  9/11  COCORAHS

...SUSQUEHANNA COUNTY...
   SE STANFORDVILLE      0.02   700 AM  9/11  COCORAHS

...WAYNE COUNTY...
   2 NW EQUINUNK         0.38   834 AM  9/11  CO-OP OBSERVER
   1 W PLEASANT MOUNT    0.26   743 AM  9/11  CO-OP OBSERVER
   2 SE MILANVILLE       0.02   800 AM  9/11  COCORAHS
Regional Radar Loop
To start the animation, either move mouse over image or click on the image.
A hydrograph shows how the river level changes over time at a specific location. More information.
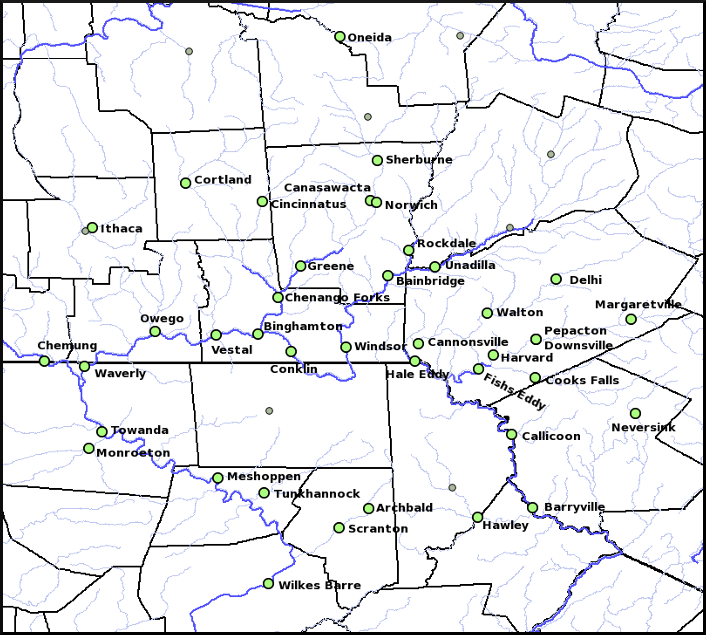
Hydrographs listed in alphabetical order by gage site location.
 The remnants of Tropical Storm Lee moved northward from the southern Appalachians on the 6th to the middle Atlantic states on the 7th before stalling on the 8th. The moisture from Lee interacted with a frontal system to the west across the eastern Ohio Valley and eastern Great Lakes. In addition, moisture was drawn into New York and Pennsylvania from Hurricane Katia which was moving northward off the east coast in tandem with the remnants of Lee. This complicated scenario led to an extreme amount of rain for central New York and northeast Pennsylvania, most of which fell over a 48 hour period from the 6th to the 8th. Rainfall of 6 to 12 inches occurred over most of the upper Susquehanna river basin in New York and northeast Pennsylvania. The heavy rain caused massive, record breaking flooding on small streams, creeks and the Susquehanna River and its larger tributaries.
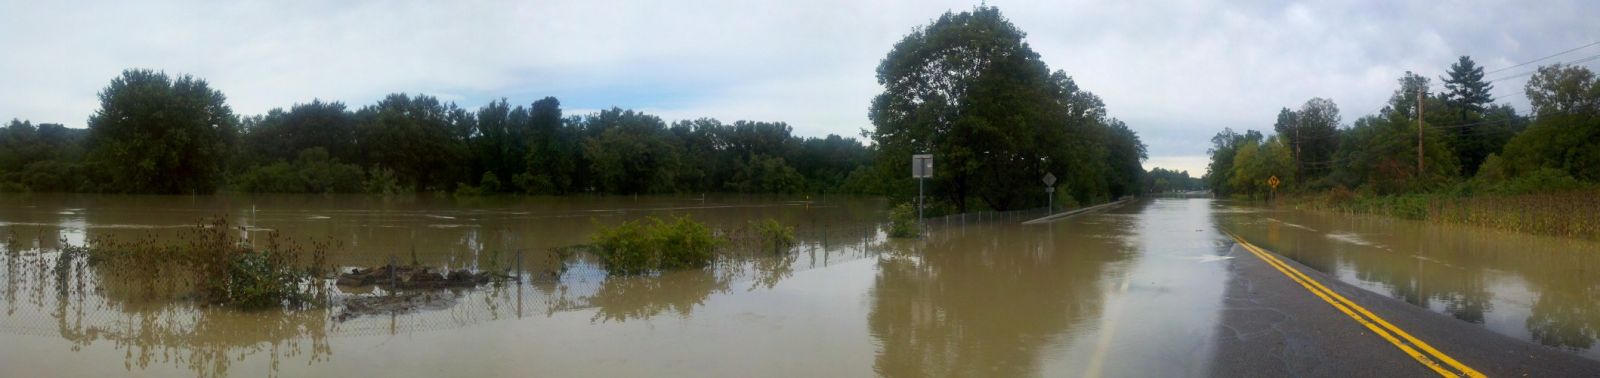


