National Weather Service United States Department of Commerce


Central Alabama Impacts from Nate
October 7-8, 2017

 
Overview Tornadoes Wind Gusts Rainfall Totals
Storm Reports Satellite/Surface/Upper Air Other Links
 

Overview

A broad low pressure area was situated in the extreme southern Caribbean Sea, off the coast of Panama and Costa Rica at the beginning of October. Although the peak of Atlantic Hurricane Season has passed, the southern Caribbean Sea is an origination zone at this point in the Tropical Atlantic Season. Conditions were increasingly favorable for some development and the system eventually showed signs of organization. On the morning of October 4th, a Tropical Depression formed  25 miles south south west of San Andreas Island, off the Nicaraguan Coast.  The system strengthened and became Tropical Storm Nate on the morning of October 5th, just off the coast of Nicaragua. Nate moved inland across Nicaragua and Honduras through Friday morning October 6th. Flooding rainfall and windy conditions produced significant damage and flooding in several Central American and Caribbean countries.

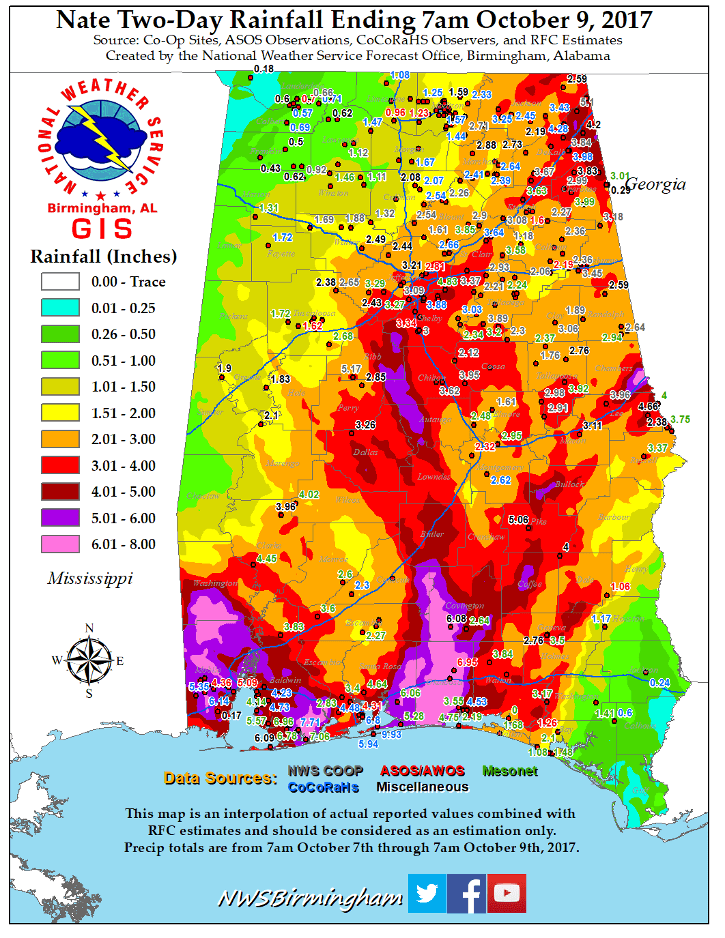
Nate then moved north-northwest over the warm waters of the northwestern Caribbean Sea, where it gradually intensified. Just after passing through the Yucatan Channel, Nate officially reached hurricane status during the early morning hours of October 7th. Hurricane Nate raced toward the central Gulf Coast at unprecedented speeds and made its first landfall near the mouth of the Mississippi River at 7 PM on Oct 7th. A second landfall near Biloxi, MS, came just 5 and half hours later at 1230 AM on Oct 8th. Nate continued to accelerate northeastward and was downgraded to a Tropical Depression near Birmingham, AL, on the morning of Oct 8th. By 5 AM on Oct 9th, Nate had become post-tropical near Akron, OH.

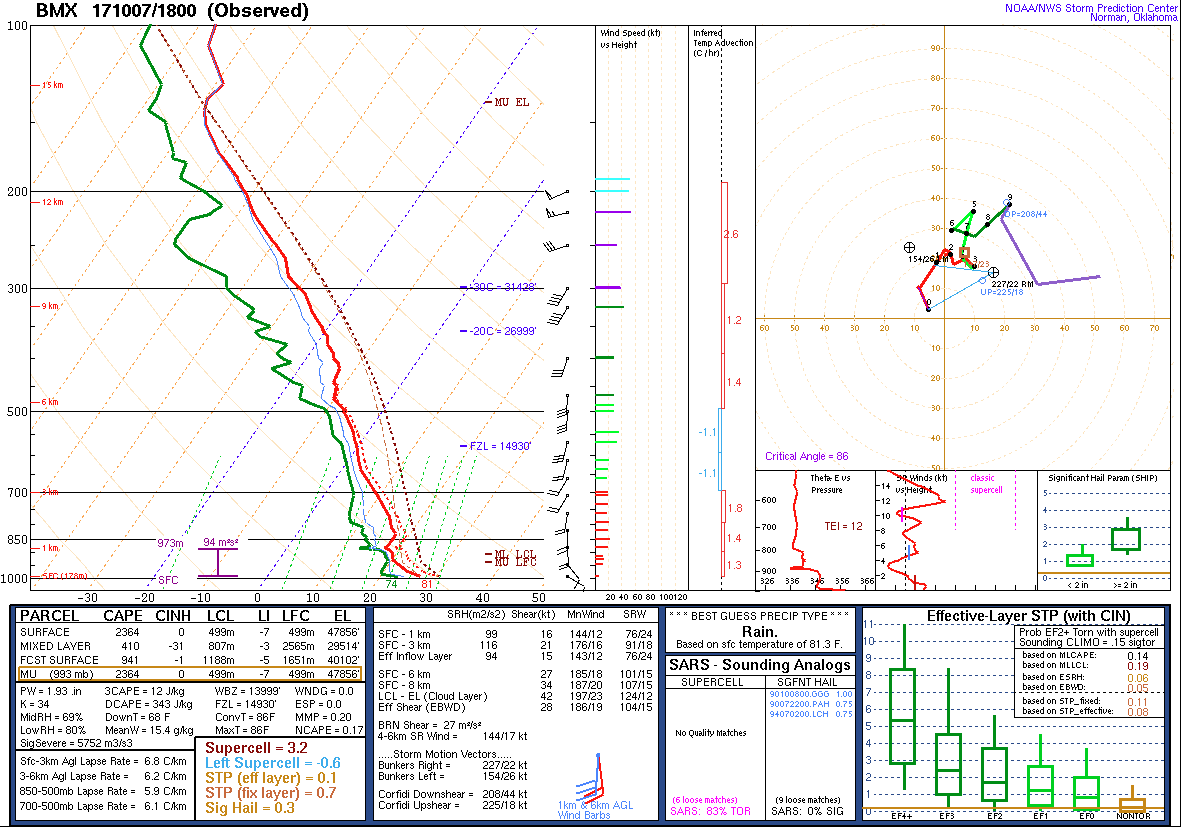
Hurricane-force winds and storm surge caused significant damage and flooding along portions of the Mississippi and Alabama coastlines. Farther inland, gusty winds of 30-50 mph downed numerous trees and power lines and caused many power outages along Nate's path. Several tornadoes touched down across Alabama, South Carolina and North Carolina. 

Record set by Nate:

  • 28 mph forward motion for 12-hr period on Oct 7th was the fastest ever recorded by a tropical system in the Gulf of Mexico.
 

Tornadoes

Location/Clickable Detailed Summary Link
Damage Rating/Estimated Maximum Wind Speeds
Injuries/Fatalities
Damage Path Length/Width
Starting Point/Time
Ending Point/Time
Wall Street Tornado
(Lowndes County)
EF-0
85 mph
None
2.9 miles
400 yards

3 S Hayneville 32.1438/-86.5919
655 pm

3 E Mosses 32.1771/-86.6222
700 pm
Autaugaville Tornado
(Autauga County)
EF-1
105 mph
None
3.9 miles
635 yards

2 S Autaugaville
32.4015/-86.6530
731 pm

3 W Autaugaville
32.4471/-86.6933
738 pm
Pletcher Tornado
(Chilton County)
EF-0
60 mph
None
3.0 miles
50 yards

3 NNE Pletcher 32.7383/-86.7677
820 pm

4 ESE Maplesville 32.7680/-86.8056
827 pm
Poseys Crossroads Tornado
(Chilton County)
EF-1
100 mph
None
6.0 miles
150 yards

1 ENE Campbell
32.8951/-86.8269
847 pm

5 SE Ashby
32.9783/-86.8526
900 pm
 

Wind Gusts

Wind Gusts
 

Rainfall Totals

Rainfall Totals

48 hr Rainfall Totals


Storm Reports, Rainfall Estimates and Tornado Story Map

To view this Story Map in full view, click here.

For a complete list of Storm Reports, click here.
 

Satellite/Surface/Upper Air

Satellite

Nate Oct 6-8 (GOES-16 Non-operational)

Nate at Landfall (GOES-16 Non-operational)

Surface Charts

Surface Chart

1 PM Oct 7th

Surface Chart

7 PM Oct 7th

Surface Chart

1 AM Oct 8th

Surface Analysis

7 AM Oct 8th

Surface Analysis

1 PM Oct 8th

Surface Chart

7 PM Oct 8th

KBMX Upper Air Soundings

KBMX Sounding

1 PM Oct 7th

KBMX Sounding

7 PM Oct 7th

KBMX Sounding

1 AM Oct 8th

KBMX Sounding

7 PM Oct 8th


Upper Air Charts

250mb Chart

250mb Chart at 7 AM Oct 7th

500mb Chart

500mb Chart at 7 AM Oct 7th

850mb Chart

850mb Chart at 7 AM Oct 7th

250mb Chart

250mb Chart at 7 PM Oct 7th

500mb Chart

500mb Chart at 7 PM Oct 7th

850mb Chart

850mb Chart at 7 PM Oct 7th

250mb Chart

250mb Chart at 7 AM Oct 8th

500mb Chart

500mb Chart at 7 AM Oct 8th

850mb Chart

850mb Chart at 7 AM Oct 8th

250mb Chart

250mb Chart at 7 PM Oct 8th

500mb Chart

500mb Chart at 7 PM Oct 8th

850mb Chart

850mb Chart at 7 PM Oct 8th


Other Links