
Scattered thunderstorms with severe gusts, hail and a tornado risk are possible near a cold front from the Ohio Valley to the Mid-Atlantic tonight. Tropical Storm Bertha is expected to bring tropical storm conditions to portions of the Gulf Coast from the panhandle of Florida into Louisiana through Wednesday. Read More >
7-8-15 Heavy Rain Event in Boise - Case Study
By Aviva Braun
National Weather Service Boise, Idaho
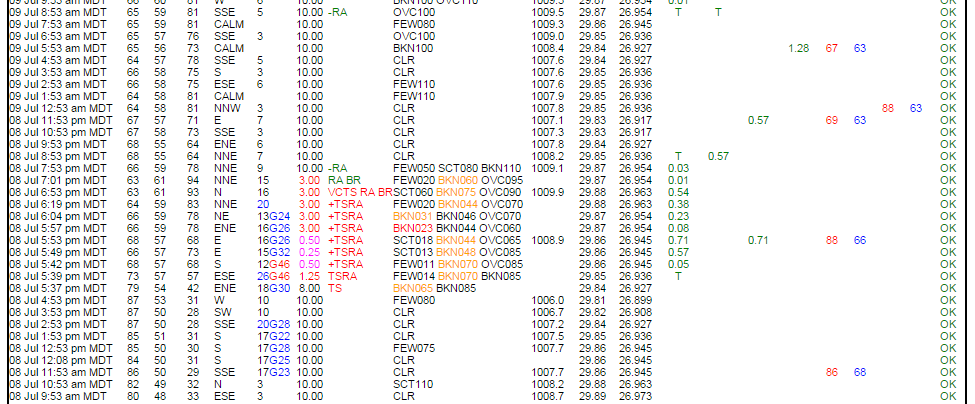
On July 8th, 2015 we had a “classic” heavy rain event in Boise. We have two incredible reports from that day: 0.57 inches in 10 minutes and 1.28 inches storm total at the BOI ASOS! Many reports came in about local street flooding and visibility issues. We even had some home and business flood damage reports.
Here is what the ASOS recorded:

In plain English:
|
Elapsed Time |
Actual Time |
Accumulated Precip Value |
|
5:39 pm |
T |
|
|
3 |
5:42 pm |
0.05 in |
|
10 |
5:49 pm |
0.57 in |
|
14 |
5:53 pm |
0.71 in |
|
18 |
5:57 pm |
0.79 in |
|
25 |
6:04 pm |
0.94 in |
|
40 |
6:19 pm |
1.09 in |
|
1:14 |
6:53 pm |
1.25 in |
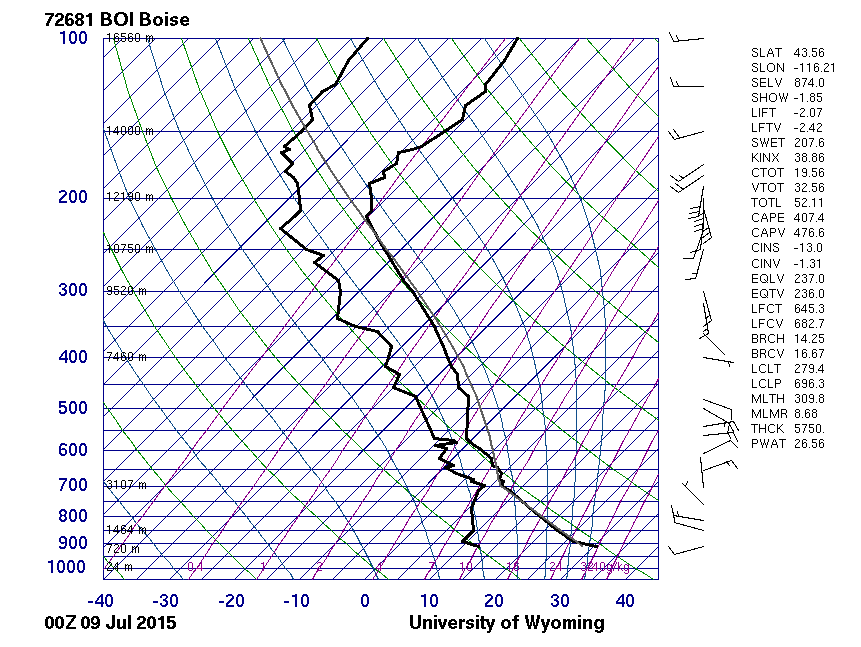
The convective summary for the day was exciting and unusual. We were in an overall southerly flow ahead of a closed low over CA with a few short-waves rotating around the east side of the low, one of which would move over our CWA on the 8th. PW values were near 1 inch and the storm motion was around 10 kts. The environment was generally unstable, as shown by the skew-T found below, with CAPE values at about 400 Jkg-1 and LI values around -2. Notice that winds between 700-550 mb are out of the NE - these winds may have have helped steer the storms to the SW (towards Boise) behind the outflow boundary. All of these factors culminated in slow-moving, wet storms which produced areas of heavy rain and possibly small hail.
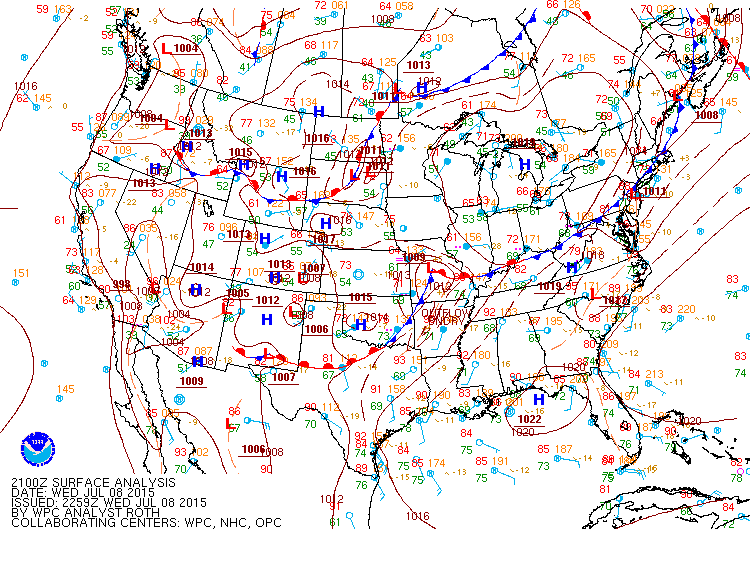
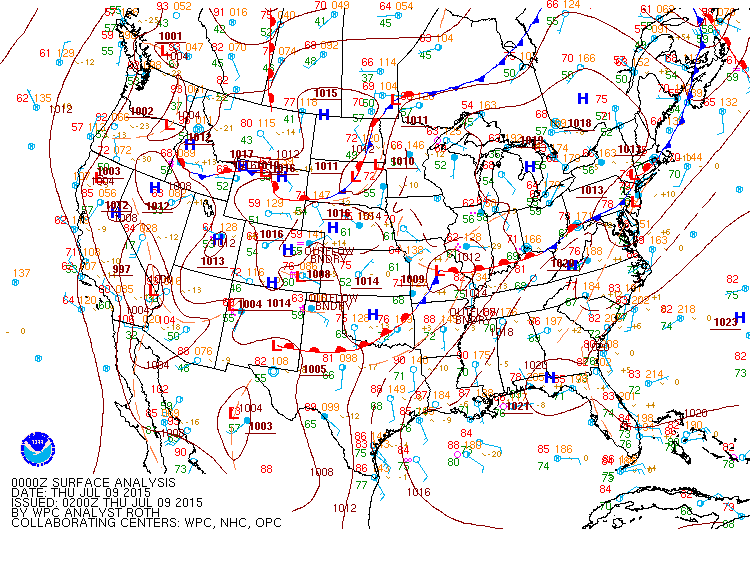
The next 2 plots are what the WPC had for the surface analysis for the same time period. As early as July 8 at 21Z (3 pm), the stationary front had set up over our CWA with a surface high to the SW. We didn’t really see any changes to the pattern before the event began.
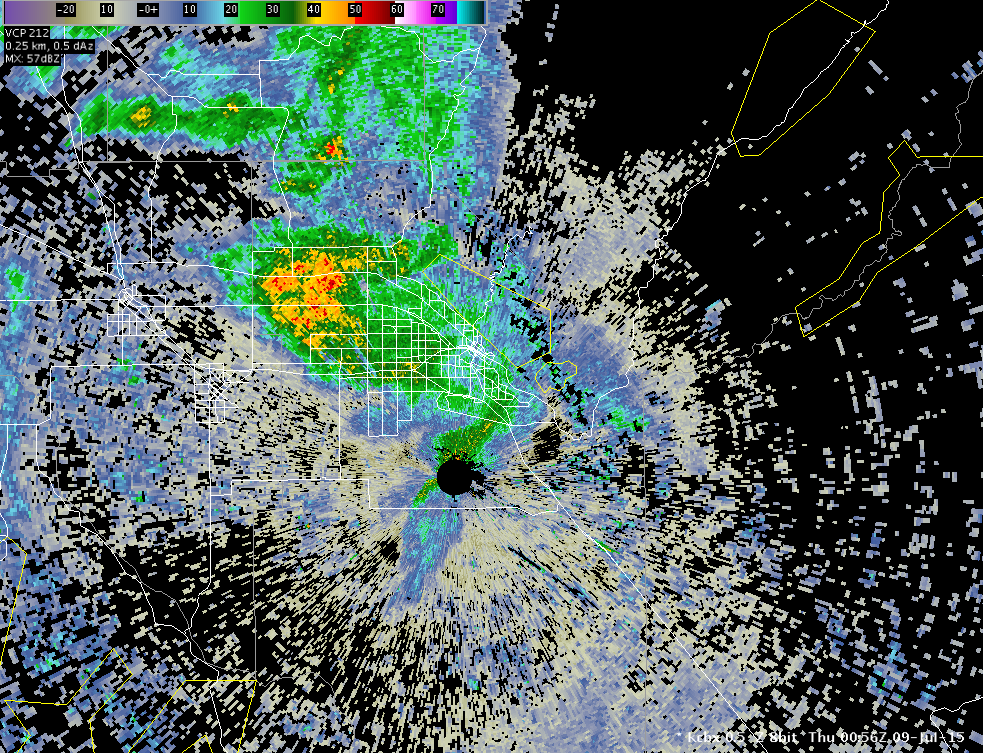
Let’s get into the actual event by looking at a reflectivity loop:
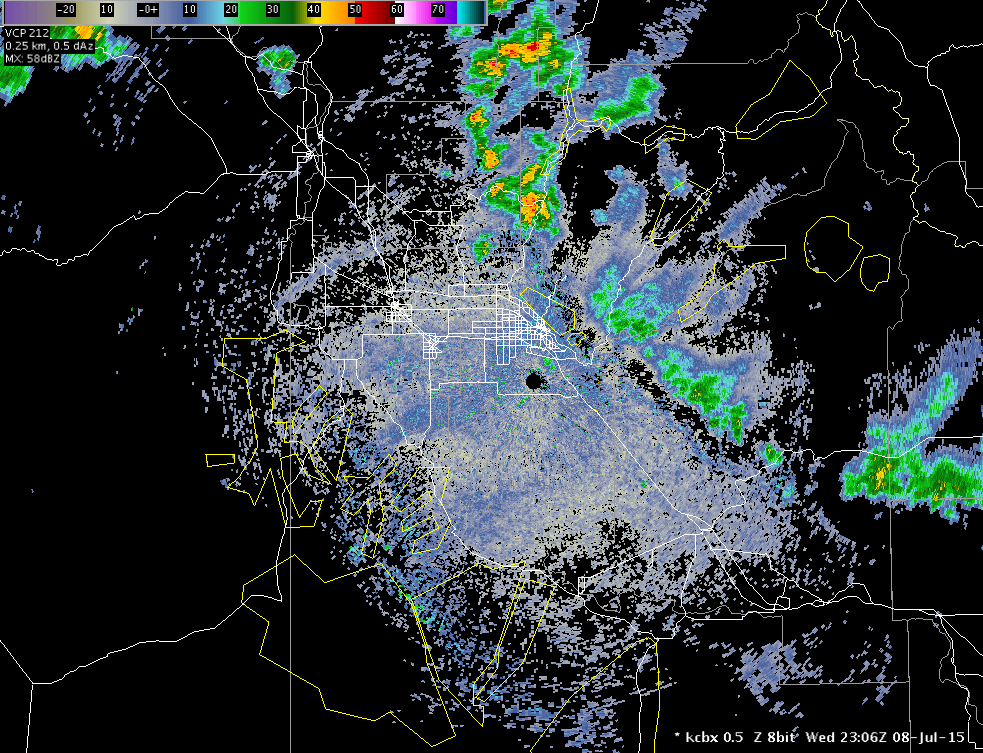
The outflow boundary served as the forcing mechanism for thunderstorm development, allowing several systems to pop up in its wake across the region. We first saw high reflectivities develop over SE Boise, then redevelop over the North End, and then move west to NW Boise. The outflow boundary moved fast, leaving the storms systems behind moving at a measly ~10 kt pace. An areal flood advisory was issued at about 6:30 pm (0030Z), which would last through 9 pm.
Let’s move on to a DVIL loop:
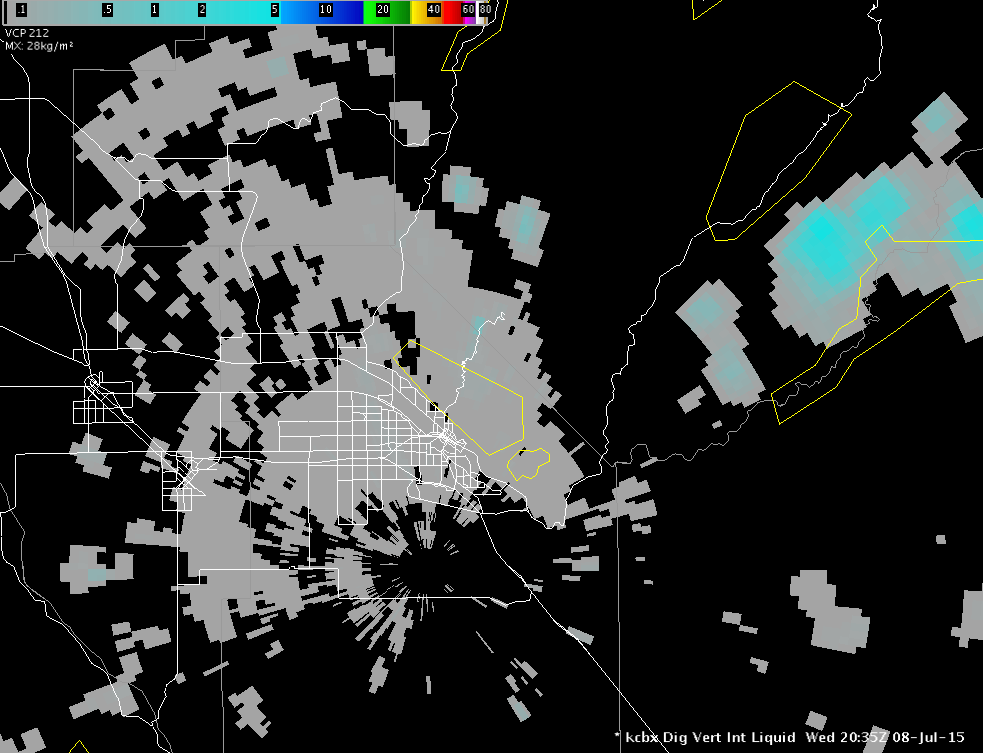
Remember how the Boise ASOS recorded 0.57 inches in 10 minutes just after ~5:40 pm?
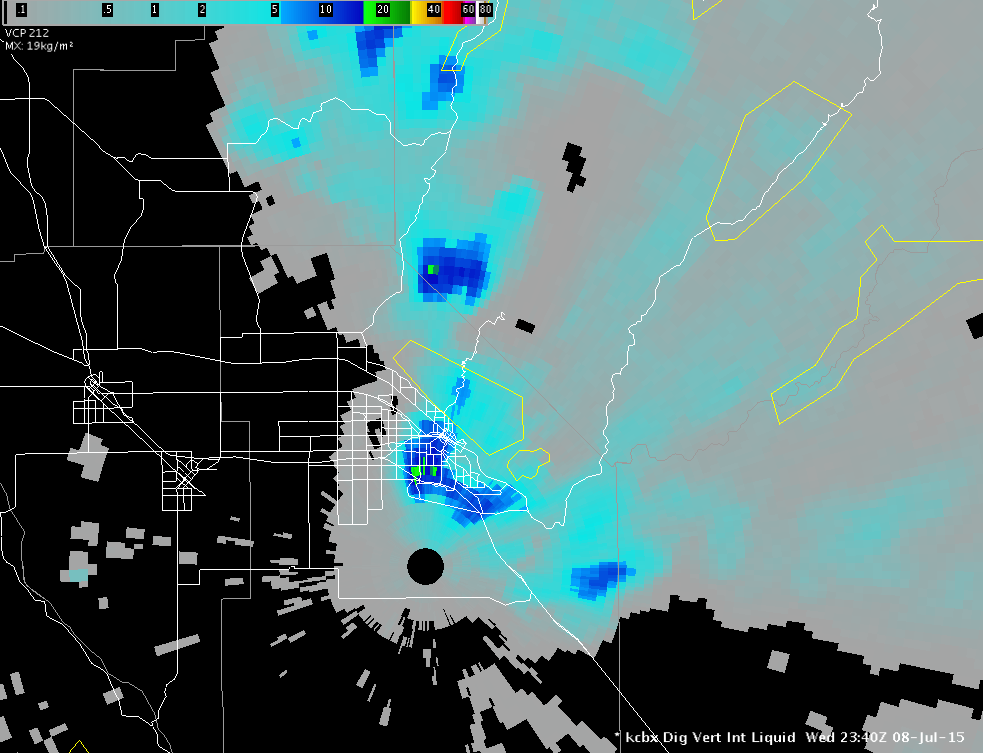
The max value in this frame is 18.83 kgm-2.
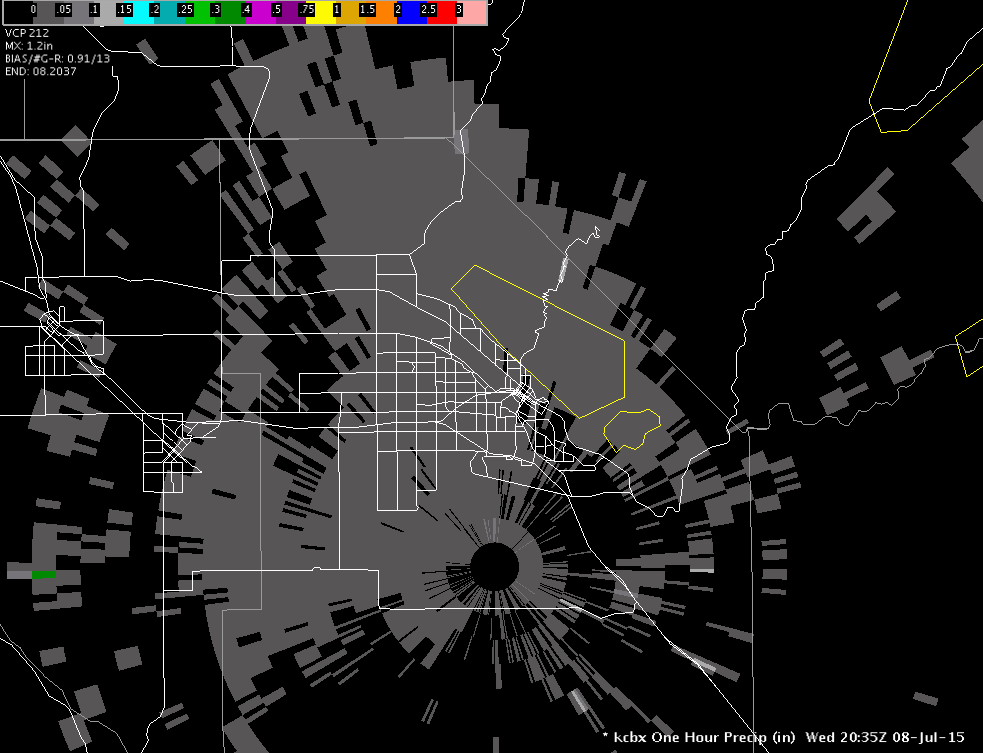
One hour precip showed some impressive values just after that at 5:51 pm (2351Z):
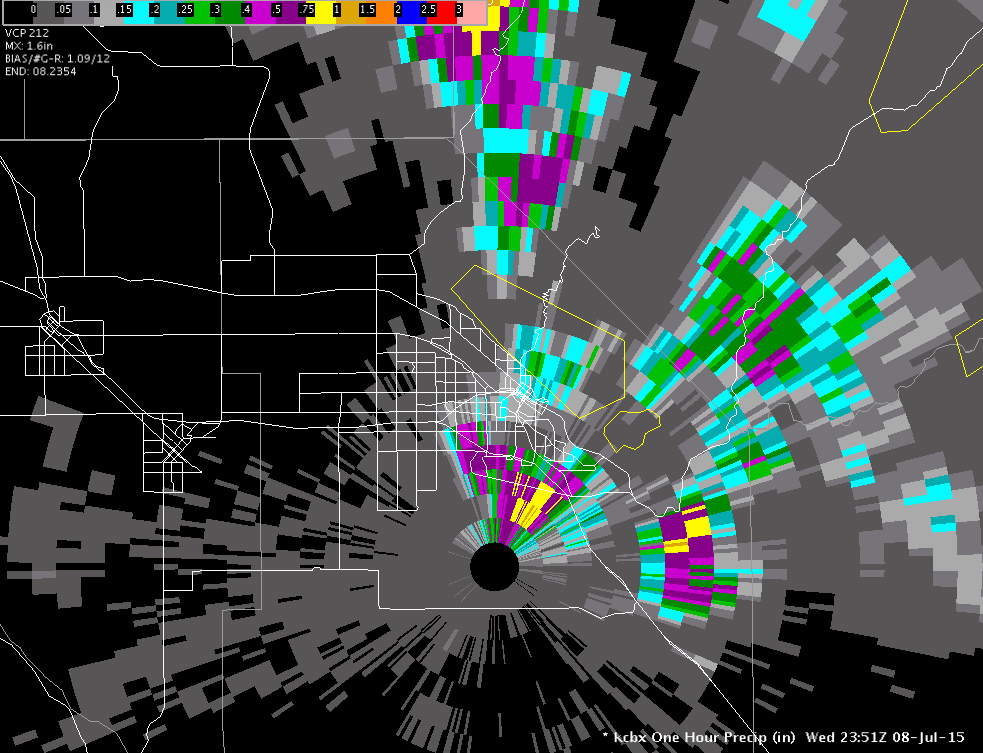
This was one of the many examples over the course of the night where certain locations/pixels had high OHP values over several frames (4-5). These were where the impacts were felt the strongest.
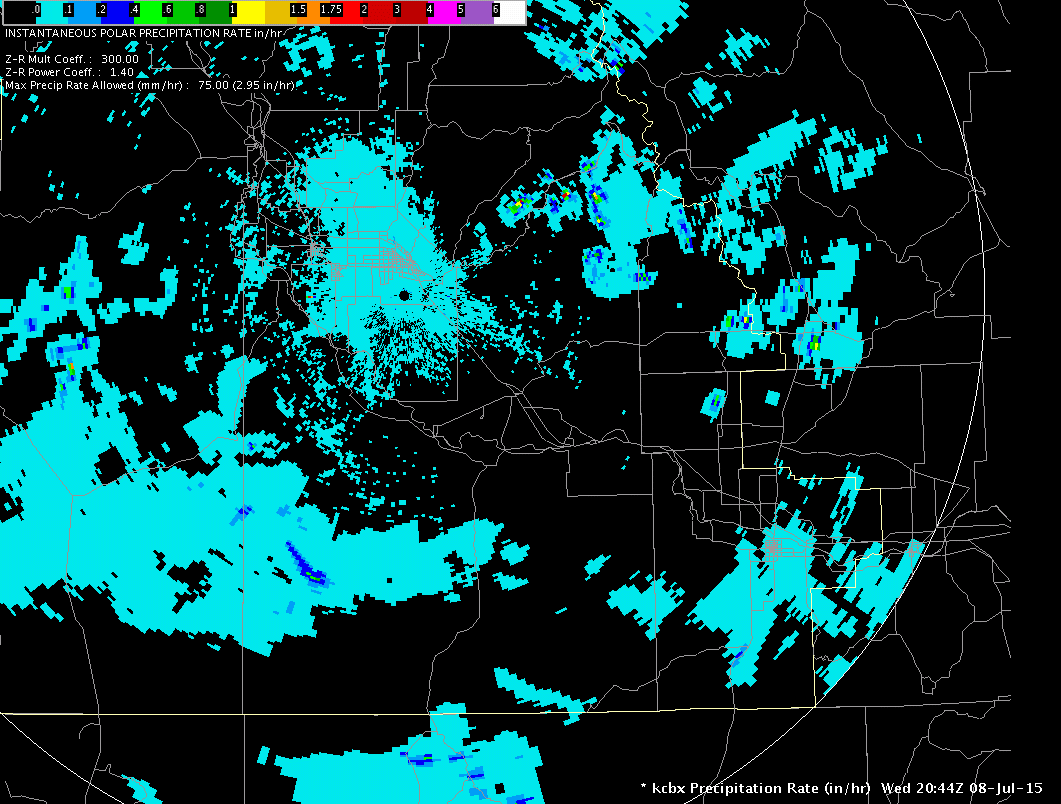
The precipitation rate animation shows the same thing - that several locations experienced heavy rainfall rates over a short period of time. Seems like the radar did a great job of picking up what was occurring. (Sorry - I failed to save more precip rate images/animations).
Here is the OHP loop for the evening:
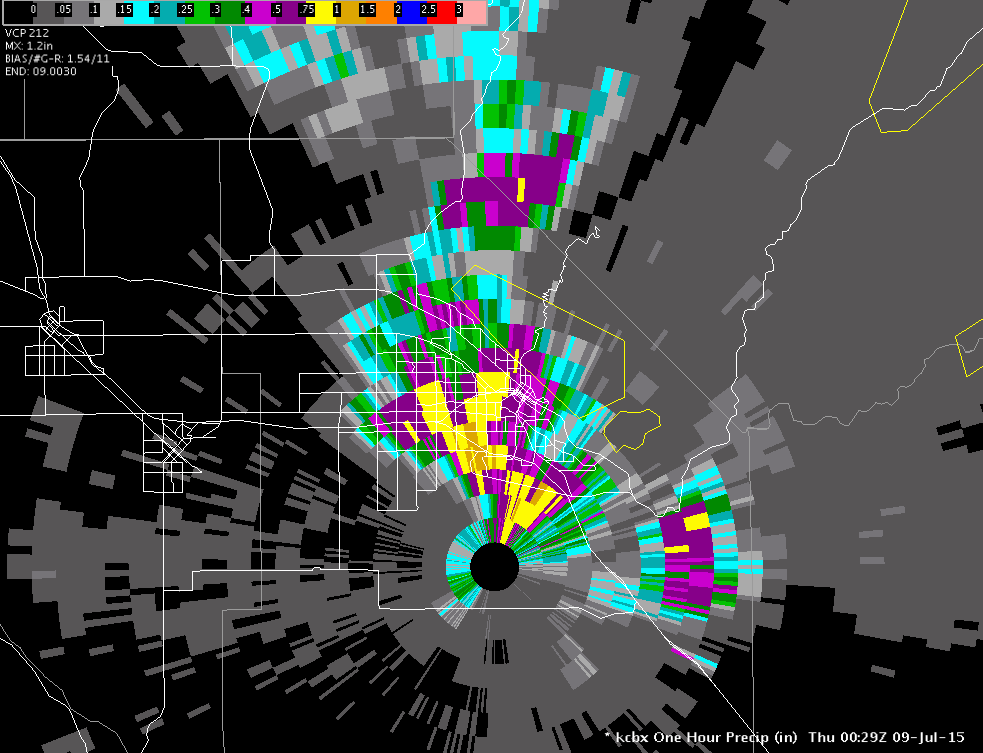
Let’s zero in on 6:29 pm (0029Z):
This coincided with when the North End was hardest hit and when the reports of heavy rain came from drivers along I-84.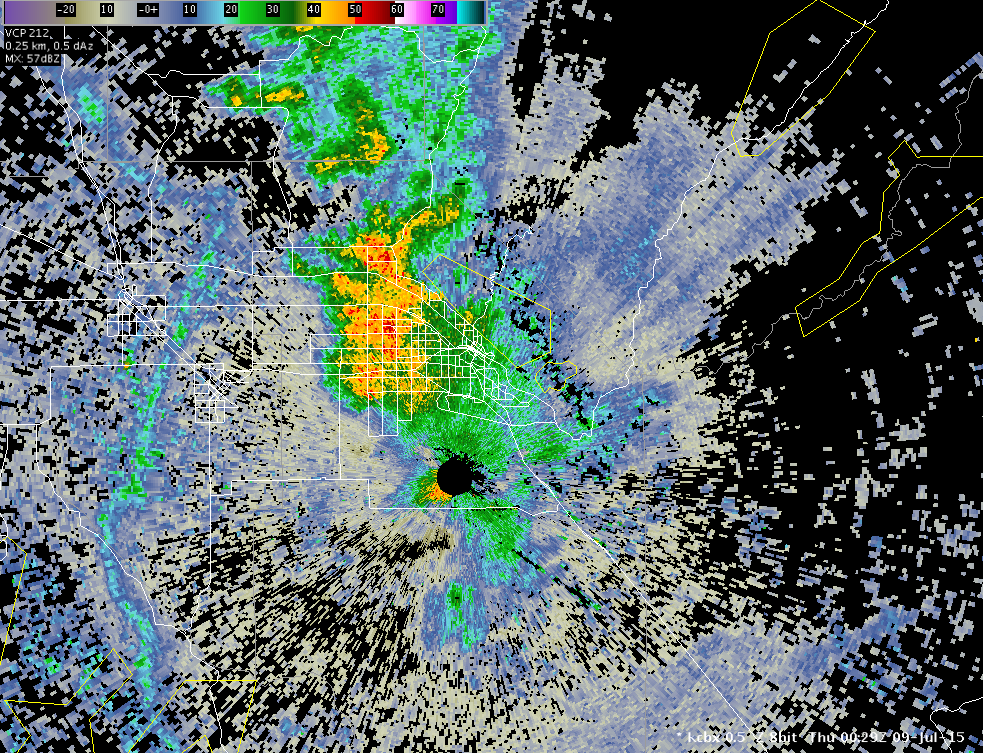
And at 6:56 pm (0056Z):
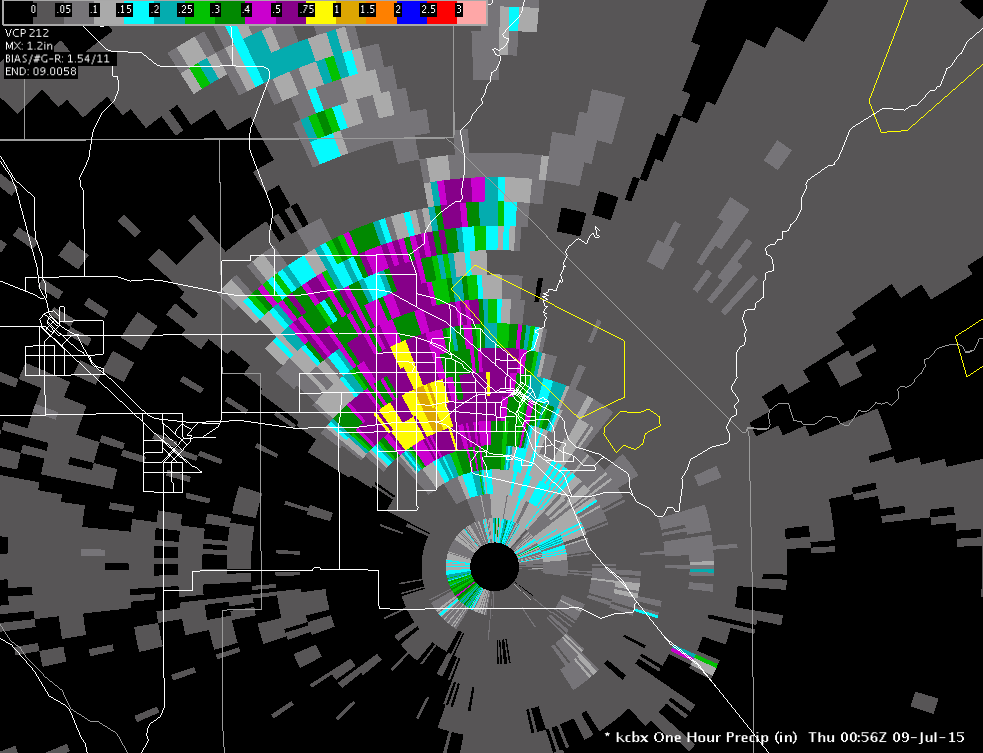
Northwest Boise is the lowest elevation area of Boise...my place had a lot of pooling water in the parking lot….yes, I live in a flood-prone area, but I live on the 2nd floor!
Radar summary: OHP proved to be on point in indicating high impact areas. Areas of flooding occurred over locations with OHP > 0.75 inches over several frames, generally 4-5. DVIL values showed what we already knew, that these storms were “juicy” as Chuck would say. Z showed that the storms developed in the wake of the outflow boundary and followed its general course. Also, the highest impact areas were not collocated with the highest Z values; this could also be a product of storm development within the cone of silence.
Josh made an interesting observation:
The outflow boundary was quite long, yet east and south of Boise saw little to no thunderstorm development (eventually, South Ada county did see some thunderstorms). Thunderstorm development occurred mostly from Boise to the west. I looked at the Obs Temperatures grids in GFE and noticed that Mountain Home through the Magic Valley was cooler than the west end of the valley - probably from cloud cover earlier in the day. Ontario was 90 and Boise was 87 F, compared to Mountain Home's 82 F and Jerome's 72 F, before the outflow came through.
PS: I have many more radar frames saved if you’re interested.

