
Scattered thunderstorms with severe gusts, hail and a tornado risk are possible near a cold front from the Ohio Valley to the Mid-Atlantic tonight. Tropical Storm Bertha is expected to bring tropical storm conditions to portions of the Gulf Coast from the panhandle of Florida into Louisiana through Wednesday. Read More >
Boise CWA August 2015 Wind Events
By Aviva Braun
National Weather Service Boise, Idaho
Collaborators: Josh Smith, and Stephen Parker
This August brought some interesting wind events, both in the Treasure Valley, one in Boise proper.
We’ll first take a look at the Boise event (8/10/15) and then move on to the upper Treasure Valley event (8/11/15). Are there similarities between the two events and/or major differences? Can we learn anything from what we saw?
8/10 event:
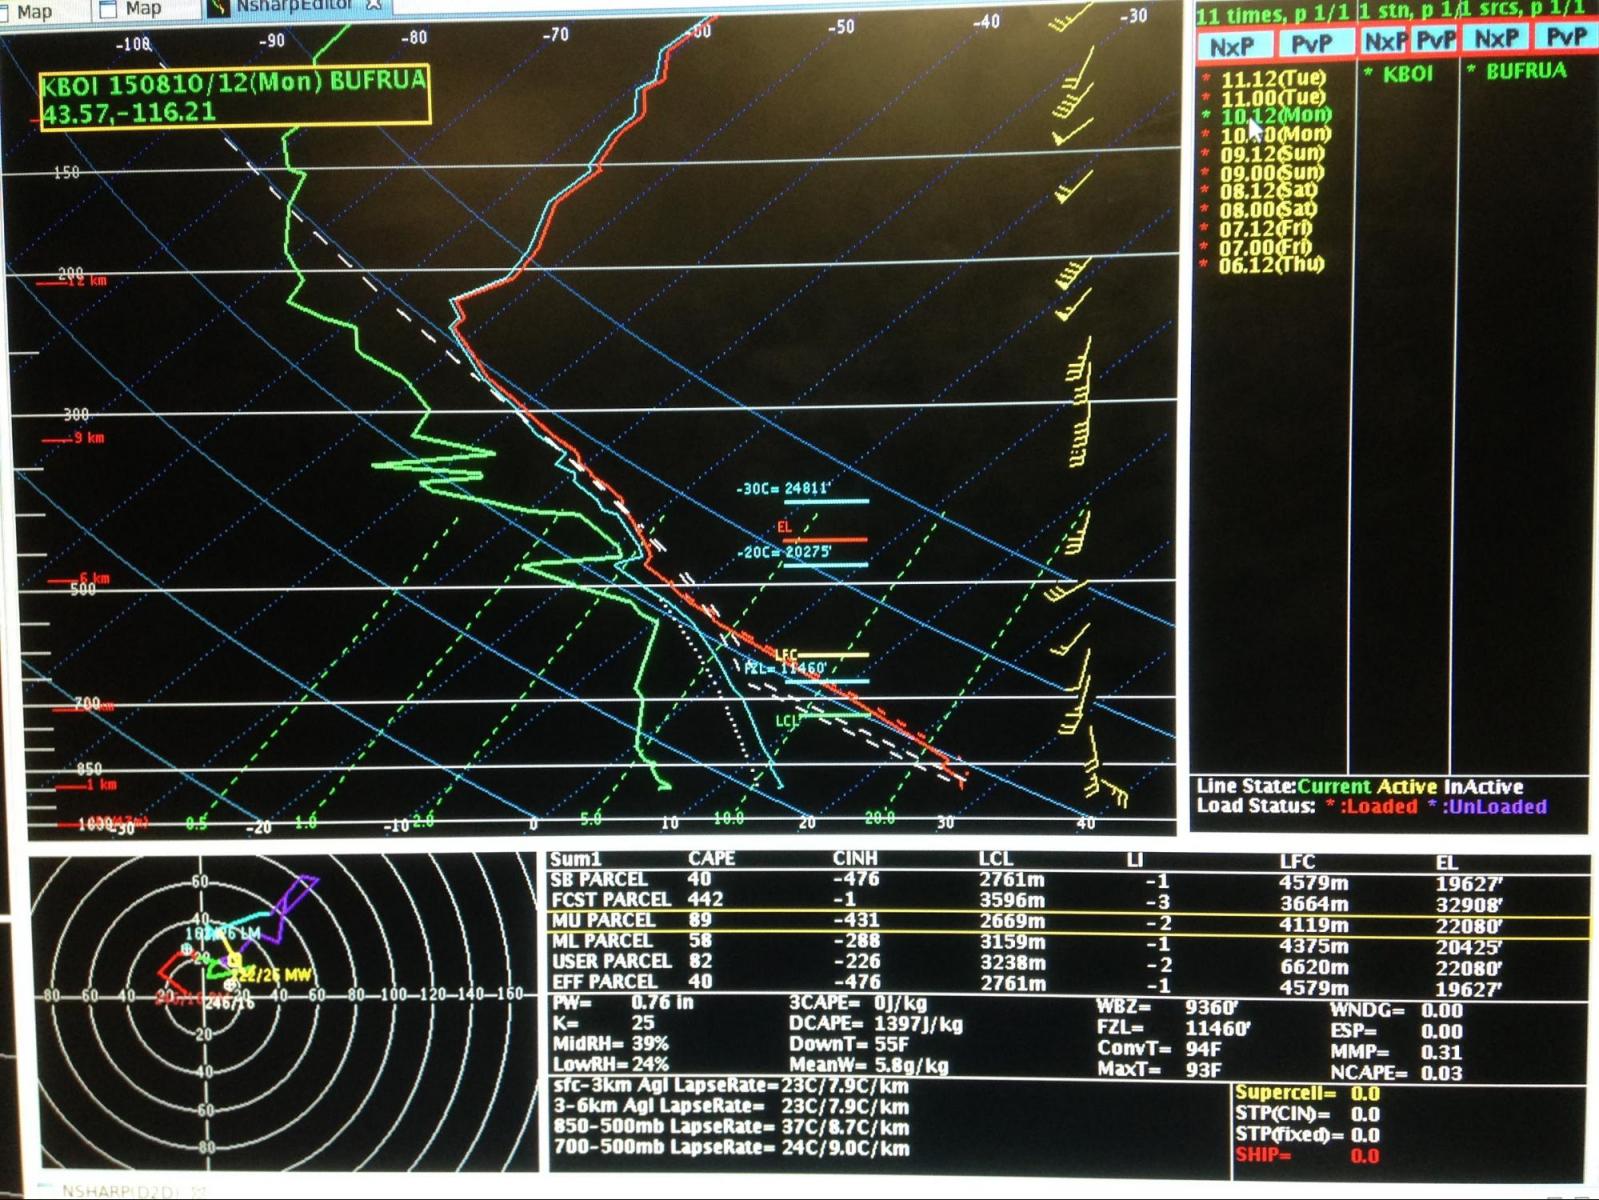
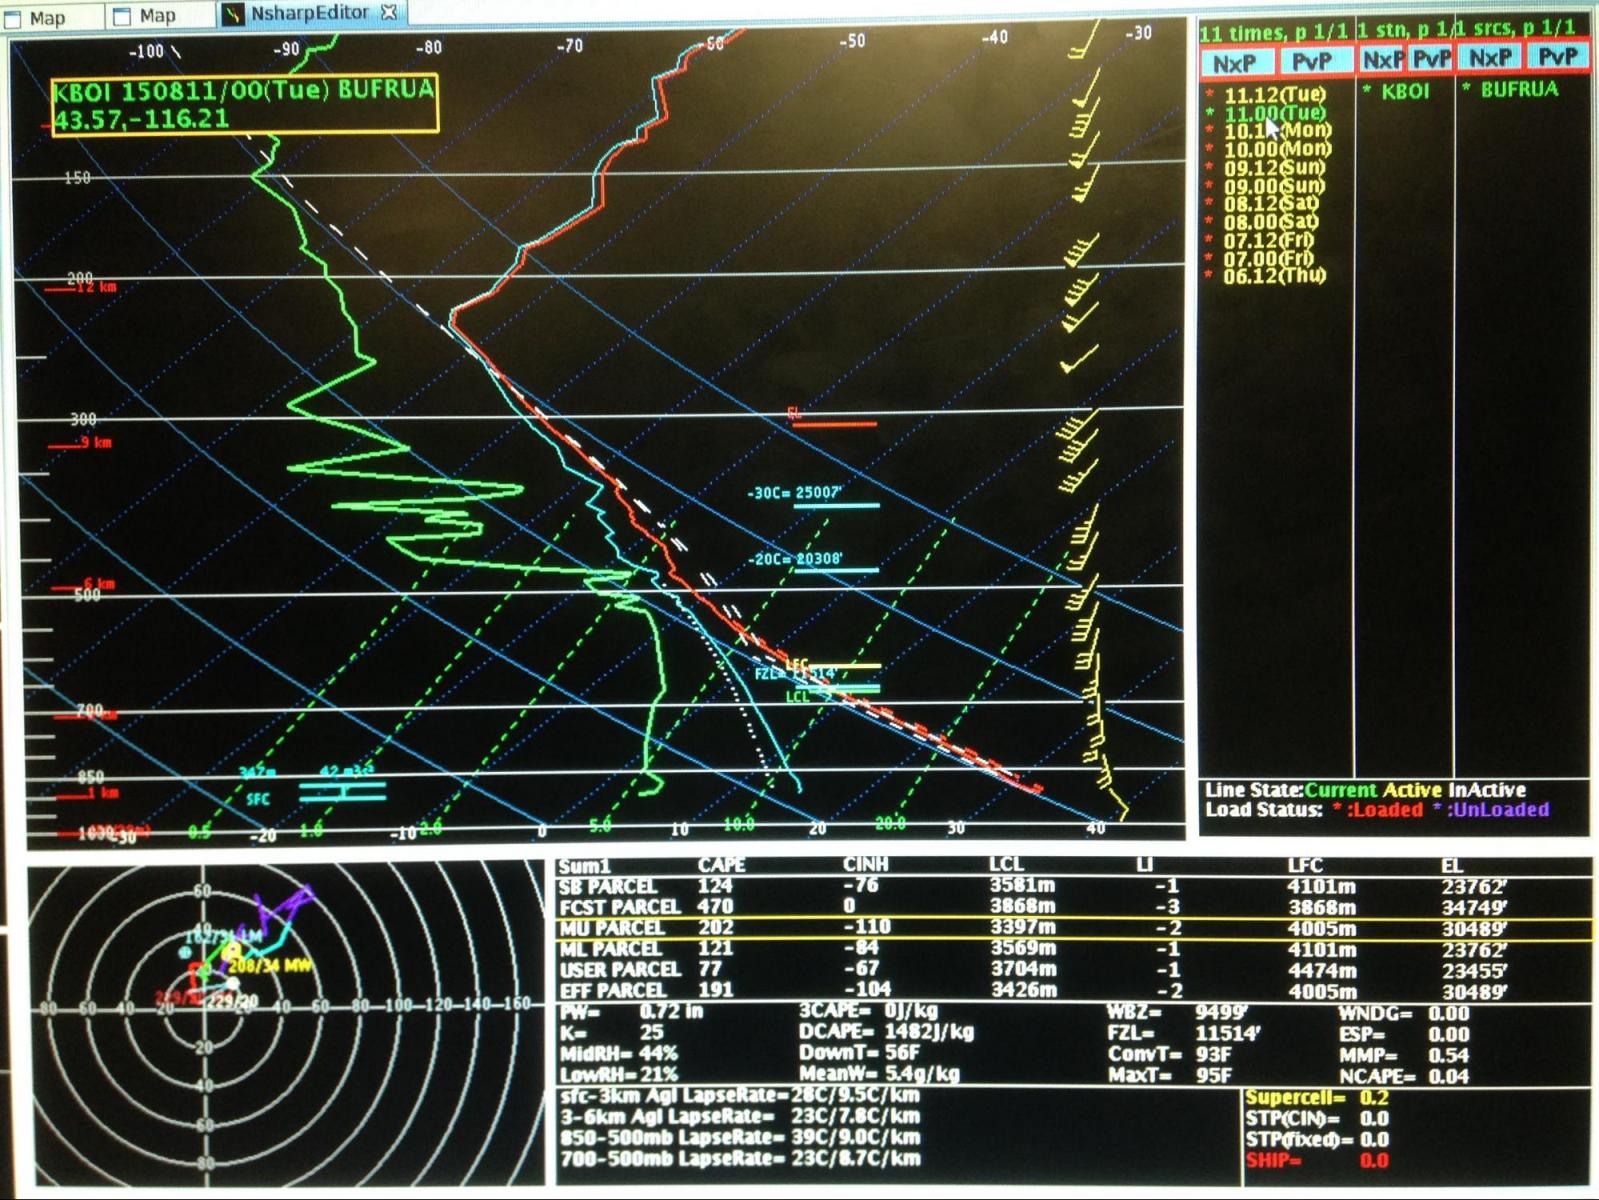
The morning sounding (12Z) showed a minimum amount of CIN, some decent CAPE, high DCAPE values, a large PW, a convective temp of 94F that we thought we’d pass, and most importantly, an inverted-V. We definitely had the potential for a wind event, if not a microburst event. Note that there is little mid-layer instability - if something were to develop, it could easily break though.
Looking at the 18Z and 21Z surface analyses, the region was under a low pressure pattern. Neither plot is that different, so I’ll show the 21Z analysis:
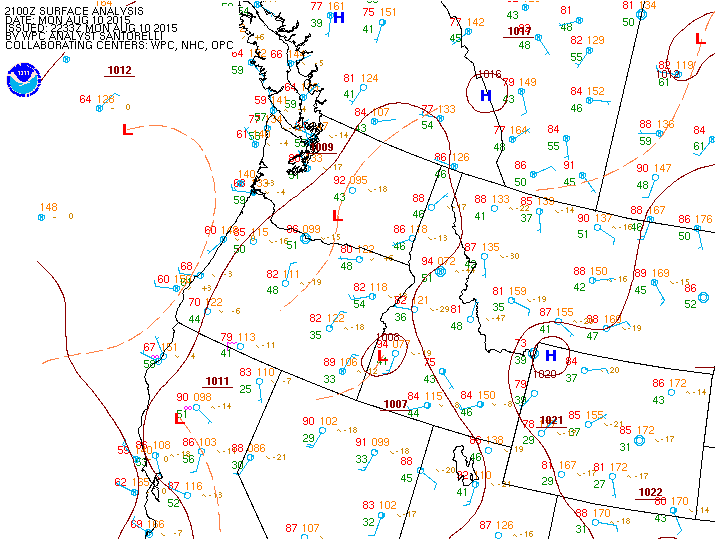
Watching the reflectivity loop, it it clear that when two outflow boundaries collided, a potent storm formed (almost directly over the radar site, which is too bad) at about 22Z, and then died just as quickly, producing winds 50+ mph as it collapsed.
Here is the 0.5 degree reflectivity loop:
We can see the potent wind maxima produced by this system in the velocity loop:
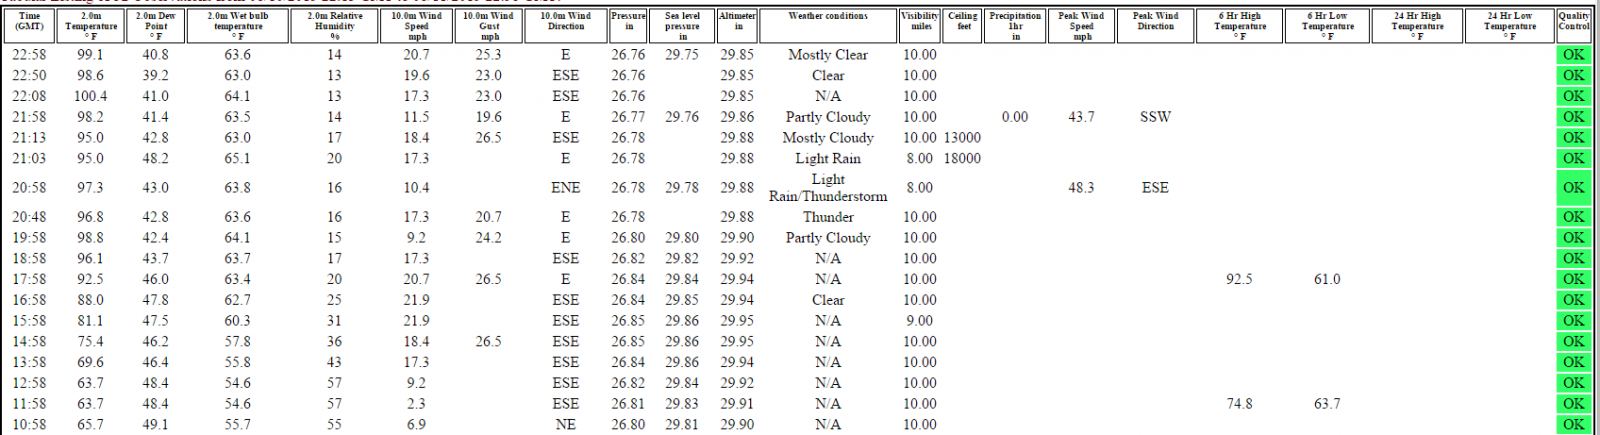
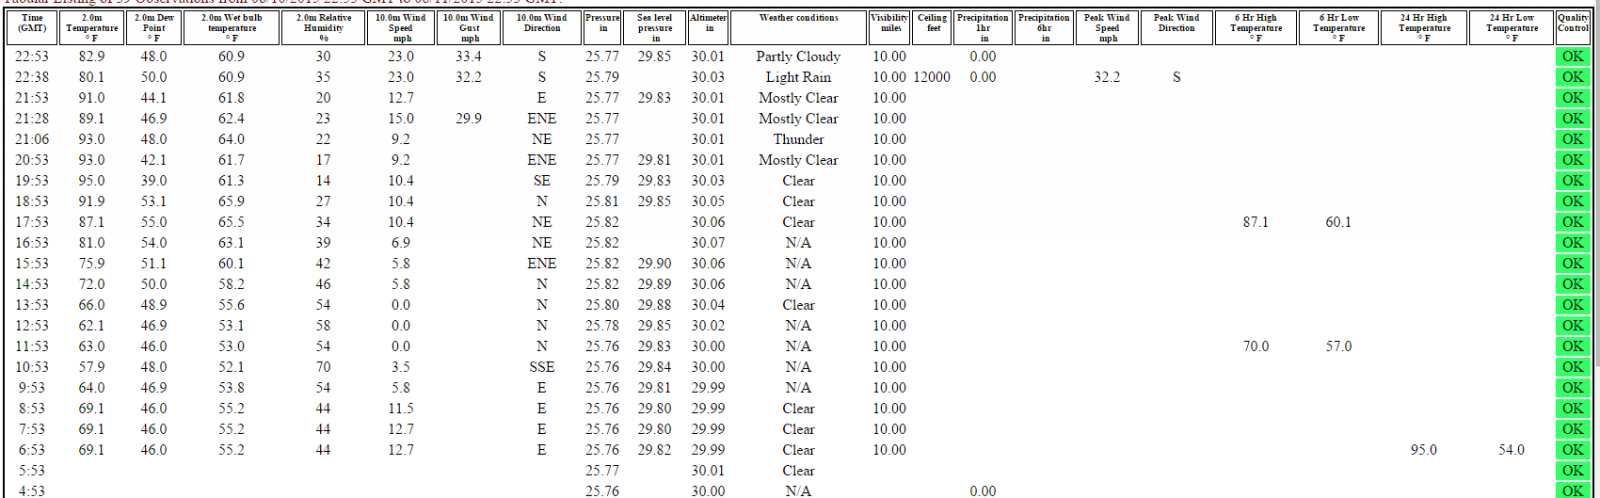
Radar output had a wind maximum of 43.7 kts in the southern polygon at 22:13Z and 45.7 kts in the northern polygon at 22:08Z. The radar output was underestimating the strength of the winds, as you can see in the ASOS output:
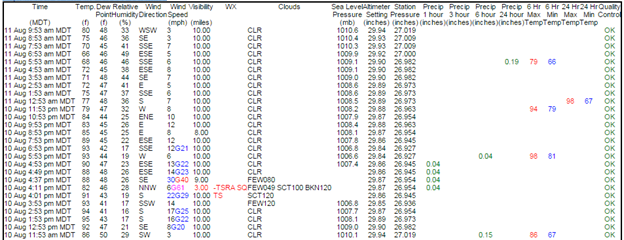
The ASOS recorded a 61 mph wind and 0.04 inches of rain in the same reading. Also, there was a short-lived 9 degree drop from the rain-cooled air!
We had a number of LSRs in addition to the ASOS reading. Also, there were many reports of fallen tree limbs, and one of a damaged car.
The 8/11/00Z sounding isn’t too different than the morning’s sounding. Some differences include: 1. the little CIN that we had in the morning sounding is no longer an environmental factor - this means that storms were able to develop along outflow boundaries, which is what we saw, and 2. the winds below 500 mb were now more uniform, at least in direction.
8/11 event:
August 11th, began with a weak cap / more CIN than the previous day, though CAPE values were still decent, as were the DCAPE and PW values. Also, we had a convective temp that we hoped to surpass again. Could we have a similar occurrence to the day before? It would probably be a bit harder to develop such a strong storm if the 500 mb stable layer were to stick around for the entire day. We’d need a kicker (like a shortwave) to break through it - there was no such thing in the day’s forecast. Something to note: 10 kt surface winds, versus on the 10th we had 25 kt surface winds.
The surface analyses are interesting. We have high dewpoints over SW ID, increasing winds, and a low pressure center building up over the ID-OR border. The 21Z and 00Z analyses are displayed below. The 00Z analysis was mid-event.
Let’s take a look at the reflectivity loop:
The storms that developed were not as impressive as the day before, though the storms covered a much larger area. Because of the areal coverage, a rain-cooled cold pool was able to develop an outflow boundary. Notice how the outflow itself wasn’t able to get much going - that was probably due to the 500 mb cap. It could also have been due to too much cloud cover.
Let’s look at the velocity loop:
Radar velocity output was probably more accurate this time around. Here are a few of the radar velocity outputs: 53.5 kts at 23:21Z, 63.2 kts at 23:51Z, 49.6 kts at 23:54Z, 45.7 kts at 00:31Z, and 51.5 kts at 00:17Z.
Here are the MUO obs. It’s max recorded wind gust is 25.3 mph. However, we have a report from KMUO AWOS with a max wind gust of 51 mph.
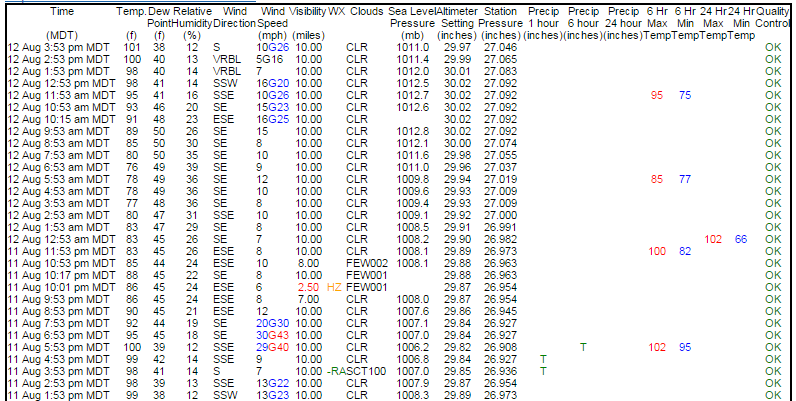
Twin Falls had a max recorded wind gust of 33.4 mph. However, a mesonet site in Twin Falls county recorded a wind gust max of 50 mph. Also notice the 11 degree drop as the outflow boundary passed through. Glenns Ferry recorded a similar temperature drop, from upper 90s at 22Z to mid 80s 45 minutes later.
Boise’s max gust was 43 mph.
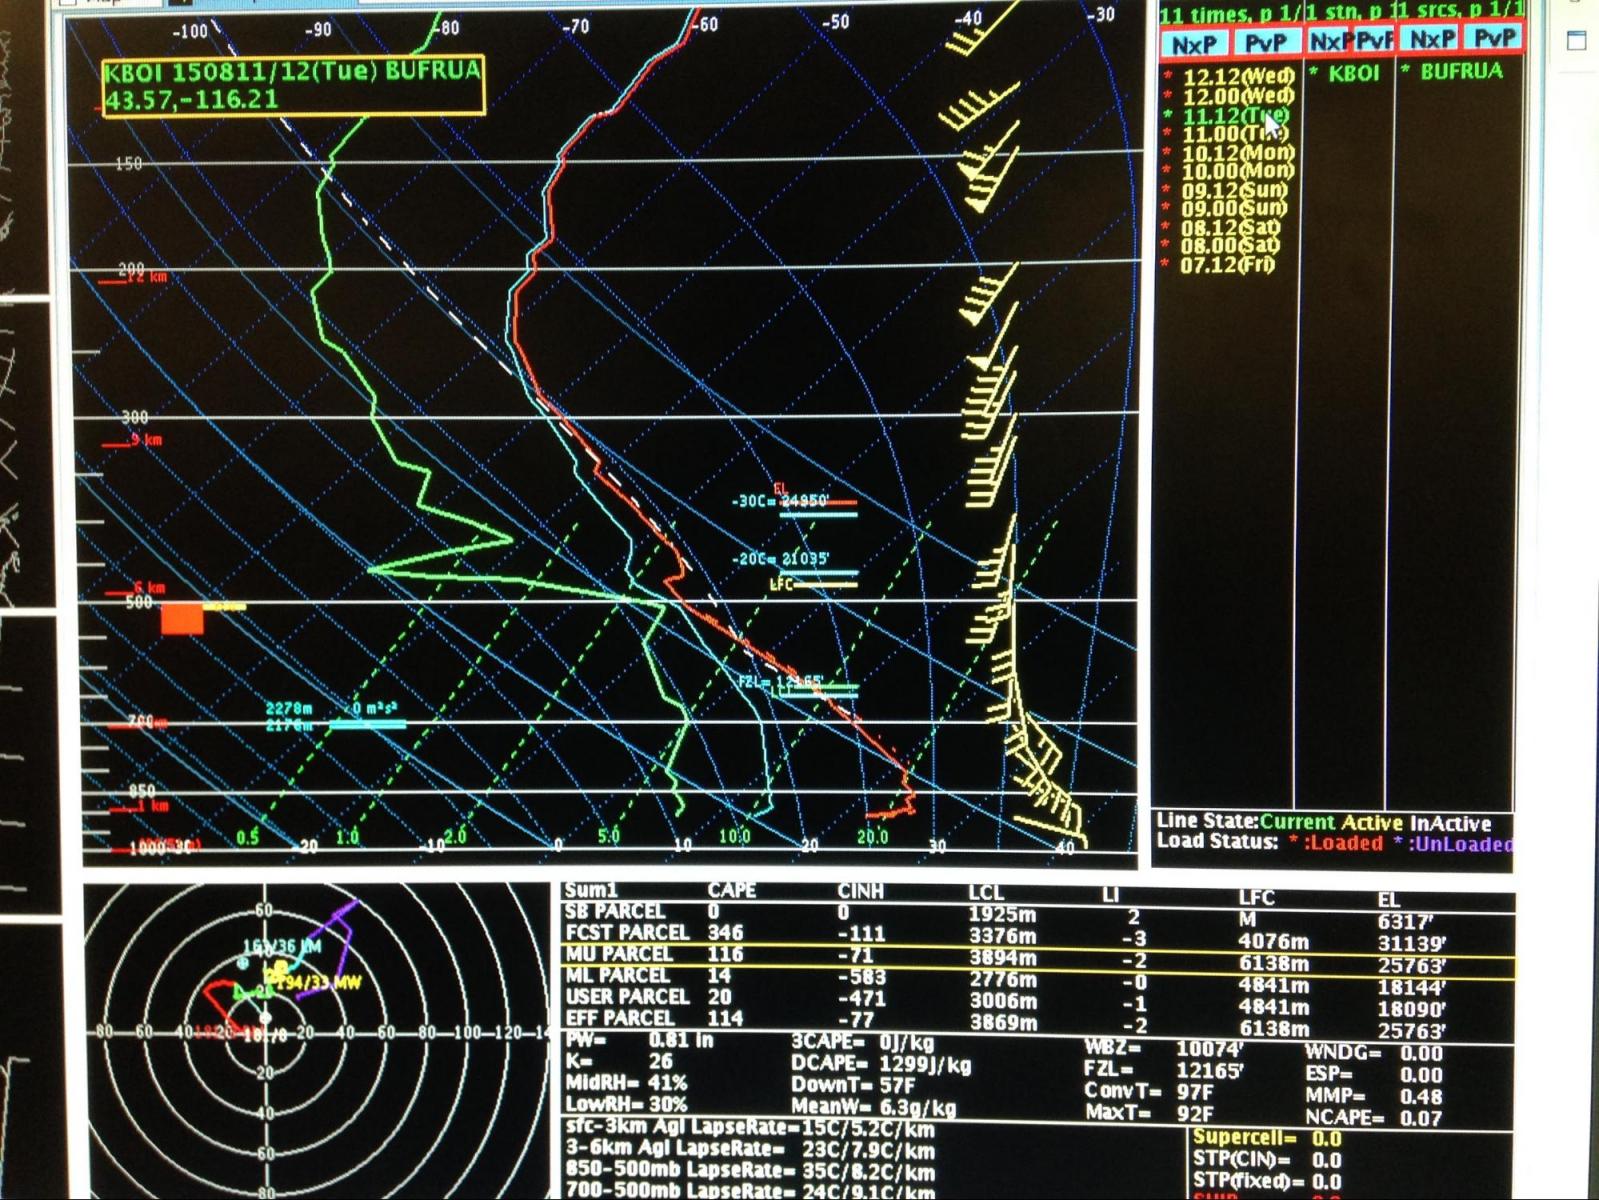
The balloon launch was around when the winds peaked in Boise:
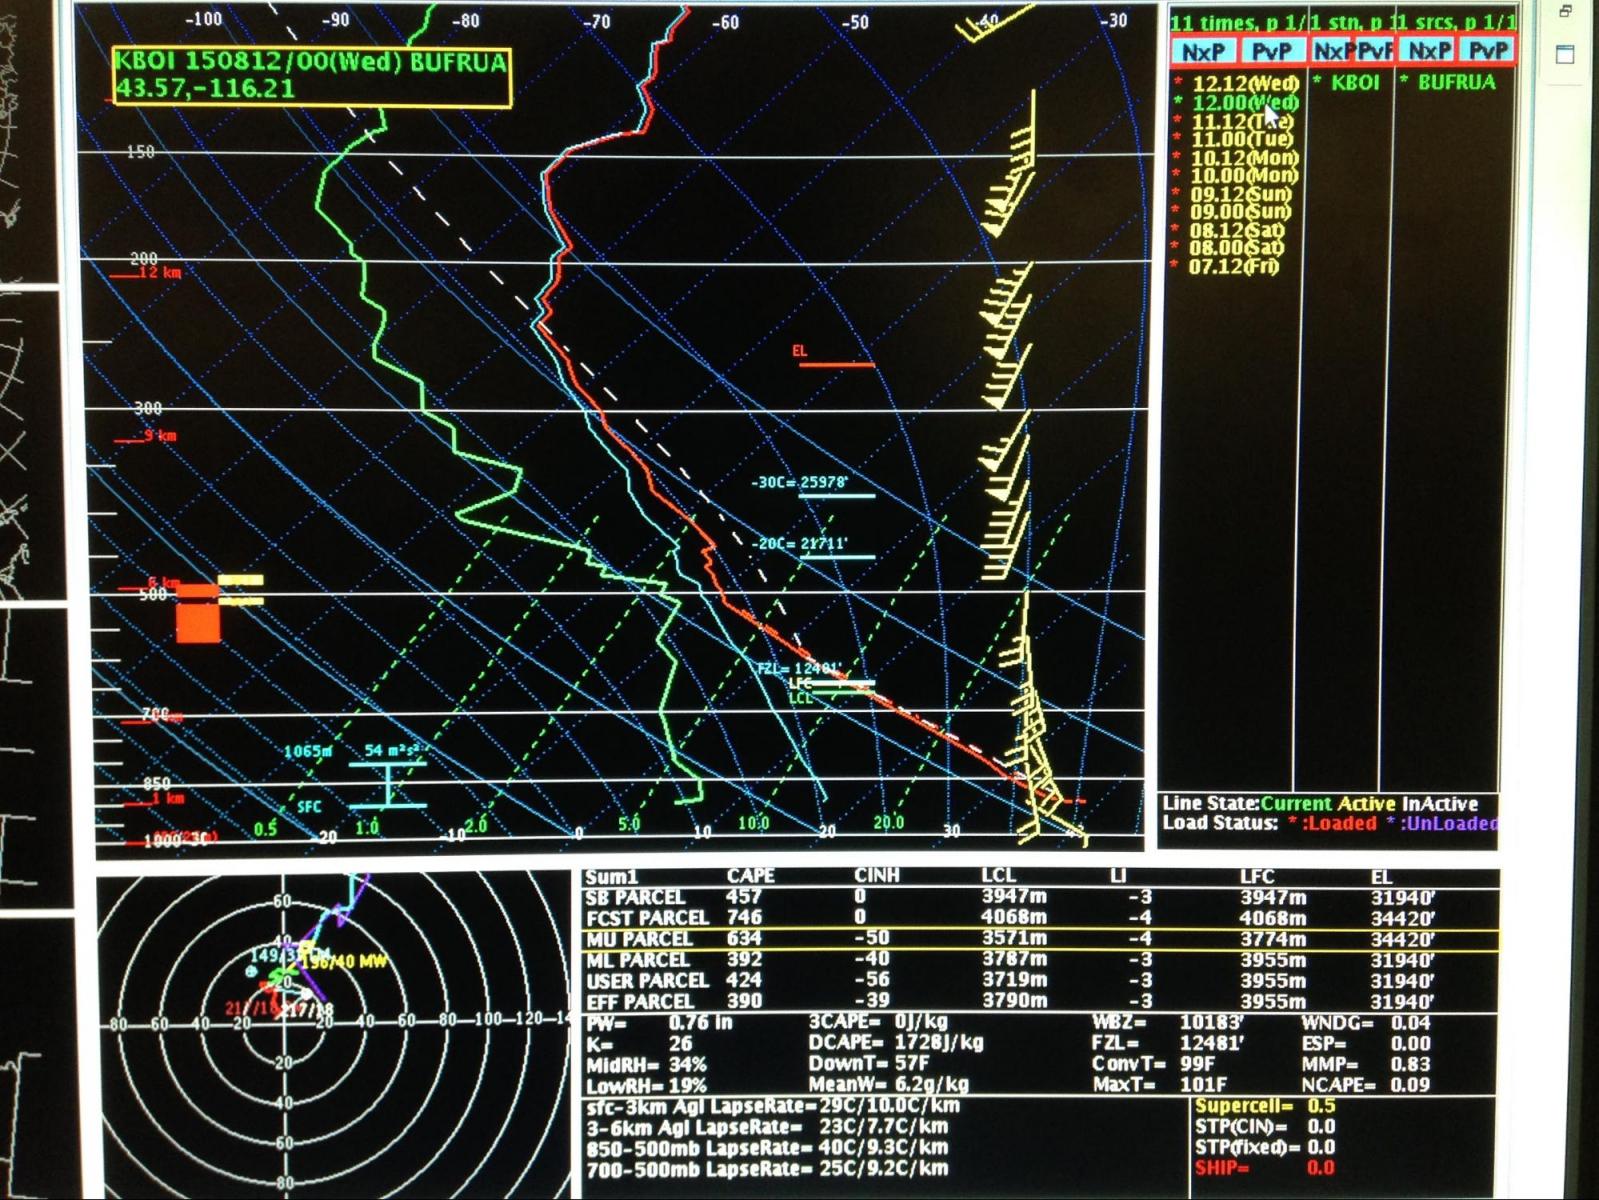
Instability values still look good, but the 500 mb cap is still there (though minimal) and the stronger winds don’t seem to have made it to the surface.
There were many reports of fallen tree branches, some 8-10 inches, and many wind gusts. Also, power was disrupted to over 1500 customers in Mountain Home. Despite the number of sub-severe reports (at least at the obs sites), could the outflow boundary moving down valley (downhill) have helped give the winds a bit of a boost in order to cause maximum damage?
So, lets go back to the original questions:
Are there similarities between the two events and/or major differences? Can we learn anything from what we saw?
Their real similarities are in the stability values and the inverted-v soundings. Still, neither event behaved the same, though both were obviously capable of producing strong winds. Why was one atmosphere not capable of producing a long-lived event, while the other wasn’t able to produce strong storms? The answer most likely lies in the mid-level stability differences between the two days. The cap that remained throughout the day on the 11th around the 500 mb level seems to have succeeded in preventing stronger storms from forming. However, we should note that while the upper Treasure Valley event did not look menacing on radar at first, it was able to produce very strong winds over a large radius. The Boise event was more isolated. It seems as though the 10th was a microburst event and the 11th was an outflow event.

