
Upslope snow showers will continue through tonight, with 2-7 inches expected in the favored areas. These are along the spine of the Greens in Lamoille, Franklin and Orleans counties in Vermont, and in a line across the northern Adirondacks from around Star Lake in St. Lawrence County to Lyon Mountain. Higher totals will fall in the mountains. Blowing snow will reduce visibilities at times. Read More >
 Email the author
Introduction
This post storm analysis will cover the March 22nd to 23rd 2019 heavy wet snow storm, which caused power outages and tree damage across the North Country. There were several aspects of the storm that were especially noteworthy and will be examined closely in this analysis. The first of which is a band of heavy snow that formed over central and northeastern Vermont during the daytime on Friday March 22nd, resulting in localized snowfall rates up to 3" per hour. The second aspect of the storm that will be analyzed is the northwesterly upslope snow that brought over a foot of snow to portions of the western Green Mountains and northwestern Adirondacks. The goal of this analysis will be to investigate the synoptic and mesoscale environment that produced this highly impactful winter storm, in an attempt to develop lessons learned, for enhancing our future forecasts and services to our partners and citizens of the North Country.
Overview
On the morning of the 22 March 2019 snow began over Vermont shortly before sunrise, quickly organizing into a mesoscale band of heavy snowfall over portions of northeastern and central Vermont (phase 1 of the storm). By noon, spotter reports in eastern Addison County, Washington County, northern Orange County, and Caledonia County indicated snowfall rates between 1 and 3 inches per hour (Figure 1), which continued through 3 PM. Numerous spotters commented on the large size of the flakes, and the heavy, wet, and sticky nature of the snow, which made travel and snow removal difficult. By 5 PM on the 22nd, reports indicated the band had weakened, snowflakes had decreased in size and the snow intensities had become light. At this point, the well defined, vertically stacked low pressure tracked northeastward to the Maine Coast, placing the BTV forecast area no longer in a favorable zone for banded snow. However, a typical northwesterly flow regime developed under moderate low level cold air advection to produce additional significant snowfall (phase 2 of the storm). It was at this point that the heaviest snow accumulations shifted to the western slopes of the Green Mountains in Vermont and the northwestern slopes of the Adirondack mountains in New York.
The highest snowfall rates on the night of the 22nd were observed over the western slopes of the Green Mountains, where snowfall rates of generally 0.5 to 1 inch per hour were reported through the night. As the low pulled further away to the northeast on the morning of the 23rd, snowfall tapered off and ended by the afternoon.
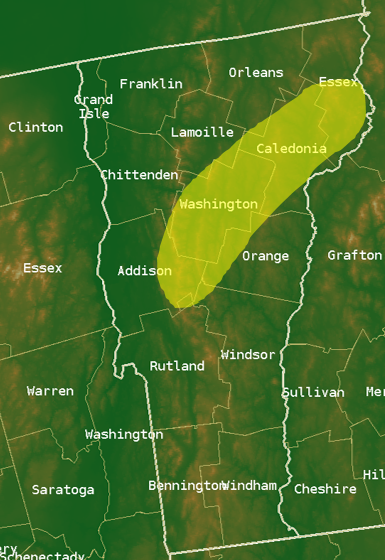
Figure 1. Topographic map (image) with counties and county names. Approximate location of the snow band from 22nd March 2019 shaded in yellow.[click to enlarge]
Figure 2 shows the storm total snowfall ending on March 23rd. Highest amounts, 20-26", were reported in the Northeast Kingdom, most of which fell within the mesoscale band that set up over the area in the morning/early afternoon of the 22nd. Meanwhile, 6-19" fell over the western slopes of the Green Mountains and the northern Adirondacks. Most of this snow fell during the second phase of the storm Friday night into Saturday morning once northwesterly flow had become established.
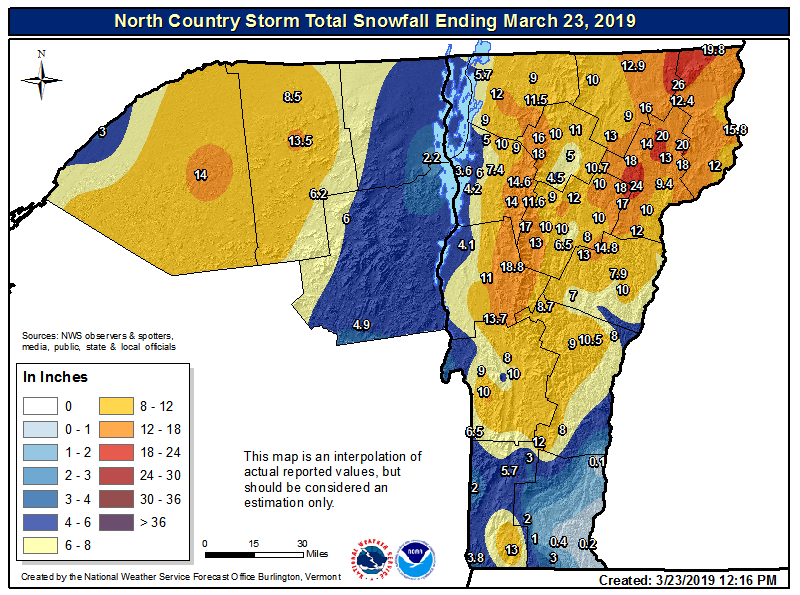
Figure 2. Storm total snowfall across Vermont and northern New York from 22nd – 23rd March 2019.[click to enlarge]
Synoptic Setting
300 hPa Analysis
A look at the 300 hPa analysis (Fig. 3) shows a dual jet structure that played a critical role in establishing strong upper level divergence over New England. Vermont sits in the right rear quadrant of a 100-125 knot jet over eastern Canada and the left front quadrant of a 125 to 150 knot jet over the western Atlantic, putting our forecast area in a region of maximized upper-level divergence (leading to surface convergence). In addition to providing divergence aloft, the upper jets were coupled to the lower atmospheric circulations, playing a key role in the cyclogenesis of the coastal low. The resultant vertical ageostrophic circulations induced by the upper jets supported strong southerly low and mid-level flow off the coast of the Mid-Atlantic and Northeastern United States, which further enhanced a zone of baroclinicity over the East Coast and set the stage for the rapid strengthening of a coastal low in the lower to mid-levels.
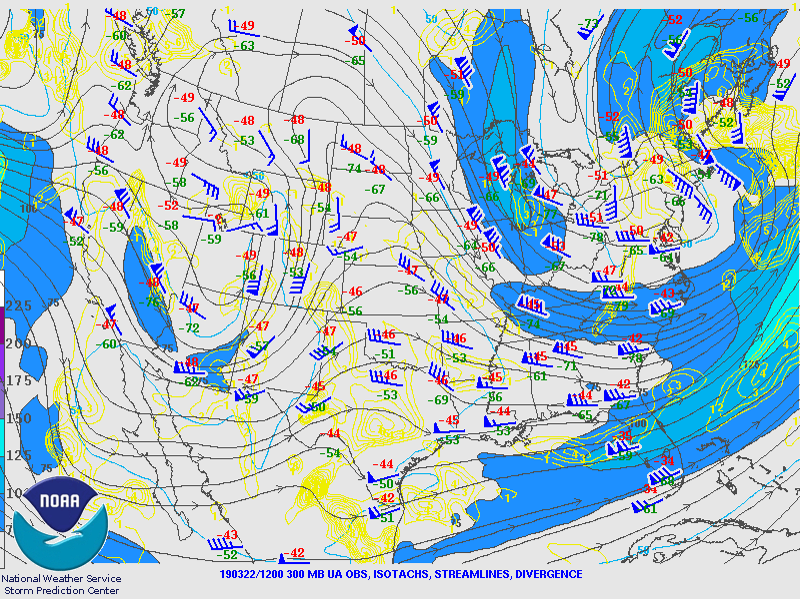
Figure 3. The 1200 UTC (8 AM Local) 22 March 2019: 300 hPa analysis, showing isotachs contoured and blue shaded >=75 kts, and divergence contoured in yellow. [click to enlarge]
500 hPa Analysis
The 500 hPa analysis (Figure 4) reveals two key features of note; a sharp trough with embedded shortwave energy (not shown) diving southward over the eastern Great Lakes Region. Meanwhile, a southern stream shortwave tracked north from the Carolinas and became a closed upper low near New York City, as the two pieces of energy phased together. The 500 hPa height falls were maximized over New York and much of New England ahead of these two features.
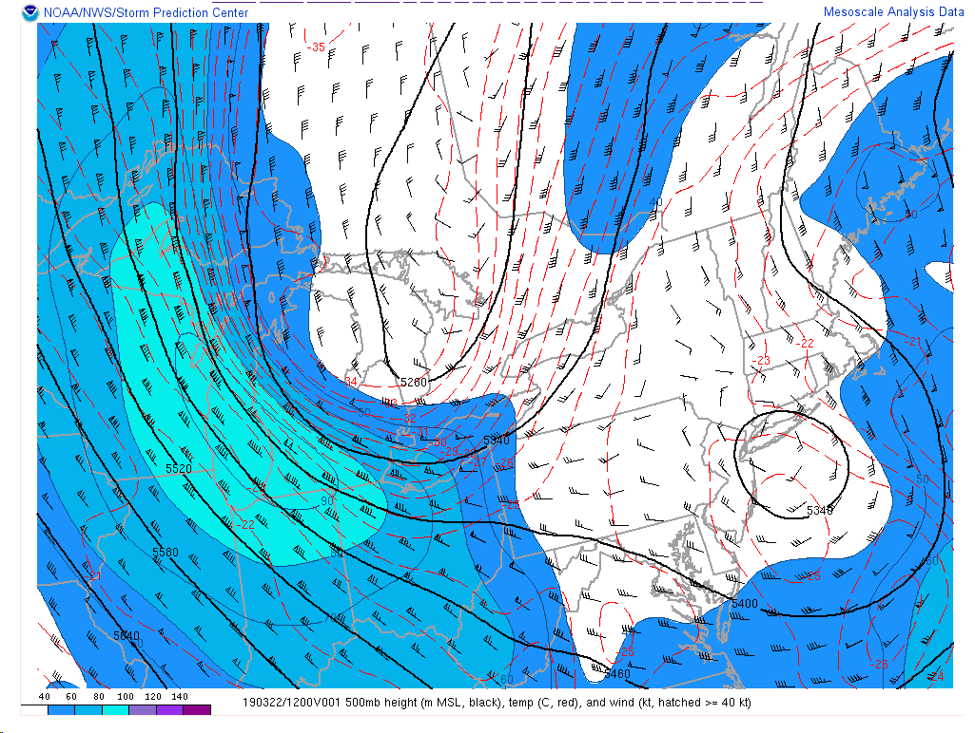
Figure 4. The 1200 UTC (8 AM Local) 22 March 2019: 500 mb height (m MSL, black) temperatures (C, red), and wind (kt, shaded >=40 kt). From the RAP-based NCEP/SPC Mesoanalysis.[click to enlarge]
700 hPa Analysis
With the coastal low closed off at 700 hPa over New England by 00Z (0800 PM local) on the 22nd (Fig. 5a), the stage was set for easterly/southeasterly moisture advection into New England through the night. By 12Z (0800 AM local) on the 22nd (Fig. 5b), the closed low had moved to near New York City, allowing for continued mid-level moisture advection through the morning hours. By 00Z on the 23rd (Fig. 5c), the closed 700 hPa low was now located over the Maine Coast, which marked the transition to the second phase of the storm, characterized by northwesterly upslope flow. The location of the mid-level closed low Friday evening pulled in continental polar air from western Quebec over most of northern New York, but kept relatively warmer and moist maritime air over Vermont through the first portion of the night. This contributed to the prolonged low snow ratios Friday evening into the first part of Saturday morning, which resulted in power outages throughout the night in Vermont. The very favorable track of the deepening 700 hPa trackThe placed the North Country in a region of maximum moisture and thermal advection, resulting in significant snowfall.
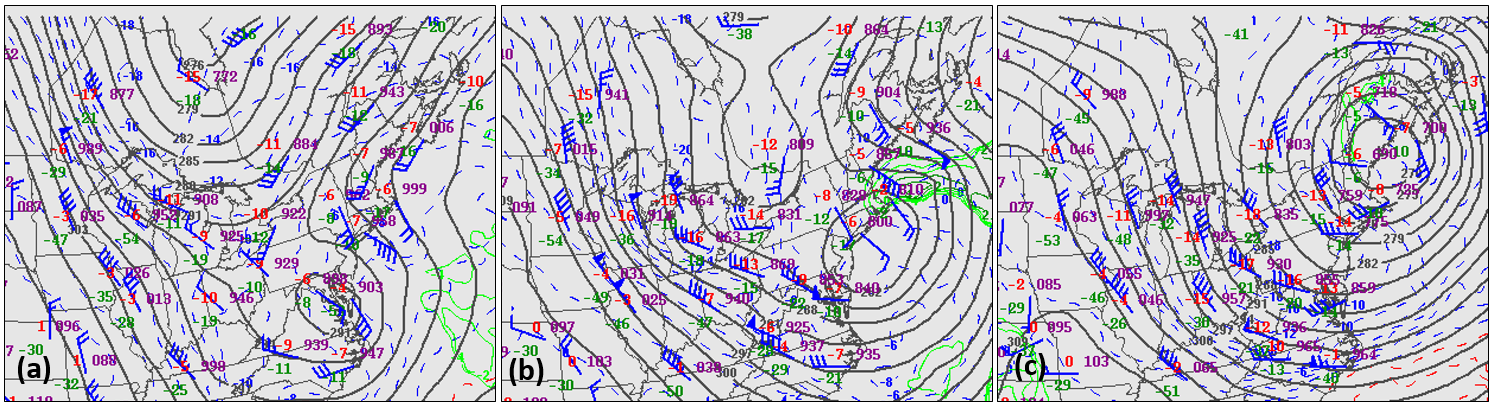
Figure 5a-c. 700 hPa upper air observations, heights (black), and temps (blue dashed line), and dewpoints (Td>=-4 contoured in light green) for (a) 0000Z 22 March 2019, (b) 1200Z 22 March 2019, and (c) 0000Z 23 March 2019. [click to enlarge]
Examination of 700 hPa equivalent potential temperature (Figure 6) along with cross sections of equivalent potential temperature (Figure 7) show evidence of the western fringes of a mid-level TROWAL (TROugh of Warm air ALoft) just reaching eastern Vermont. The TROWAL, which is characterized by the advection of higher theta-e value air, is a source of both moisture advection and synoptic scale ascent in the mid-levels. Maximum lift associated with the TROWAL airstream was certainly further east, just off the coast of Maine. However, at least a minor contribution from the TROWAL to mid-level ascent was observed across eastern Vermont, which helped to enhance snowfall rates on 22 March 2019.
Surface Analysis
The surface analyses from 22 March 2019 at 00Z through 1800Z on 22 March 2019 (Figure 8) shows coastal cyclogenesis occurring off the Mid-Atlantic/New England Coast. Initially, a weak low pressure system tracked north-northeastward from the Carolinas to the Delmarva Coast. By 00Z on the 22nd, the low had strengthened to 993 hPa off the Mid-Atlantic Coast as it encountered increased baroclinicity (sharp thermal gradient) and low-level convergence under favorable dual jet structure. By 12Z on the 22nd, the low pressure system had rapidly intensified to 979 hPa as it moved to the Gulf of Maine. The low pressure system continued to deepen Friday afternoon and reached its maximum intensity of 976 hPa between 18Z on the 22nd and 00Z on the 23rd. The rapid deepening of the low pressure system produced breezy northwest winds over the North Country Friday night through Saturday morning, which helped to enhance upslope snowfall and low-level cold air advection for phase two of this significant winter storm.
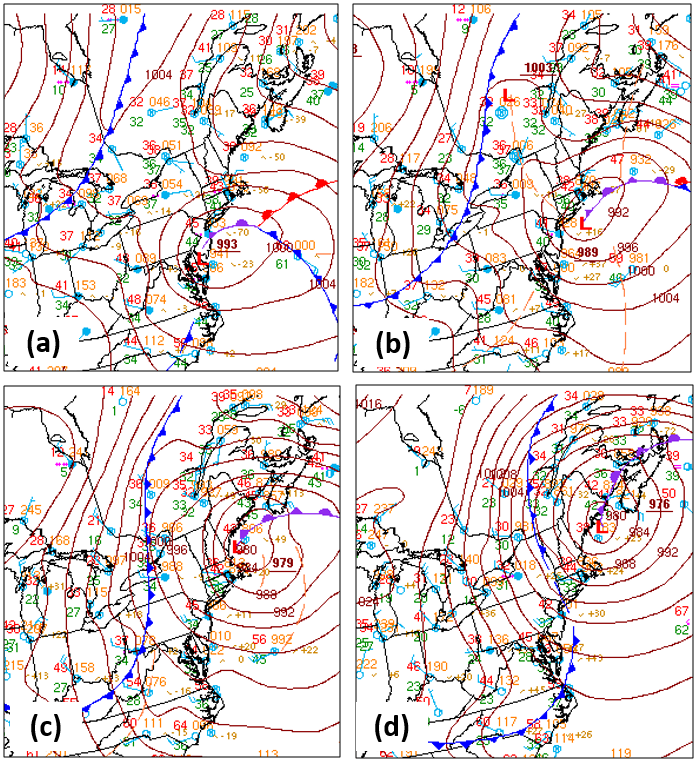
Figure 8a-d. WPC surface analyses leading up to and during the event, showing the strengthening coastal low, valid (a) 0000Z 22 March 2019, (b) 0600Z 22 March 2019, (c) 1200Z 22 March 2019, and (d) 1800Z 22 March 2019.[click to enlarge]
Mesoscale
*Note: This section does get quite technical in an effort to further examine the storm using some different forecasting techniques that may be applied to similar events in the future, but if the reader only desires a broader overview of the storm, they may skip directly to the "Conclusions/Takeaways" section below.
There were several mesoscale factors that worked in tandem with the larger synoptic setup to bring a band of heavy, wet snow to portions of Washington, Caledonia, and Essex Counties in Vermont. We will examine these factors in this section as well as look at some of the impacts caused by this storm.
Frontogenesis
Although earlier guidance placed a band of 700 hPa frontogenesis further southeast over New Hampshire, by 12Z on the 22nd several forecast models had shifted the band to the northwest into the Northeast Kingdom of Vermont. The 12Z run of the GFS 20 (Fig. 9a) shows a band of 700 hPa frontogenesis setting up by 15Z across portions of the Northeast Kingdom of Vermont, which correlated well with radar trends and spotter reports of heavy snowfall. Additionally, examination of saturated geostrophic potential vorticity (EPV) (Fig. 9b) in the 600 to 700 hPa layer (the layer just above the area of enhanced frontogenesis) shows values between 0 and 0.25 PVU. This tells us that the atmosphere was weakly stable in the 600 to 700 hPa layer (EPV <0 would be indicative of an unstable atmosphere, EPV >1 is a very stable atmosphere). This weak stability above the thermally direct ageostrophic frontogenetic circulation allowed for the mesoscale snow band to narrow and intensify, resulting in 1 to 3 inch per hour snowfall rates.
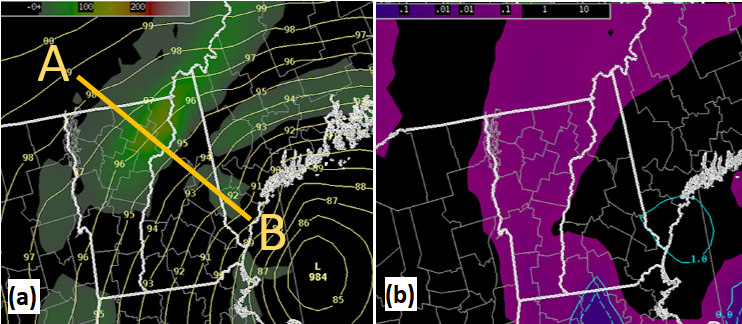
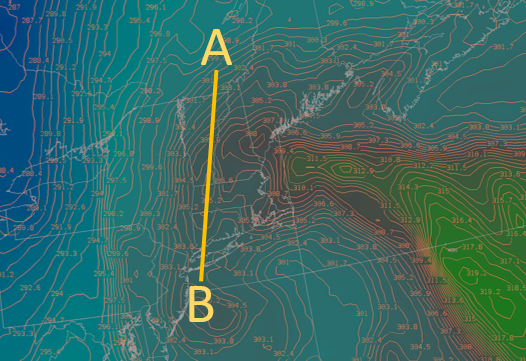
Figure 9a-b. GFS20 3 hour forecast for 15Z on 22 March 2019 : (a) MSLP (hPa, light yellow), 700 hPa frontogenesis (K/m/1e10s, shaded >=0 K/m/1e10s), valid 1500 UTC 22 March 2019. Location of cross section in Figure 10 shown in bright yellow. (b) 700 - 600 hPa saturated geostrophic equivalent potential vorticity (PVU, shaded <= 0.25 PVU), valid 1500 UTC 22 March 2019. [click to enlarge]
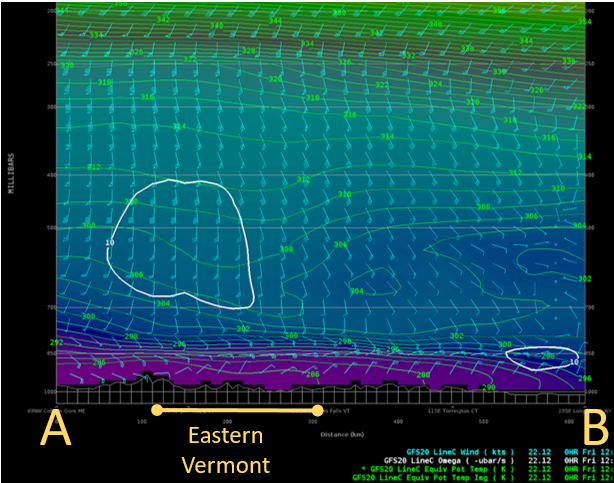
Figure 10 shows a cross section extending from near Montreal, Quebec (Point A on Fig. 9a) to just south of Portland, Maine (Point B on Fig. 9b). A zone of enhanced mid-level frontogenesis (shaded green color) can be seen centered over the Northeast Kingdom of Vermont, with resultant upward motion indicated by the positive omega (-ubar/s) above the zone of frontogenesis. Within the area of upward motion above the frontogenetic circulation, saturated geostrophic equivalent potential vorticity (values between 0 and 0.25 are shaded in pink on the cross section) indicate a weakly stable atmosphere. According to numerous studies (i.e. Nicosia and Grum, 1998, Jurewicz and Evans 2004, Evans and Jurewicz 2008), this setup where the frontogenetical lift extends upward into an unstable or weakly stable zone is very conducive to the development of narrow, intense bands of snowfall. In order to help visualize the ageostrophic circulation induced by the frontogenesis maximum, the ageostropic vertical circulation has been overlaid in light blue.
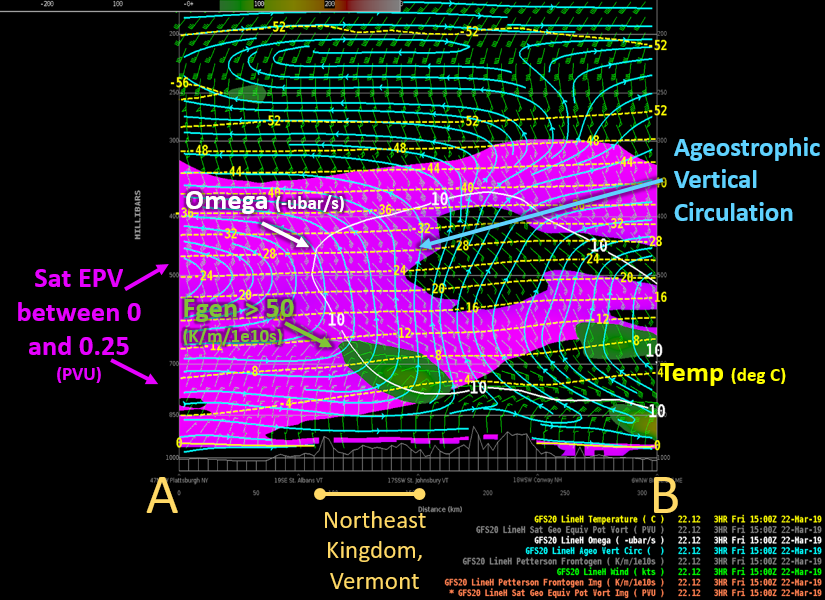
Figure 10. GFS20 3 hour forecast for 15Z on 22 March 2019: Cross section showing saturated geostrophic equivalent potential vorticity (PVU, shaded in pink between 0 and 0.25 PVU), frontogenesis (K/m/1e10s, shaded in green), omega (-ubar/s, white), temperature (deg C, yellow), and ageostropic vertical circulation (light blue).[click to enlarge]
It has been shown that frontogenesis by nature leads to a reduction in saturated geostrophic EPV (i.e. Nicosia and Grum, 1998, Evans and Jurewicz 2008), so one potential caveat in examining forecast cross sections for a favorable banded snow setup as described above is the potential for a high number of false alarms. As forecasters, it is often difficult to discern which frontogenetic bands will produce heavy snow bands and which will not. Evans and Jurweicz (2008) concluded that in order to differentiate the potentially heavy snow band events from the weaker ones, we must not only look for the ingredients for banded snowfall but also look at the depth and persistence of the favorable setup.
Examination of cross sections from 12Z Friday through 00Z Saturday does indeed show deep mid/upper-level ascent between 12Z and 15Z Friday, with the strongest frontogenesis around 15Z. This was the time frame of the strongest mesoscale frontogenetic forcing and 500 hPa height falls, along with the best upper-level divergence. By 18Z, the zone of favorable upper-level divergence and 500 hPa height falls had shifted north and east of the area. The weakening of the deep synoptic-scale ascent coupled with the loss of the mid-level frontogenetic circulation allowed the snow band to weaken.
Crosshair Method
Another useful tool for examining the potential for heavy snow which worked well in this event is the "crosshair method". This method utilizes time-height cross-sections such as those available in BUFKIT to identify areas where strong ascent is located within a saturated Dendritic Growth Zone (DGZ). Figure 11 shows the March 22nd 12z GFS time height vertical cross section for Saint Johnsbury, Vermont. Negative omega (ascent) contoured in red, positive omega (descent) contoured blue, and the saturated dendritic growth zone outlined in yellow/pink color. Time increased from 12Z (8 AM EDT) on the 22nd of March (right side of image) to 18Z (2 PM EDT) on the 22nd of March (progressing to the left). The brown vertical bar marks 11AM on the 22nd of March, which is the timing of the skew-T shown in Figure 12. Utilization of the crosshair method on this time-height cross section reveals ascent within the DGZ between 8 AM and 2 PM, maximized around noon when the heaviest snowfall was reported. It is important when using the crosshair method to examine for the potential for heavy snow that deep layer moisture is present within the DGZ and within the area of enhanced lift in order to maximize snowfall. Examination of humidity profiles for the event do indeed confirm a deeply saturated atmosphere throughout the day on the 22nd of March 2019. The cross section also shows a region of descent within the DGZ starting at 2PM, which approximately lines up with reports of when the snowfall trended lighter.
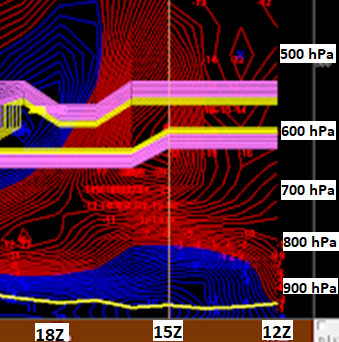
Figure 11. GFS20: Time-height cross section for St. Johnsbury, VT showing omega (ubar/s, >0 (ascent) contoured in red, <0 (descent) contoured in blue, saturated dendritic growth zone outlined in yellow, valid from 12Z to 18Z on 22 March, 2019[click to enlarge]
Thermodynamic Profiles and Microphysics
Numerous spotters and members of the public relayed to the National Weather Service that the snowfall within the band over central and northeastern Vermont was "heavy", "wet", and "sticky". Investigating the forecast sounding confirmed a favorable thermodynamic profile for very wet, high density snow. Figure 11 (next page) is a forecast sounding from Saint Johnsbury, in Caledonia County Vermont, valid at 1500 UTC (11 AM local time), which shows deep saturation within and below the DGZ. As dendrites and plates formed within the DGZ, the flakes had to then travel through a deep layer of supercooled liquid water before reaching the surface. This leads to riming, which resulted in the heavy, "massive snowflakes" that were reported within the snowband.
Snow ratios were particularly problematic during this event not only in central and eastern Vermont during the initial phase of the storm (mesoscale banding), but also in the Champlain Valley during the second phase of the storm (the northwesterly upslope phase). Figure 13 shows the progression of state-wide power outages in Vermont on the 22nd and 23rd of March. The two phases of the storm can be seen - the initial spike in outages midday Friday was mainly attributed to the heavy rimed wet snow within the snow band over central and northeastern Vermont. After the snow band dissipated, there was a decrease in power outages through the remainder of the day. While the heavy, wet nature of the snow during the daytime on the 22nd was forecast and messaged fairly well ahead of time, the continuation of the low snow ratios into the second phase of the storm, the northwesterly flow phase, was not anticipated.
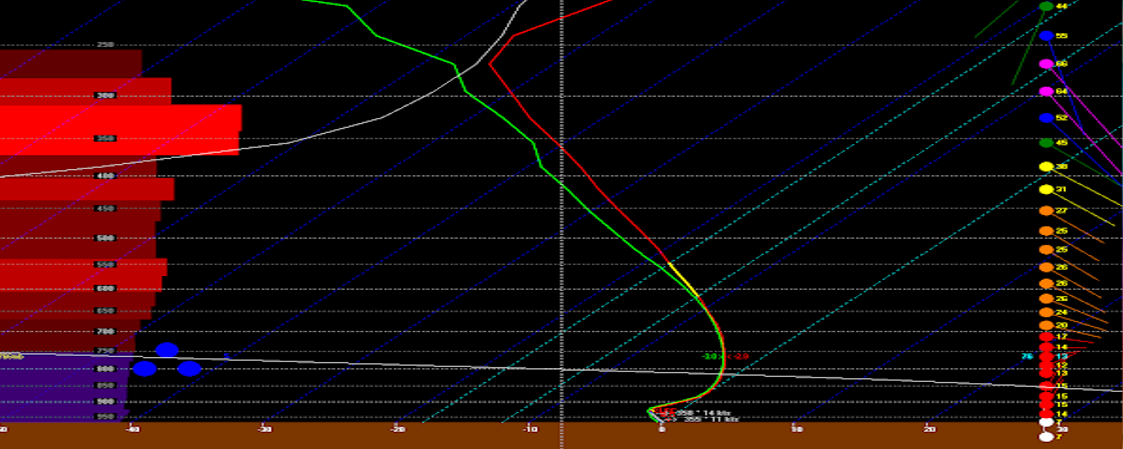
Figure 12. GFS20: Forecast sounding for Saint Johnsbury, VT, valid 1500 UTC ( 11 AM Local) 22 March 2019.[click to enlarge]
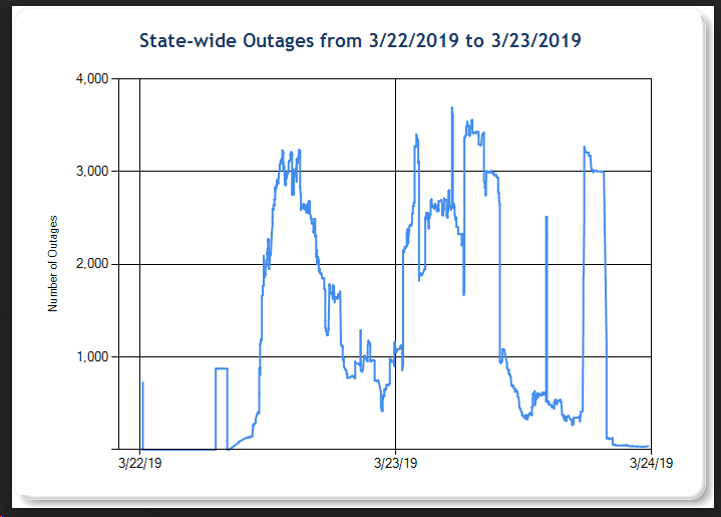
Figure 13. Vermont state-wide power outages from 22-23 March, 2019.[click to enlarge]
National Weather Service forecasters expected snow ratios to increase Friday evening, leading to drier, "fluffier" snow overnight. This scenario is typical of northwesterly flow events, where the air mass is of continental origins and thus drier and colder. However, in the early overnight hours of the 23rd, warmer, maritime air continued to wrap around the deep closed low and into Vermont, and moderate to occasionally heavy wet snow continued into the first part of the night. The persistence of the warm air advection in the mid and upper-levels wrapping around the closed low and into Vermont allowed for deep moisture/ascent to continue through the night, with ascent enhanced further in the low-levels by developing northwesterly upslope flow. Figure 14 shows the 925 hPa temperatures (deg C) contoured in green and shaded, along with the 925 hPa wind barbs in white. The strong temperature gradient between the continental air mass being pulled southward from western Quebec into New York State and the relatively warmer maritime air wrapping around the coastal low over eastern Quebec and Vermont is evident in the figure. One of the primary forecast challenges through the night was anticipating when the boundary would shift east through Vermont, allowing snow ratios to finally increase and the subsequent power outage threat to decrease. This scenario occurred by Saturday morning (6 to 12 hours later than originally anticipated), as the surface low had pulled far enough away, allowing for a continental air mass to advect across the North Country . By this point, the western slopes of the Greens had already experienced a prolonged period of heavy wet snow that resulted in downed trees and powerlines. Green Mountain Power relayed the image in Figure 15 to our office, which was taken in the early overnight hours on March 23rd near Bristol, Vermont. The image shows just how much the heavy, wet snow weighed down branches. With the transition of the heavy wet snow to drier fluffier snow, the number of power outages in Vermont decreased through the remainder of the morning. It is hypothesized that the final spike in power outages Saturday afternoon was caused by gusty northwest winds during peak heating.
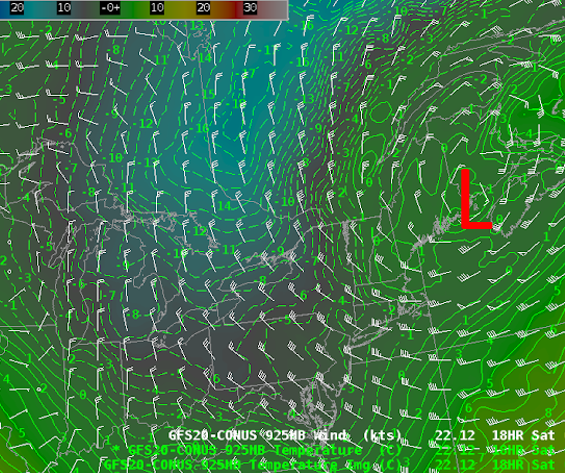
Figure 14. GFS20: 925 hPa temperature (degrees Celsius, green contours, shaded), 925 hPa wind barbs (knots, white), valid at 06Z (2 AM Local) on 23 March 2019.[click to enlarge]
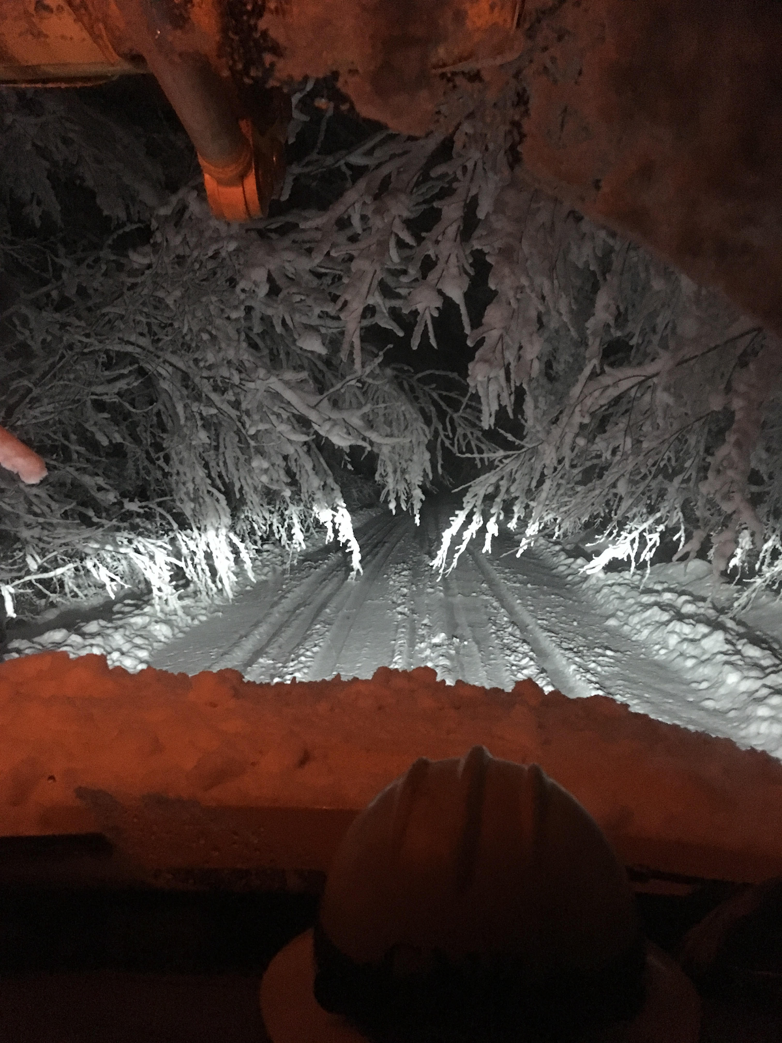
Figure 15. Sagging tree branches coated with heavy wet snow near Bristol, VT. Taken in the early morning hours of 23 March, 2019. Courtesy of Green Mountain Power[click to enlarge]
Conclusion/Takeaways
When examining the potential for heavy frontogenetically induced snow bands, it is important to look for when the mesoscale frontogenetic ingredients are collated with deep synoptic ascent and favorable moisture parameters. This event was an example of a mesoscale snow band that occurred within a very favorable synoptic setup. It is important that forecasters look for targets of opportunity in events like these where the synoptic environment is favorable for deep ascent. Although it is often difficult for models to pinpoint exact locations and timing of mid-level frontogenesis far in advance, forecasters can use pattern recognition and conceptual models to recognize when an environment is conducive for the development of heavy bands of snowfall. When synoptic and mesoscale ingredients combine to produce favorable conditions for narrow, intense bands of heavy snowfall, forecasters need to utilize pattern recognition and real-time observations to enhance messaging details, such as snowfall rate, band location/movement, and expected snowfall amounts. These mesoscale snow bands can produce remarkable snowfall amounts in a short period of time, while having significant impacts on travel, aviation, and the power grid if snowfall is wet and heavy.
In conclusion, this was a powerful winter storm that produced a widespread heavy wet snowfall across the North Country, with power outages and travel delays. The event also provided a number of forecast challenges for forecasters. It is important that we learn from events like these in an effort to identify opportunities to better forecasts and messaging in the future.
References
Evans, M., and M. L. Jurewicz Sr., 2009: Correlations between analyses and forecasts of banded heavy snow ingredients and observed snowfall. Wea. Forecasting, 24, 337–350.
Jurewicz, M. L., Sr., and M. S. Evans, 2004: A comparison of two banded, heavy snowstorms with very different synoptic settings. Wea. Forecasting, 19, 1011–1028.
Nicosia, D. J., and R. H. Grumm, 1999: Mesoscale band formation in three major northeastern United States snowstorms. Wea. Forecasting, 14, 346–368.

