 Email the author
Introduction
Tornadoes are uncommon across our forecast area. On average, one occurs every other year in our forecast area. We tend to lack the instability necessary for strong, persistent updrafts. Variable terrain also makes it difficult for these violent circulations to develop. Aside from environmental inhibitors, high terrain also blocks our radar signal, making it difficult to assess near surface rotation. Lower population density across our region also means they are less likely to be observed if they do occur. As a result, our forecast area had not issued a tornado warning since 2014. So for the remainder of this article, we look at some reasons why the first tornado warning in 6 years was issued August 2nd, 2020 (Figure 1).
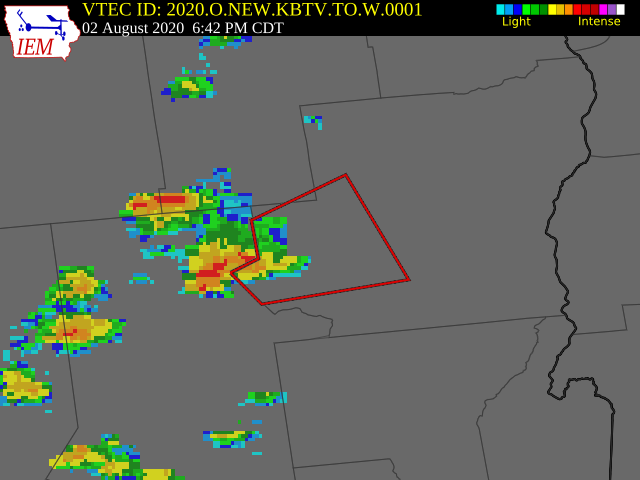
Figure 1. Polygon for the tornado warning in southwestern Essex County, New York at 2342 UTC 2 August 2020.[click to enlarge]
Storm Environment
Before we think about issuing warnings, we carefully consider whether atmospheric conditions are favorable for thunderstorms. From there, we ask whether we think storms will organize and develop strong convective patterns or will remain disorganized and cycle up and down. High resolution models can help us envision how storms develop and evolve through the course of the day, and we can use their output to consolidate different measurements for whether the atmosphere can support events like tornadoes. Use of simple tools like checklists help us to keep track of this information and leverage model data to characterize potential threats. We use this checklist internally to help guide our forecasting and messaging. Below is a "behind the curtain" look at what we saw after running it August 2nd (Figure 2). It is not so much to tell us what will happen, but what could happen, and we can click each section of pros and cons for potential threats.
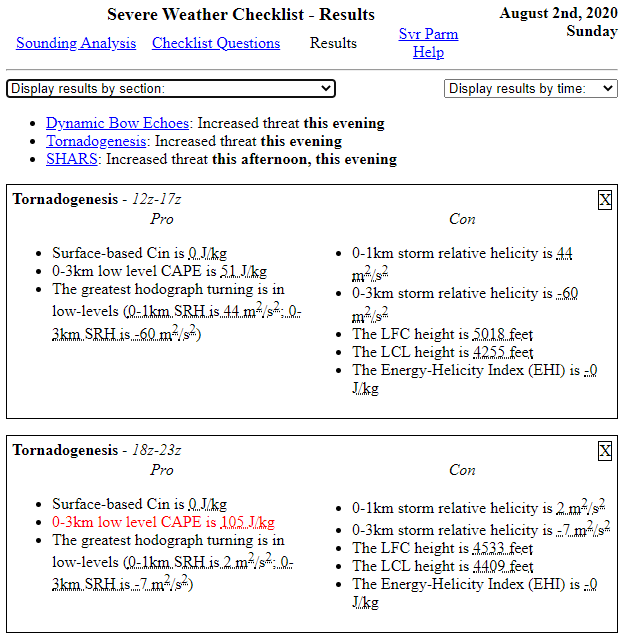
Figure 2. Sample of NWS Burlington’s Severe Weather Checklist run on 2020 August 2. A snippet of the pros and cons table is using data from forecast soundings and based on questions answered (i.e. "Is the region in the favorable front right or left exit region of an upper jet?")[click to enlarge]
Occasionally, we post model depictions of showers and storms through a gif on social media. Often, we include a reminder that the model is not showing what will happen, but show how precipitation is expected to evolve. One forecast model is not going to tell the whole story because our atmosphere is like a fluid system, but we cannot perfectly measure it all the time. We launch balloons equipped with instruments that help, but they measure the atmosphere at one point and time and are carried downwind from a point. They can’t perfectly encapsulate the atmosphere, and so every forecast model will err. Ensemble forecast systems help to make up for these challenges by making adjustments for errors/biases or differences in how we fill in gaps of data. This has many useful applications, like detecting probabilities for the development of a favorable tornado environment across several model runs as opposed to relying on a single model depiction. The High Resolution Ensemble Forecast (HREF) system is one that we use often for severe weather forecasting. On August 2nd, 2020, looking at updraft helicity, which tells us the likelihood of rotating updrafts (favorable for tornadoes), we saw values between 10 and 40 percent across much of Northern New York (Figure 3).
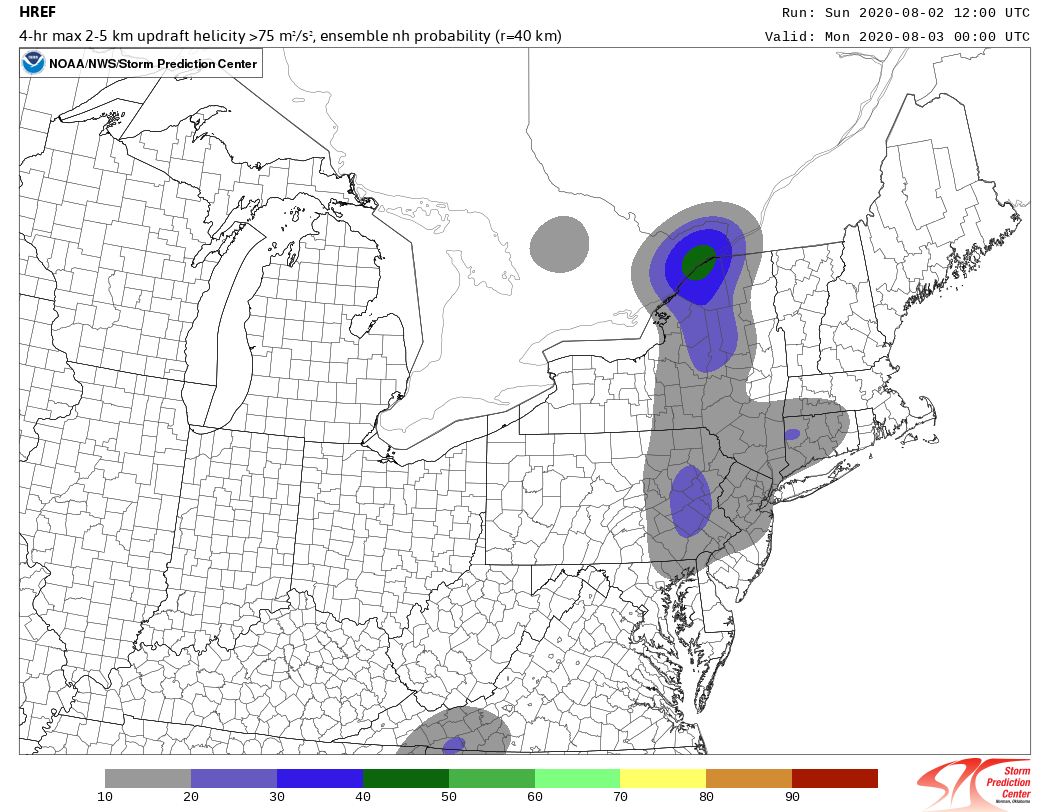
Figure 3. HREF neighborhood probability of 2-5 km updraft helicity at 00Z 3 August 2020, which was about the time the supercell developed in northern Hamilton County, NY.[click to enlarge]
Storm Time
As the day unfolds, we watch for the forecast to come together. We closely monitor observations to see whether our forecast is verifying or to detect important changes. Low-level boundaries are important to watch. One of the three ingredients for convection is convergence of winds. This can occur with frontal boundaries or with troughs that develop ahead of them. During the summer months, we frequently see prefrontal troughs develop due to terrain features across the Champlain Valley. Here is a look at surface analysis at 8 PM on August 2nd, around the time the supercell developed (Figure 4). We also keep an eye on other parameters, like the supercell composite parameter, which is a combination of information related to shear and instability. Keeping track of changes is important, because based on the supercell composite, the most favorable conditions for supercells developed a bit further east than the HREF forecast we showed earlier.
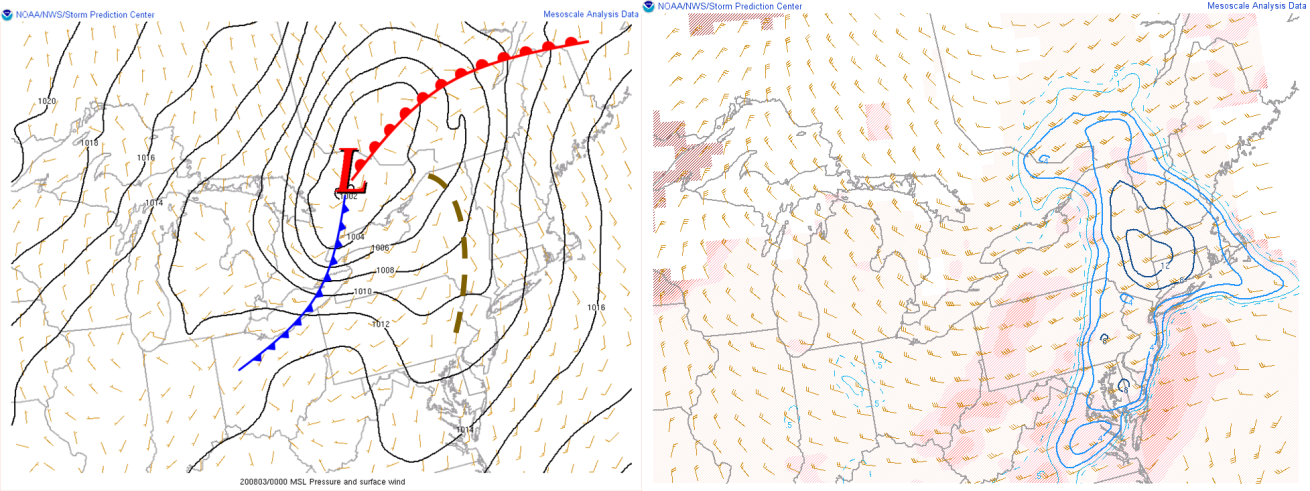
Figure 4. Left) Surface analysis at 00Z 3 August 2020. Right) Supercell Composite Parameter at 00Z 3 August 2020. Darker and increasingly solid contours indicate favorable parameters.[click to enlarge]
It took some time for convection to develop. Mid-level dry air limited convection throughout most of the day (ALY Sounding for 00Z August 3rd not shown). But around 8 PM, a supercell developed over northern Hamilton County, New York and tracked into southwestern Essex County just north of Newcomb. In making the decision, we look for radar indicated rotation, or velocity couplets. Ideally they are persistent and don’t fade in and out. We also want to see a hook echo with a weak echo region (WER) and turbulent motion noted in Spectrum Widths (SW). The issue in this area is that Mount Van Hoevenberg partially blocks the radar beam and Newcomb is several miles away from the radar. As a result, the radar beam intercepts the storm 4000 feet above ground level at the lowest. A tornado occurs on the ground, though, which is why we want to look out for lofted debris (and rely heavily on storm spotters). Nevertheless, strong rotational velocity up to 45 knots is suitably strong at such a distance from the radar (Figure 5). The signals were not perfect, but based on our understanding of the environmental conditions and forecasts, the first tornado warning in 6 years was let loose.
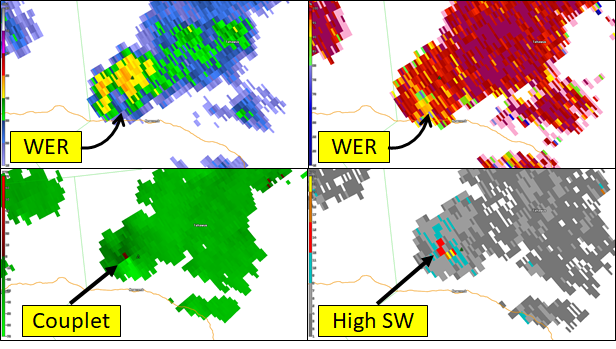
Figure 5. Top Left) Base reflectivity at 0004Z 3 August 2020. The weak echo region is a common characteristic of a super cell. Top Right) Correlation Coefficient for the same time. Bottom Left) Base Velocity at 0008Z 3 August UTC with radar detected 2 knot outbounds and 90 knot inbounds right next to each other. Together, this makes about 45 knots of rotational velocity. Bottom Right) Spectrum Width. Higher values can show where turbulent flow is occurring.[click to enlarge]
Fortunately, the supercell was strongest over an area with few people. Looking at an updated tornado warning polygon, the population within the warning was only 92 people by 8:45 PM (Figure 6). And the actual area of rotation within is much smaller. This supercell tracked over an area of wilderness. As a result, no tornado was observed, nor any damage reported. In the instance damage is reported, we will go out and perform storm surveys. Although we had wanted to go and see if we could find any damage, incoming Tropical Storm Isaias and health concerns during the covid-19 pandemic kept us from performing the survey. With that, thanks for reading this window into severe weather forecasting. Any time you see severe weather, let us know, because every little bit helps develop our understanding further.
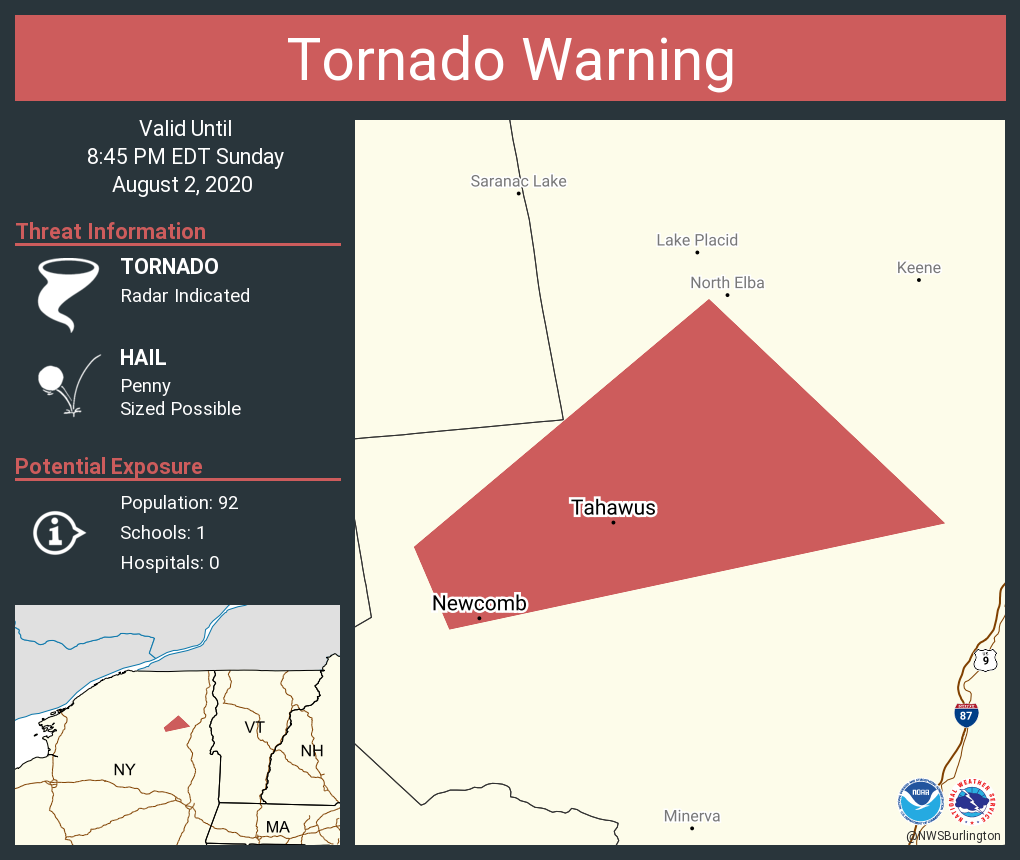
Figure 6. Tornado Warning image generated for Twitter. Information includes the different warning tags, the valid time, and contains information about how many people, schools, or hospitals may be impacted within the warning.[click to enlarge]

