 Email the author
On June 23rd and 24th, a short period of extreme heat developed across Vermont and northern New York as an anomalous upper level high built across the eastern half of the United States. Dry air aloft suppressed thunderstorm activity, especially on June 23rd, which provided an opportunity for very efficient heating while high dewpoints produced heat indices over 110 °F. Temperature values were pushed to the extreme as adiabatic warming due to downslope winds caused Plattsburgh, New York to tie an all-time record high and break the monthly high temperature for June of 101 °F. Burlington, Vermont also observed a temperature reading of 99 °F, which had not been observed since 2001. Subsident warming underneath the ridge was most significant across the Champlain Valley, but significant heat was observed over much of Vermont and northern New York (Figure 1).
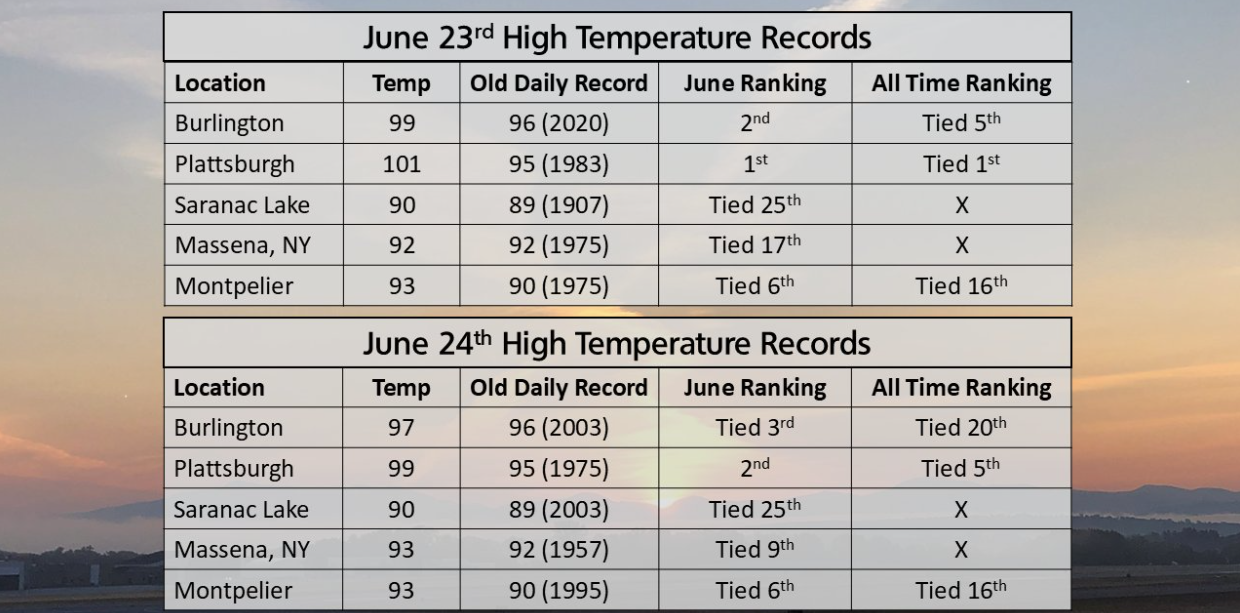
Figure 1: A summary of the record high temperature values observed on June 23rd and 24th, 2025 at our primary climate sites, their ranking for the month of June, and their ranking for the entirety of that site’s period of record.[click to enlarge]
Most of our event reviews consist of analysis of the environmental factors that contributed to significant flood, severe weather, or winter storm events. The impacts from these events are readily apparent, unlike heat. Extreme heat cannot be visualized quite the same as snapped trees, buried cars, or washed-out culverts. This review will highlight the significance of this event through its rarity and give a glimpse on the types of impacts that were observed.
Earlier internal office reviews have composited atmospheric conditions favorable to producing extreme heat and prolonged heat waves. The figures are not all posted to save space, but below is Figure 2 adapted from our office reviews. Relevant weather features such as a strong Bermuda High centered near the island with an upper level high along the US East Coast are the most common features. A zonal jet moving across interior Canada is usually present with low pressure or an upper trough along the right entrance region or left exit region of that jet. This configuration sends continental air from the Rockies eastwards. The high elevation of the Rockies allows this air to remain above the surface in the eastern US. If unmodified, this warm layer caps thunderstorm activity, which allows more solar heating. The location of the Bermuda High transports subtropical air into the region while the surface low pressure over northern Canada enhances southerly flow.
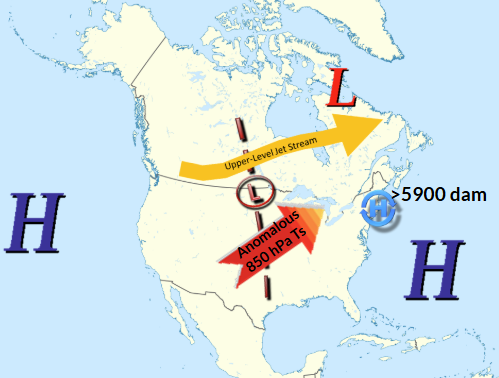
Figure 2: A schematic of the layout of weather features common for heat events in Vermont and northern New York. Blue Hs indicate surface high pressure and the red L indicate surface low pressure. The H with a circle indicating an upper level high and its strength. A favorable upper jet configuration is highlighted in yellow, with the warm 850mb flow indicated through a red arrow. The upper trough axis or upper low is indicated with a dashed line and circled L.[click to enlarge]
This heat outbreak followed that weather pattern. A large upper high built across the eastern US late June 22nd, which gradually broke down after June 24th (Figure 3). Upper air balloons within the upper high reported heights of 5990 m. This was consistent with values exceeding NAEFS model climatology (not shown). Many other elements within the composite can also be seen in the upper air analysis with a trough present across the Intermountain West and channeled flow over James Bay.
Figure 3: The 500 hPa (20,000 feet above ground level) upper air analysis on 24 June 2025 at 8 PM EDT. Displayed are wind barbs (plotted in blue, 1 arrow=50 knots, 1 barb=10 knots, 1/2 barb=5 knots), 500 hPa heights (decameters, black lines), and temperatures (Celsius, dotted red).[click to enlarge]
Subsident air is often present beneath these expansive upper highs, especially if there is a warm, capping inversion over a mixed layer. Downward vertical motions suppress thunderstorm activity and enhance solar heating beneath these “heat domes”. Figure 4 shows the observed atmospheric profile in Albany, New York. At 12z (8AM EDT) on June 23rd, 2025, surface temperatures were already at 77 °F with a dewpoint of 74 °F over Albany. Low clouds were present over Albany, and also across much of Vermont on June 23rd. Just above the cloud layer where the red and green lines quickly separate, temperatures of almost 10 °C quickly warmed to nearly 15 °C just below 700mb.
Figure 4: The observed rawinsonde data at Albany, New York at 12Z on 23 June 2025 plotted on a Skew-T diagram.[click to enlarge]
On June 23rd, skies became clear while heat began to build beneath the upper level high. Temperatures across Vermont and northern New York quickly rose into the 90s by mid-afternoon. Dewpoints rose as high as the upper 70s, locally above 80 °F. Such high dewpoints are rare across Vermont and northern New York. Around 4 PM, these dewpoints remained, resulting in heat indices climbing into the 110s across portions of the eastern Champlain Valley. (Figure 5) In general, the warmest conditions were in the Champlain Valley, with temperatures over the rest of Vermont and northern New York remaining in the lower to mid 90s. Although breaking daily records, values outside the Champlain Valley were not as extreme.
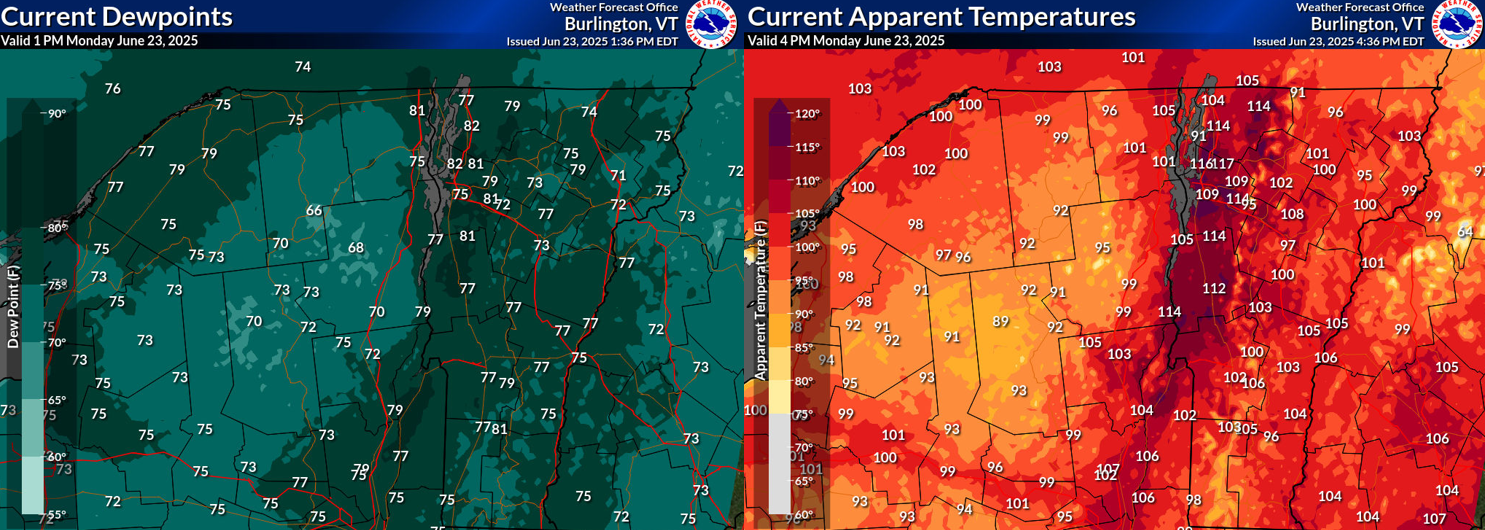
Figure 5: Left) Dewpoints observed across weather stations in Vermont and northern New York at 1 PM. Right) Apparent Temperatures observed across Vermont and northern New York at 4 PM.[click to enlarge]
With very dry mid-level conditions and subsidence aloft, dry air was expected to mix to the surface and moderate high dewpoints. Additionally, there was 35 knot 850mb southwest flow. Downslope winds were expected to enhance dry air subsidence. This first occurred over Plattsburgh, New York where dewpoints in the mid 70s fell to the mid 60s with temperatures quickly warming from the lower 90s into the upper 90s before finally reaching 101 °F to tie the highest temperature reading in Plattsburgh’s period of record. Across the Champlain Valley, the effect of this was not as dramatic, and took until 5 PM before dewpoints finally decreased (Figure 6).
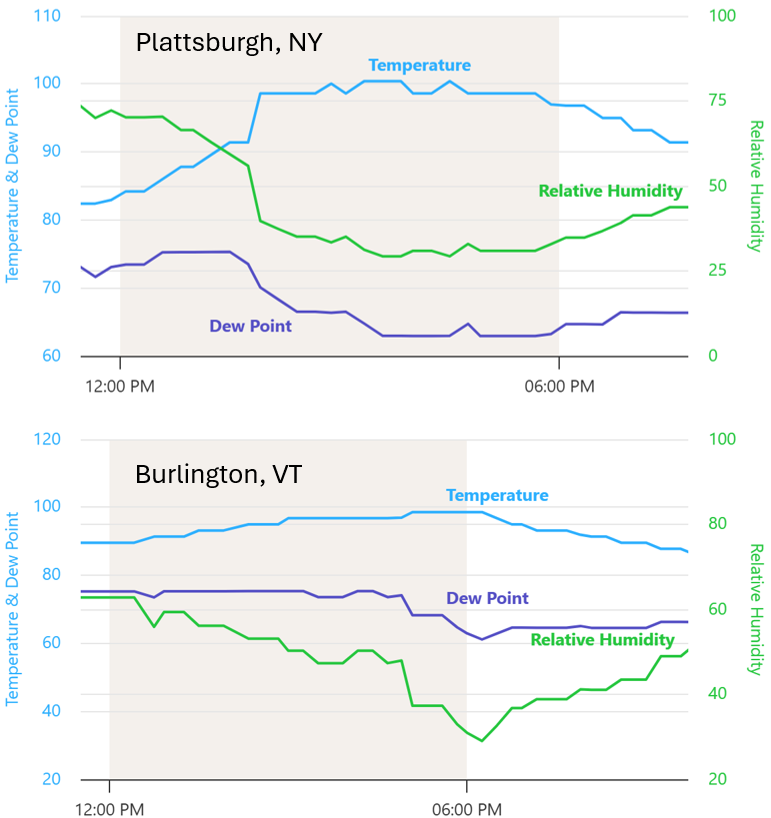
Figure 6: Top) Plattsburgh’s observed temperature (blue), relative humidity (green), and dewpoint (dark blue) from about 11 AM to 9 PM. Bottom) Same as above, but for Burlington, Vermont.[click to enlarge]
High dewpoints in the upper 60s to mid 70s are a significant part of how the heat index is calculated. When temperatures reach the upper 90s with these values, the relative humidity values tend to range between 45 and 55 percent, resulting in heat indices exceeding 105 °F (Table 1). This exceeds our Extreme Heat Warning thresholds, and indicates a point where heat becomes dangerous. Additionally, the combination of regionwide 90s and high dewpoints are rare across the region.
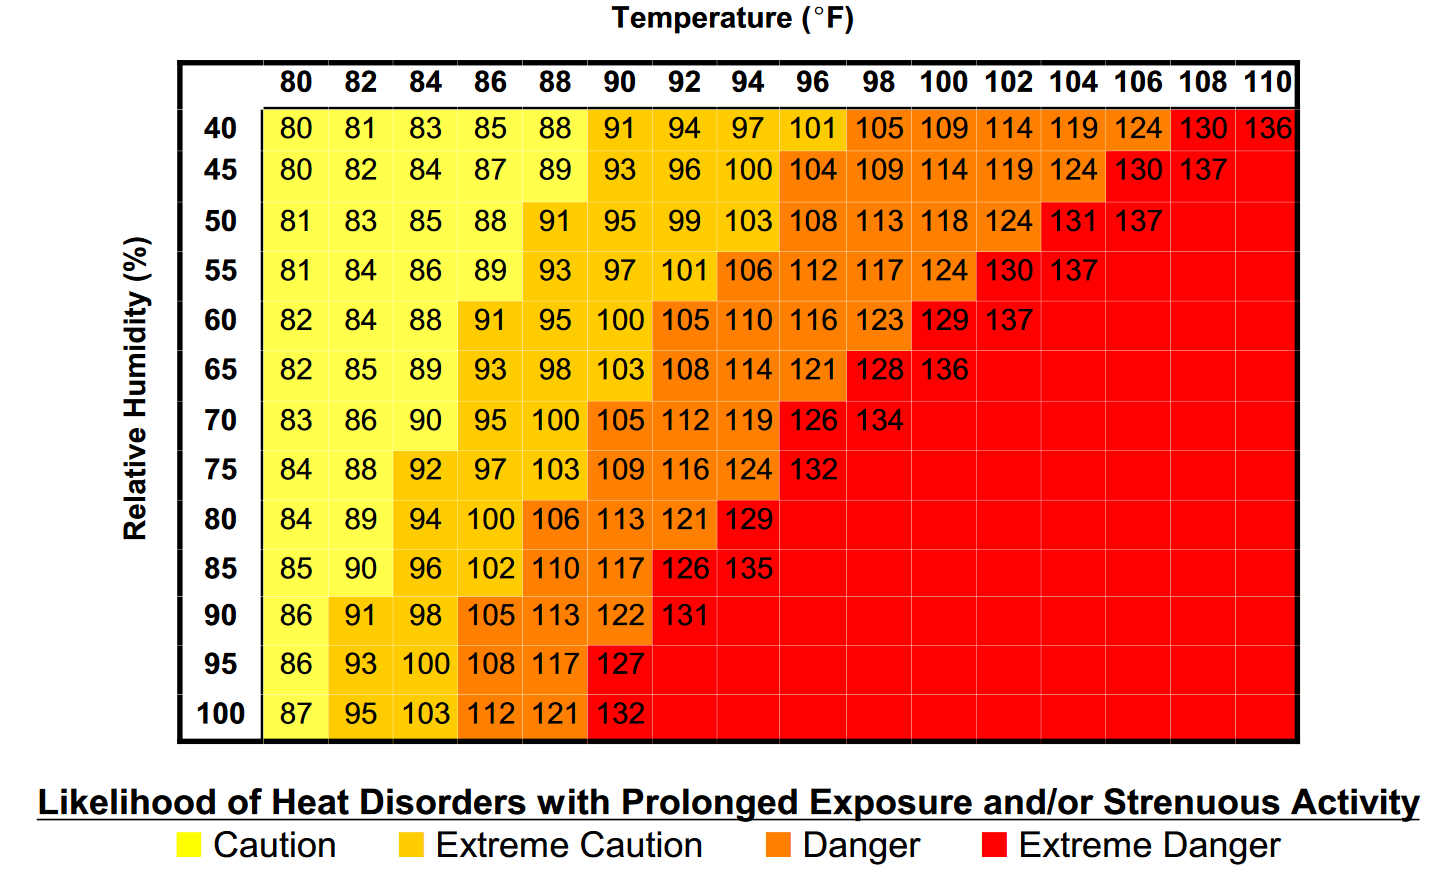
Table 1: NOAA chart of the corresponding heat index based on temperature and relative humidity.[click to enlarge]
It is also important to note that heat index includes other assumptions such as being in shade, and does not describe the impact of prolonged, strenuous activity under the Sun. Over the last several years, an experimental HeatRisk product has been created in coordination between NOAA and the CDC. Last year, it became available over the eastern United States. The baseline for the major heat category is first defined by the median temperature for heat related illnesses from CDC data at a specific place. The remaining categories are defined by CDC’s 25th percentile for orange and 1st percentile for yellow. During the summer months, the red category switches to the 95th percentile for daytime highs at that specific location, and the orange category gradually rises to match the baseline of the red category. When mapped, it provides a description of potential heat-health impact based on the temperature values tied to heat-related illness. The categories are defined in a framework similar to air quality that ramps up from describing the risks for heat that affects sensitive groups and heat that affects everyone (Table 2).
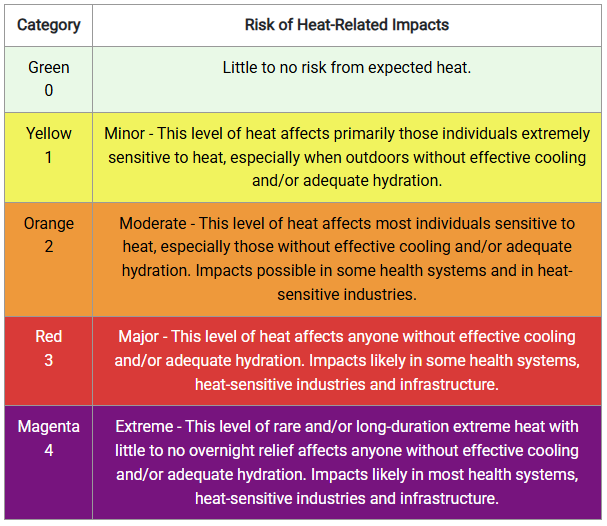
Table 2: NWS HeatRisk chart for each category and associated heat-related impacts.[click to enlarge]
See below the charts for Burlington and Newport, Vermont (Figure 7). You’ll notice the curves for red, orange, and yellow differ based on that location’s temperature climatology and increases in the summer months when people are more acclimated to hotter temperatures. Low temperatures also factor into the calculation. Any day where the low fails to cool and offers little relief contributes to the HeatRisk level. The range between the max and min temperature also contributes to how much low temperatures will weigh the calculation (not shown). It is assumed that smaller diurnal ranges will mean that there was more humidity and less overall relief from the heat.
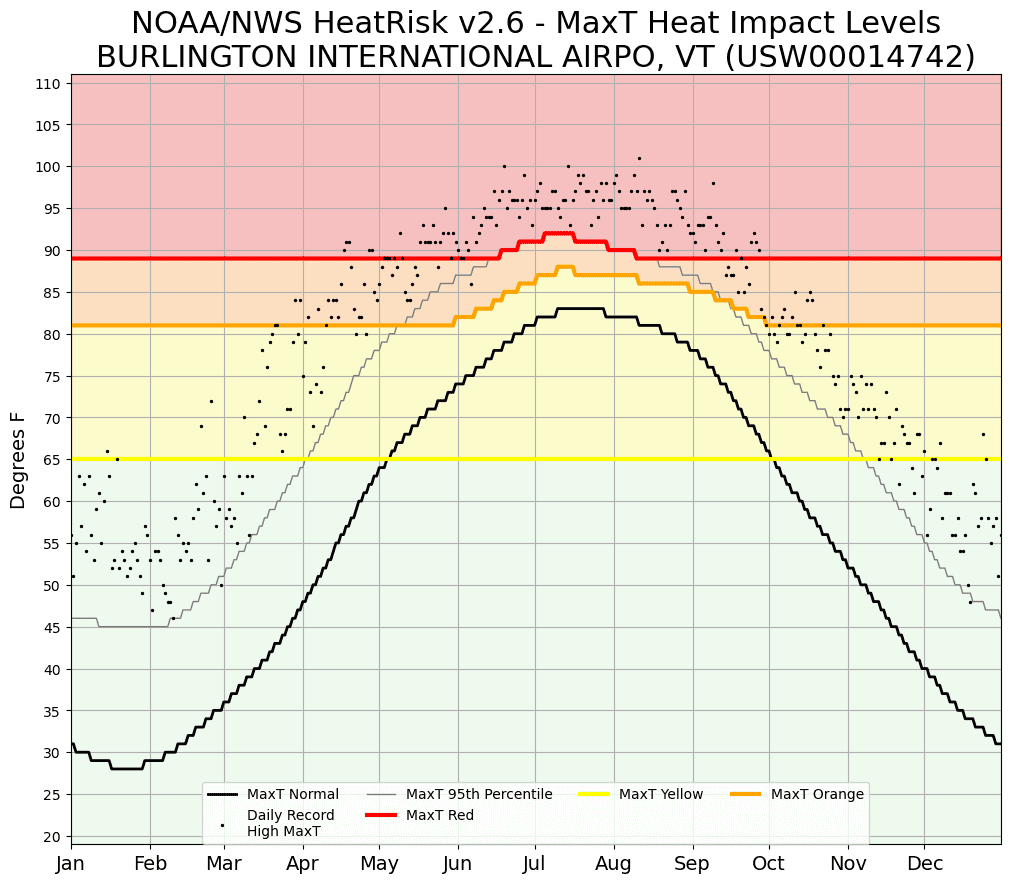

HeatRisk max temperature that corresponds to the impact levels in Table 2 for Burlington, Vermont. Bottom) Same as above, but for Newport, Vermont.[click to enlarge]
In this way, HeatRisk offers a more expansive framework, and it also provides data that has been connected to the number of heat impacts on health. Given the short duration of the extreme heat, several locations across Vermont and northern New York reached the “Major” category (Level 3 of 4). Portions of eastern Vermont remained in the “Moderate” category (Level 2 of 4) due to a relatively cool start to the morning on June 23rd and temperatures that did not warm quite as significantly across the region (Figure 8).
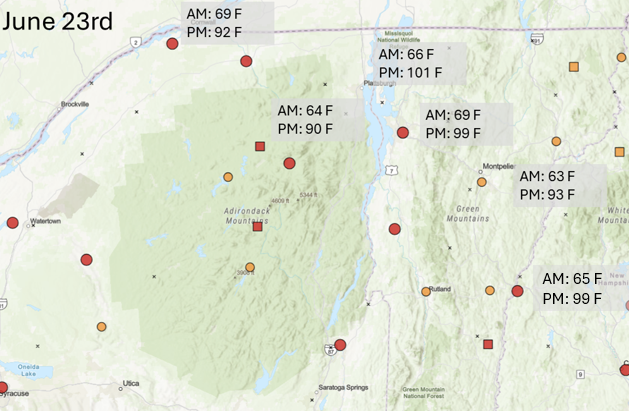
Figure 8: Historical HeatRisk analysis on June 23rd, 2025. Sites with circles are official sites, and sites with squares are supplemental. Xs indicate no observations or lack of a calculated HeatRisk chart. Each shape is colored based on their calculated HeatRisk category (Yellow - Minor, Orange - Moderate, Red - Major, Magenta - Extreme). The morning low and afternoon high for our main climate sites are shown.[click to enlarge]
Overnight temperatures in the upper 60s to mid 70s led to a warmer start for June 24th. High temperatures ranged in the 90s again on June 24th, but were a couple degrees cooler. Since HeatRisk takes the low temperature into account, many sections of eastern Vermont observed HeatRisk in the major category that had not the prior day (Figure 9). Several climate sites still observed or tied daily records with high dewpoints maintaining the uncomfortable conditions. However, showers and thunderstorms developed later in the afternoon, which provided relief from the sun. The high heat and humidity enabled several thunderstorms to become strong to severe before cooler weather could finally arrive.
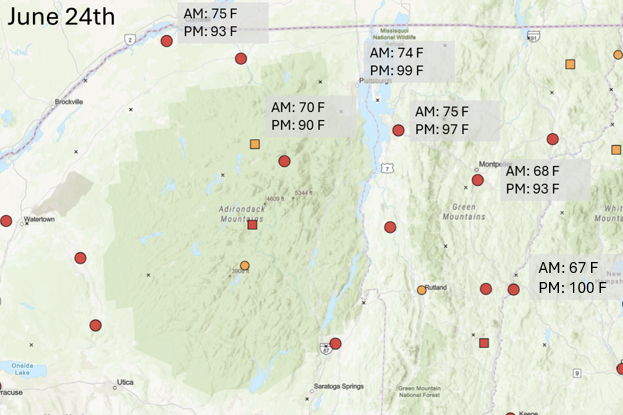
Figure 9: Same as Figure 8, but for June 24th, 2025. [click to enlarge]
With cooler temperatures behind the cold front, we did not achieve a heat wave, defined in our region as at least 3 days in a row with a max temperature above 90 °F. This outbreak of heat was short-lived, but significant. Our colleagues at the Eastern Region office compiled some of the impressive temperature statistics across Vermont and New Hampshire. Highlighting our region, it is possible that the North Springfield Lake COOP station’s report of 103 °F ties Vermont’s all time June temperature. Such observations undergo rigorous analysis of the instrument calibration. The last time any Vermont COOP observed a reading of 103 °F was in 2000 and 2001. Despite the short duration, this heat outbreak brought temperatures that haven’t been seen in over 20 years. In terms of heat index, the max hourly heat index at BTV was 108.6 °F on June 23rd, which ties for the 3rd highest value, last exceeded in 2002 (Table 3).
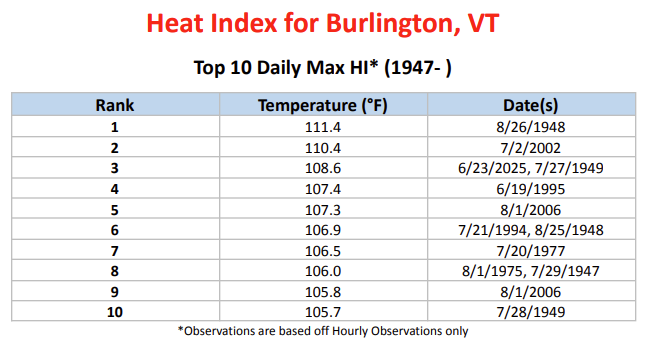
Table 3: The top 10 hourly heat index values for the weather observations at Burlington, Vermont from 1947-present. [click to enlarge]
The CDC makes available a heat tracker that shows the amount of heat-related illnesses over a span of time. The 95th percentile serves as a baseline to the observed rates. Heat impacts began rising, even the day before across New England. It peaked on June 24th before falling down once cooler weather arrived. The maximum rate was at least 3 times the 95th percentile, indicating the significant impact of heat on health care systems across New England from this event (Figure 10).

Figure 10: FEMA Region 1’s heat and health tracker. The red line marks the 95th percentile rate for emergency room or urgent care visits that are heat related. The brown line indicates the observed rate for each day as a comparison to the 95th percentile. Where the brown line is above that baseline are the observations on June 22nd through June 25th exceeded the 95th percentile rate. [click to enlarge]
A significant outbreak of heat produced record breaking temperatures coincident with rare mid 70s to upper 70s dewpoints. A large uptick in heat-related illnesses were recorded compared to baseline values, despite the short-lived nature of the event. This heat outbreak followed a typical weather pattern for very hot conditions across Vermont and northern New York. Observations of temperatures and heat indices not seen in over 20 years were observed in the Champlain Valley, and Plattsburgh, New York broke their monthly June record and tied the highest temperature in their period of record. Additionally, the North Springfield Lake COOP site potentially tied the Vermont state temperature record. For a complete list of heat indices observed across the region, find them here
References:
CDC Heat & Health Tracker: https://ephtracking.cdc.gov/Applications/heatTracker/
HeatRisk Overview: https://www.wpc.ncep.noaa.gov/heatrisk/pdf/HeatRisk-v2.6-Overview.pdf
HeatRisk Breakdown: https://www.wpc.ncep.noaa.gov/heatrisk/pdf/HeatRisk-v2.6-Understanding-HeatRisk.pdf
What’s in HeatRisk:
https://www.wpc.ncep.noaa.gov/heatrisk/pdf/HeatRisk-v2.6-Whats-in-HeatRisk.pdf
Internal Reviews performed by: NWS Burlington and by Paul Sisson and Jordan Scampoli in 2008. We apologize for a lack of linkable publication.
Thanks to Chris Stachelski at Eastern Region for digging through COOP data to find the potential heat record at North Springfield Lake.
Forecast sounding and analysis maps: Storm Prediction Center

