
A weather system in the Pacific Northwest will produce rain throughout the day, before a potent atmospheric river produces a prolonged round of heavy rainfall, widespread urban and river flooding, and high elevation snow to the region Monday through Wednesday. Showers and thunderstorms may produce isolated damaging winds, a brief tornado, and locally heavy rainfall across parts of Florida today. Read More >
 Email the author
Introduction
Severe weather is not a common occurrence in New England, especially when compared to places like the Central Plains and the Southeast United States. Banacos et al. (2012), noted that tornadic thunderstorms in the Northeast occur on an order of magnitude less than the Central Plains, (e.g., 2.4 per year compared to 20-25 per year respectively). It is plausible that the frequency of non-tornadic severe weather should then also occur on at least the same order. The maintenance of accurate records of spatial and temporal distributions of severe weather events is important in cultivating proper situational awareness for operational meteorologists. By better understanding preferred locations and timing for convective initiation and severe weather development, NWS forecasters can be better prepared ahead of a severe weather event.
Previous work (Schaefer and Edwards 1999; Weiss et al., 2002; Doswell et al., 2005; Paulikas 2013) has detailed inherent biases within severe weather reports, including population biases and temporal artifacts such as increased emphasis on warning verification, deployment of WSR-88D Next-Generation Radar (NEXRAD) radars and increased public awareness. These studies (Schaefer and Edwards 1999; Weiss et al., 2002; Doswell et al., 2005; Paulikas 2013) found that there was an increase in severe hail and wind reports around urban centers, but relatively little increase in tornado reports. NWS warning verification initiatives in the 1980s, which aimed to hold NWS warning products accountable by verifying warnings issued, noticeably increased the number of storm reports following its implementation (Doswell et al. 2005). NEXRAD radar deployment throughout the 1990s increased radar coverage nationwide and provided additional storm information such as storm relative motion (SRM) and vertically integrated liquid (VIL), further increasing the likelihood of detecting storms. The ability to better detect severe storms augments the number of severe weather reports. Additionally, increased public awareness of weather events, and improved means of communication (e.g. email and social media), further increases the probability that someone will be willing to report a severe storm.
Topographic features, such as the Adirondack and Green Mountains, and Lake Champlain, influence the spatial distribution of reports. These features not only influence the distribution of population throughout the area, but also the initiation and development of mesoscale weather systems. Wasula et al. 2002 and Lombardo and Colle 2011 detailed the influence of terrain on storm structures and development across the Northeast. These studies Wasula et al. 2002 found preferential north-south oriented river valleys, such as the Hudson River valley, play an instrumental role in severe weather enhancement and favorable veering profiles during tornado occurrences. This terrain-channeled southerly flow aids in the convergence of warm, moist unstable air where then storms can become severe.

Figure 1: Topographic map of severe weather climatology domain which includes BTV’s CWA and the two southernmost counties of Vermont: Bennington and Windham. [click to enlarge]
Data and Methods
Severe weather records for National Weather Service (NWS) Burlington, Vermont (BTV) date back to the 1950s. These records include reports of tornadoes, hail and convective wind gusts (both measured and estimated through damage reports). Severe weather trends were plotted from May – September 1950–2016. Severe weather report archives are available from the Storm Prediction Center (SPC) Severe Weather database [available online at: http://www.spc.noaa.gov/]. Data reports archived in the SPC database are retrieved from an official local storm report (LSR) summary of events issued by each individual NWS office. To make it into the official SPC database, a storm report must meet specific NWS criteria of a severe thunderstorm. The criteria as of January 2010 include: measured or estimated convective wind gusts of at least 58 mph, hail at least 1” in diameter, or a tornado. Prior to 2010, hail stones greater than 0.75” were considered severe (Marshall et al. 2002). These have been retained in this study to accurately represent severe weather reporting throughout the majority of the historical record. For the period of this climatology (1950-2016) there were 2379 wind reports, 953 hail reports, and 59 tornado reports. These reports were plotted both spatially and temporally by year, month, and day for each severe criterion. The domain covered includes all of BTV’s CWA plus Bennington and Windham counties in southern Vermont. These counties were included for a complete climatology of Vermont.
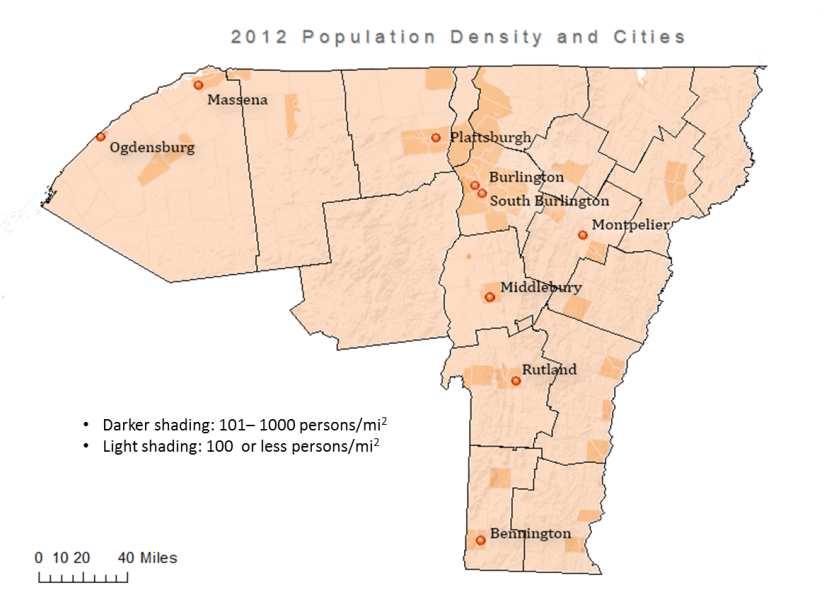
Figure 2: Map of population density for domain covered. Darker shading indicates areas of higher population density compared to lighter shaded areas. [click to enlarge]
Results
The population of BTV’s CWA is primarily concentrated around the Burlington metro area, with smaller population centers around Montpelier, and Rutland, Vermont, and Plattsburgh, New York, with relatively sparse population elsewhere (Fig. 2). Both severe hail and wind reporting are subject to biases based on the population distribution of the domain covered. The more populous areas tend to have more severe reports compared to rural areas. Paulikas (2013) noted an increase due to population upwards of 777% in total reports for wind reports, and a staggering 2930% increase in hail reports from 1981-2006 for the Atlanta metro area, including the urban core and outer suburbs. Atlanta’s urban core saw the population density increase from 200 persons per km2 in 1960 to over 700 persons per km2 in 2010, with growth of the outer suburbs by over a factor of seven (28 persons per km2 in 1960 to 189 persons per km2 in 2010) during this same time period.
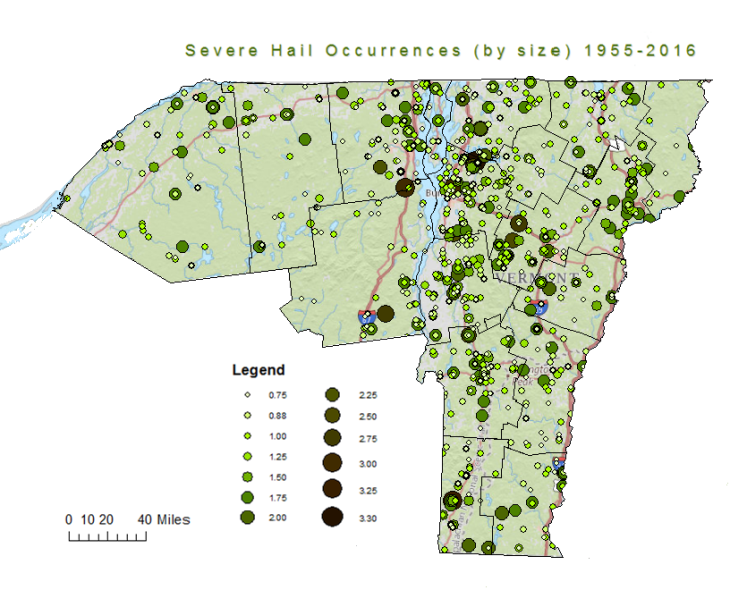
Figure 3: Severe hail reports by size from 1955-2016. [click to enlarge]
While the state of Vermont is not as populous as the Atlanta metro area (~625,000 versus 5.5 million), nearly one-third of the state of Vermont resides in the Burlington metro area (Burlington, South Burlington, Winooski, Colchester, Essex, Milton, St. Albans, and Essex Junction) with over 210,000 people estimated as of 2012 (U.S. Census Bureau). This concentration of population, and subsequently reports, around the Burlington area is apparent in both hail and wind reports (Fig. 3 and 4) however, the concentration around Burlington is more noticeable in wind reports compared to hail reports. This is likely due to wind threats occurring more frequently than hail threats. Figures 3 and 4 show a strong association between road networks and reports, in addition to secondary clusters around the cities of Montpellier, Rutland, and Middlebury, VT, and Plattsburgh, NY. With lower population densities, however, the concentration of reports is respectively less. A similar relationship can be established over the Adirondack Mountains and portions of Vermont, including the Northeast Kingdom and areas within the Green Mountains, with exceedingly small population densities corresponding with sparse coverage of reports. The lack of reports across these areas does not mean that severe weather does not happen there, but rather it is less likely to be observed and/or reported. Figure 5 shows that tornado reports do not appear to be affected by population. This is supported by findings (Paulikas 2013; Doswell et al. 2005) that showed national tornado reporting since 1950 has had little correlation to population density throughout the United States.
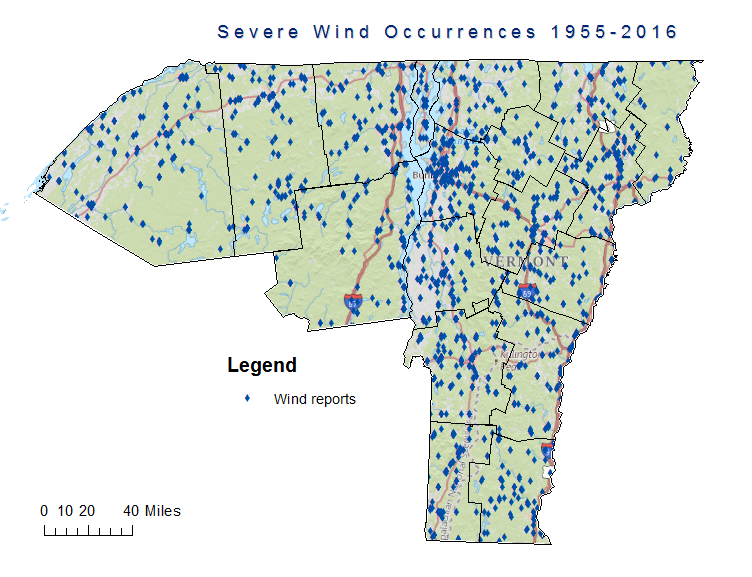
Figure 4: Figure 4: Severe wind reports from 1955–2016. [click to enlarge]
Terrain influenced convective modes produce different types of severe hazards which may influence the spatial distribution of severe reports. Although infrequent throughout the domain, tornado reports appear to follow preferential north-south oriented valleys like the Champlain valley consistent with findings by Wasula et al. (2002). Lombardo and Colle (2011) noted that cellular convection was observed more frequently over the high terrain compared to the interior lowlands lying to the west, which includes the St. Lawrence valley. Additionally, as noted by Lombardo and Colle (2011), the interior lowlands more frequently observed linear storms compared to the high terrain. While these storms structures may be more frequent across these areas respectively, it is difficult to say without additional research that the distribution of severe reports is influenced by these convective modes.
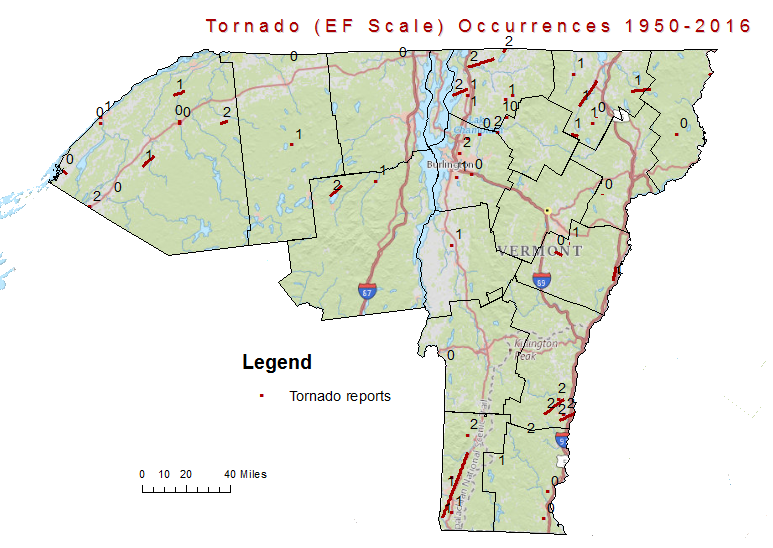
Figure 5: Tornado reports and Enhanced Fujita (EF) scale ranking. [click to enlarge]
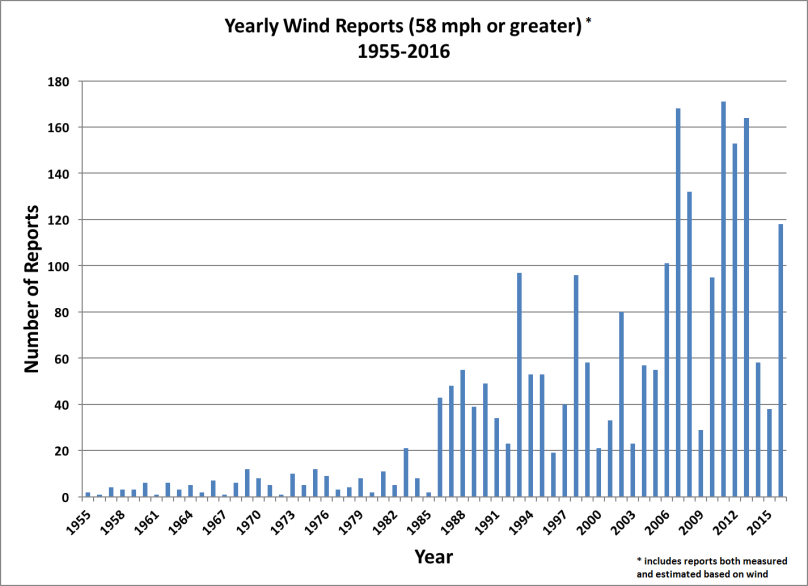
Figure 6: Annual severe wind reports 1955-2016. [click to enlarge]
Annual trends in severe weather reports are dependent upon several different factors. These include warning initiatives implemented by the NWS, NEXRAD radar deployment and yearly synoptic variability. In the mid-1980s, NWS implemented a warning verification program across the United States which served to hold products accountable (Doswell et al. 2005). Yearly wind and hail reports show a spike in reports following 1986 (Fig. 6 and 7), which can likely be attributed to increased emphasis on warning verification. This increase is not noticeable in tornado reports which are more sensitive to annual variations in severe weather (Fig. 8).
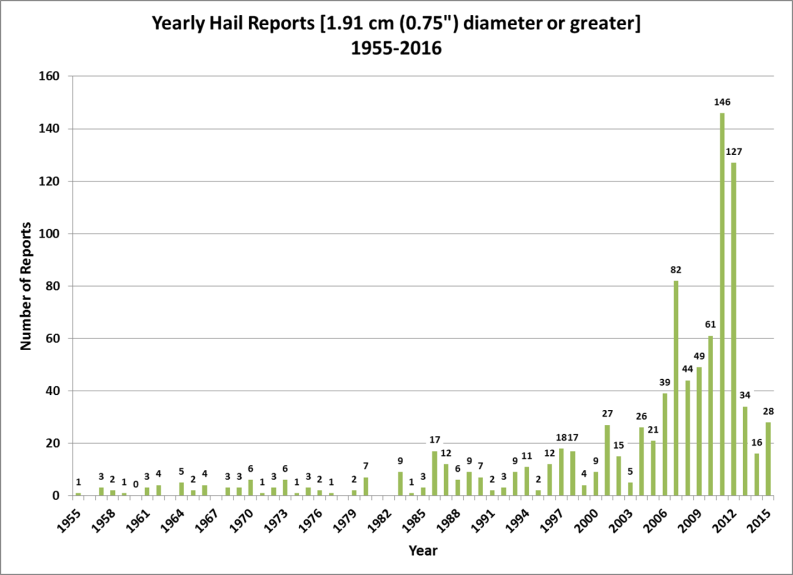
Figure 7: Annual severe hail reports from 1955-2016. [click to enlarge]
National deployment of NEXRAD radars began in 1991. BTV received their first NEXRAD radar (KCXX) located in Colchester, VT, on March 6, 1997. A second NEXRAD radar (KTYX) was commissioned at Fort Drum, NY, on November 6, 1997 (J. Schultz, Personal Communication). Both radars received an additional update in 2012 to a dual-polarized system. There does not appear to be a strong association between severe weather reports and NEXRAD radar installations for BTV either. Again, because severe weather is less frequent in New England, annual differences in prevailing weather patterns that produce severe weather may mute the noticeability of artifacts such as the deployment of the NEXRAD radar.
In addition to the warning verification program, active years for severe weather in the Northeast are evident primarily in hail and wind reports (Fig. 9). For example, 2011 was a particularly active year across much of the United States, including the Northeast. This year is noteworthy in New England for producing the EF-3 Springfield, Massachusetts, tornado on June 1, 2011, as well as spawning 6 confirmed tornadoes across Massachusetts and Maine (Banacos et al. 2012).
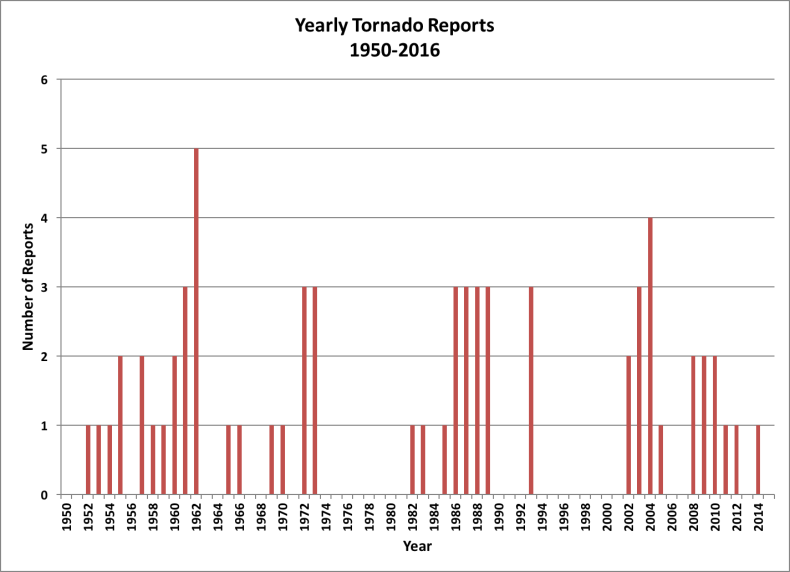
Figure 8: Annual tornado reports from 1950-2016. [click to enlarge]
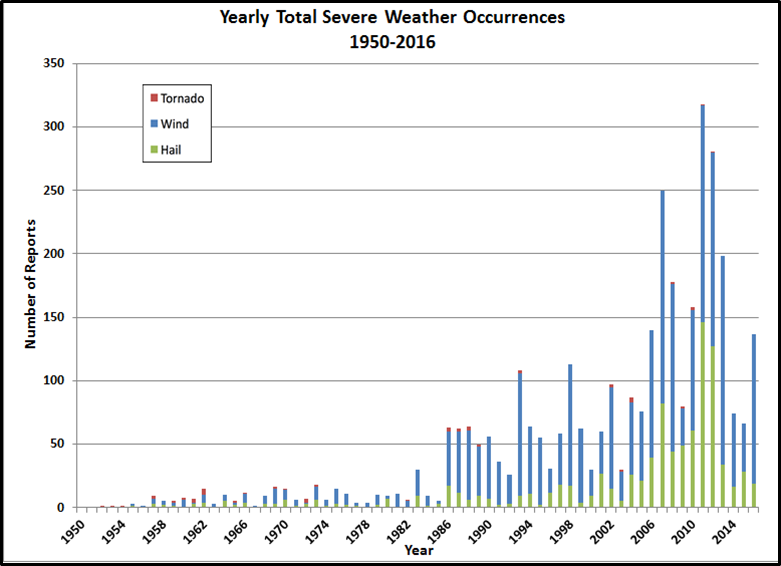
Figure 9: Annual distribution of all severe weather reports for 1950-2016. Arrow is peak in 2011. [click to enlarge]
Figure 10 shows the monthly maximum for all severe reports in BTV’s CWA is July with 37.4% of warm season reports during this month (1108 of 2963 reports). This is not surprising given this is the warmest month of the year and thermodynamic support from warm and moist boundary layer conditions is at its strongest. Following July, May and June are closely tied for second place for hail reports. This is likely attributed to lower freezing levels during this time which help provide a larger hail growth zone and aid in the development of steep low-level lapse rates. Closer detail of the monthly report is shown in the 10-day composite graph (Fig. 12). This graph shows the peak of severe weather occurrences is 1–10 July followed closely by the remainder of the month. Interestingly, 74.8 % (154 of 206) of hail reports during the month of May occur from 21–31 May.
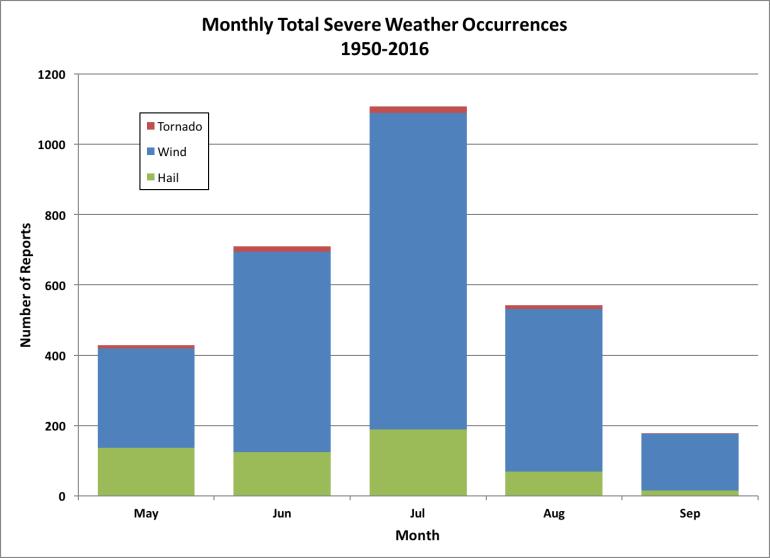
Figure 10: Monthly distribution of all reports from 1950-2016. [click to enlarge]
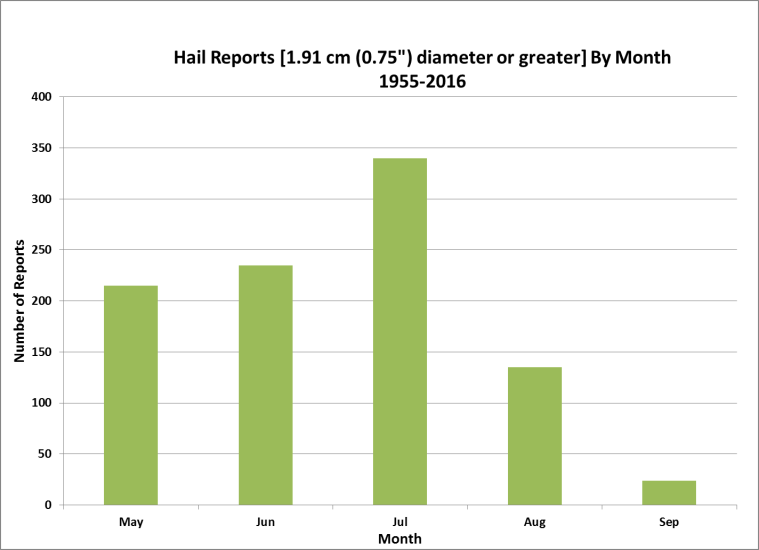
Figure 11: Monthly distribution of hail reports 1955-2016. [click to enlarge]
Hourly frequency of severe weather reporting is directly tied to late morning–early afternoon convective development; consist with findings by Lombardo and Colle (2011), with a noticeable increase in reports from 1100–1300 EDT (Fig. 13). A secondary peak is observed in both wind and hail reports from 1500–1700 EDT (Fig. 14 and 15). Wind reports can be seen extending into the late evening hours, compared to hail reports which show a relatively sharp decline after 1800 EDT. These temporal shifts in reporting of wind versus hail continue to correspond well with findings by Lombardo and Colle (2011) and Smith et al. (2012) who noted a correlation between linear storm structures during the mid to late afternoon hours compared to the earlier development of isolated and clustered cells. Tornado reports varied considerably throughout the day with two noticeable peaks occurring at 1600 EDT and 1800 EDT (Fig. 16). Stronger, more mature, storms which are able to develop later on in the day, are likely to produce tornadoes compared to earlier convection.
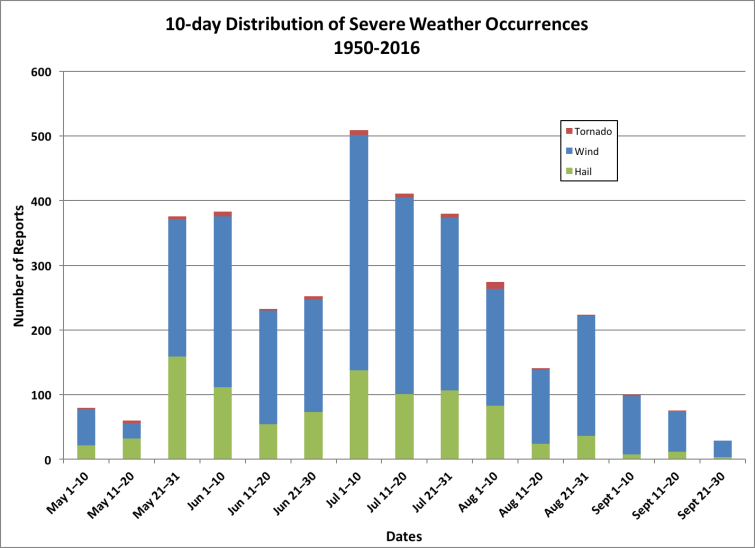
Figure 12: Ten-day distribution of all reports from 1950-2016. [click to enlarge]
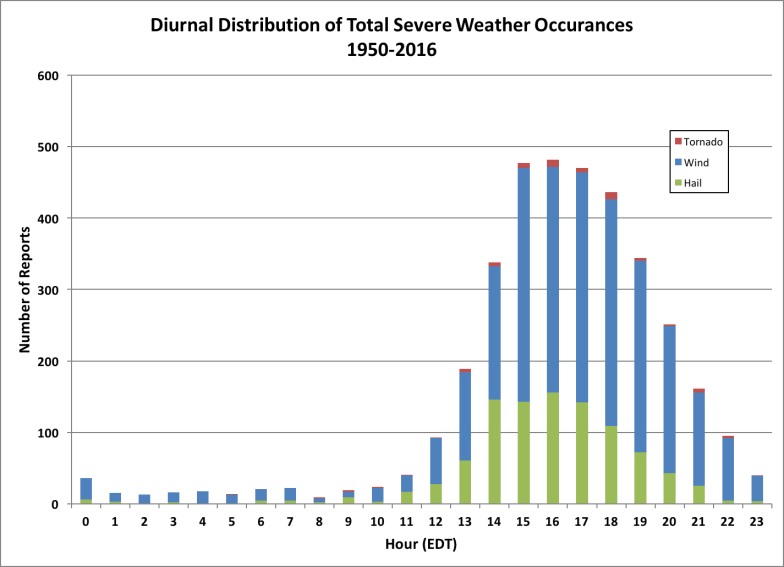
Figure 13: Diurnal distribution of all reports from 1950-2016. [click to enlarge]
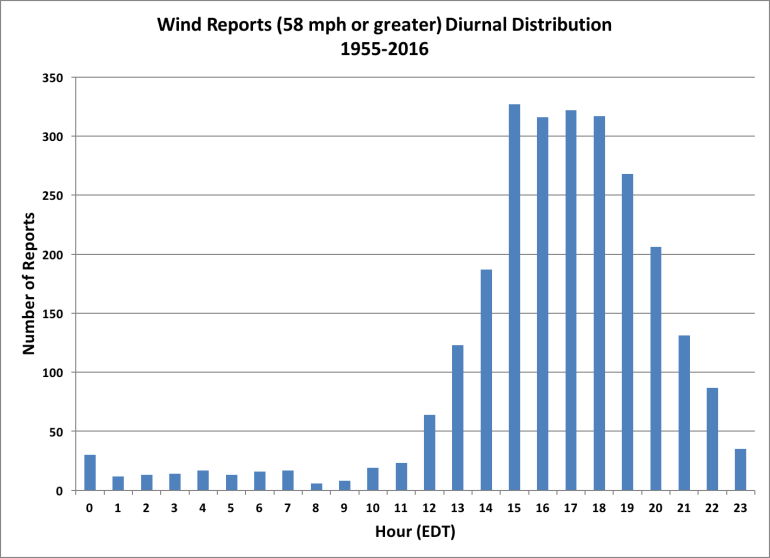
Figure 14: Diurnal distribution of wind reports 1955-2016. [click to enlarge]
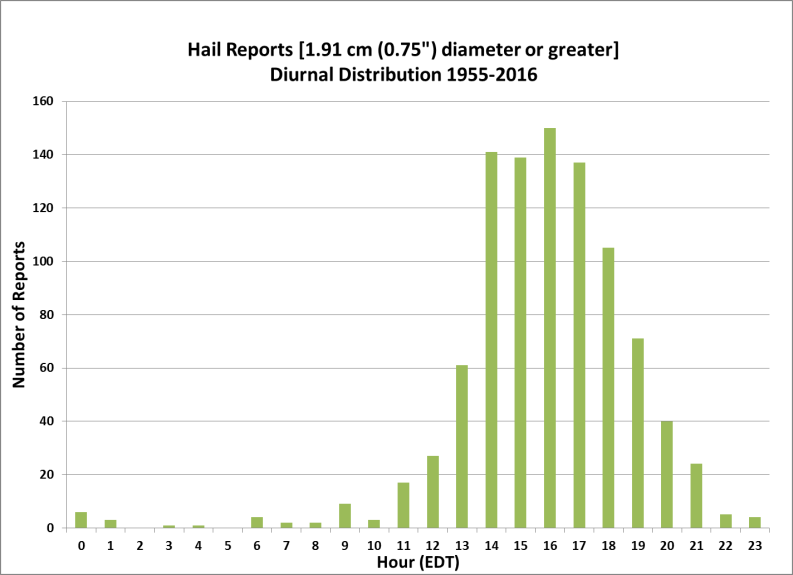
Figure 15: Diurnal distribution of hail reports 1955-2016. [click to enlarge]
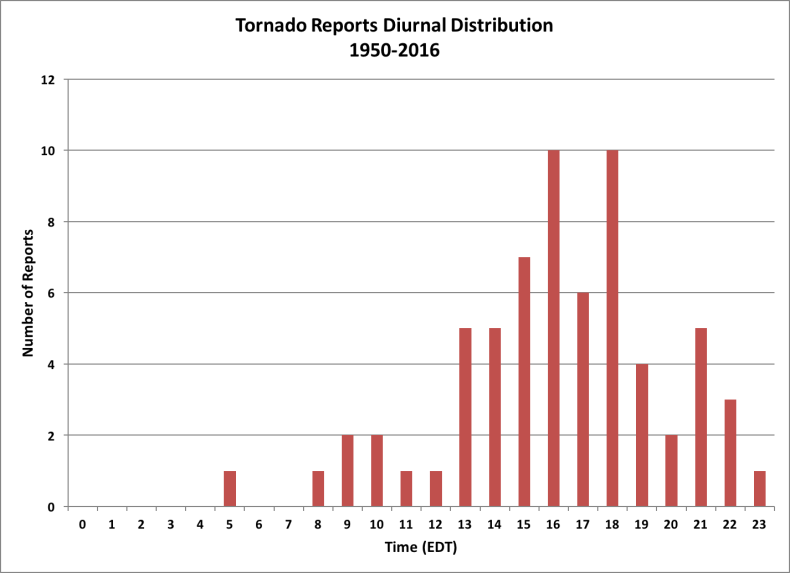
Figure 16: Diurnal distribution of tornado reports 1950-2016. [click to enlarge]
Conclusions
Similar to previous studies which looked at the distribution of reports, the same internal artifacts were present within this database (population biases, warning verification initiatives, NEXRAD deployment, etc.,) although some were not as pronounced as others. Population biases were most noticeable in hail and wind reports, with little impact on tornado reports. Additionally, tornado occurrences in the Northeast were influenced by terrain features such as north-south oriented river valleys.
Due to the infrequency of severe weather in the Northeast, annual variability played a large role in the annual distribution of hail and tornado reports. For all three types of reports, July was the peak. Hail reports were most frequent during the early afternoon hours, with wind and tornado reports more common during the late afternoon and evening hours. This distribution is supportive of the types of storms that produce each hazard, with more mature storms later on in the day producing severe wind damage and tornadoes.
References
Banacos, P. C., M. L. Ekster, J. W. Dellicarpini, and E. J. Lyons, 2012: A multiscale analysis of the 1 June 2011 Northeast U.S. severe weather outbreak and associated Springfield, Massachusetts tornado. Electronic J. Severe Storms Meteor., 7 (7), 1-40.
Doswell. C. A., III, H.E. Brooks, and M. P. Kay, 2005: Climatological estimates of daily local nontornadic severe thunderstorm probability for the United States, Wea. Forecasting, 20, 577-595.
Lombardo, K. and B. A. Colle, 2011: The spatial and temporal distribution of organized convective structures over the Northeast and their ambient conditions, Mo. Wea. Rev., 138, 4456-4474
Marshall, T.P., Richard F. Herzog, and Steven R. Smith, 2002:, 21st Conference on Severe Local Storms, San Antonio, TX
Schaefer, J. T., and R. Edwards, 1999: The SPC tornado/severe thunderstorm database. Preprints, 11th Conf. on Applied Climatology, Dallas, TX, Amer. Meteor. Soc., 603–606.
Smith B.T., R. L Thompson, J. S. Grams, and C. Broyles, 2012: Convective modes for significant severe thunderstorms in the contiguous United States. Part I: Storm classification and climatology, Wea. Forecasting, 27, 1114-1135, DOI: 10.1175/WAF-D-11-00115.1.
Paulikas M.J., 2013: Examining population bias relative to severe thunderstorm hazard reporting trends in the Atlanta, GA metropolitan region, Meteorol. Appl., 21, 494–503, DOI: 10.1002/met.1394
Wasula, A. C., L. F. Bosart, and K. D. LaPenta, 2002: The influence of terrain on the severe weather distribution across interior eastern New York and western New England. Wea. Forecasting, 17, 1277–1289.
Weiss S.J., J.A. Hart, P.R. Janish, 2002: An examination of severe thunderstorm wind report climatology: 1970-1999, 21st Conf. on Severe Local Storms, San Antonio, TX, Amer. Meteor. Soc., 11B.2, https://ams.confex.com/ams/SLS_WAF_NWP/techprogram/paper_47494.htm.

